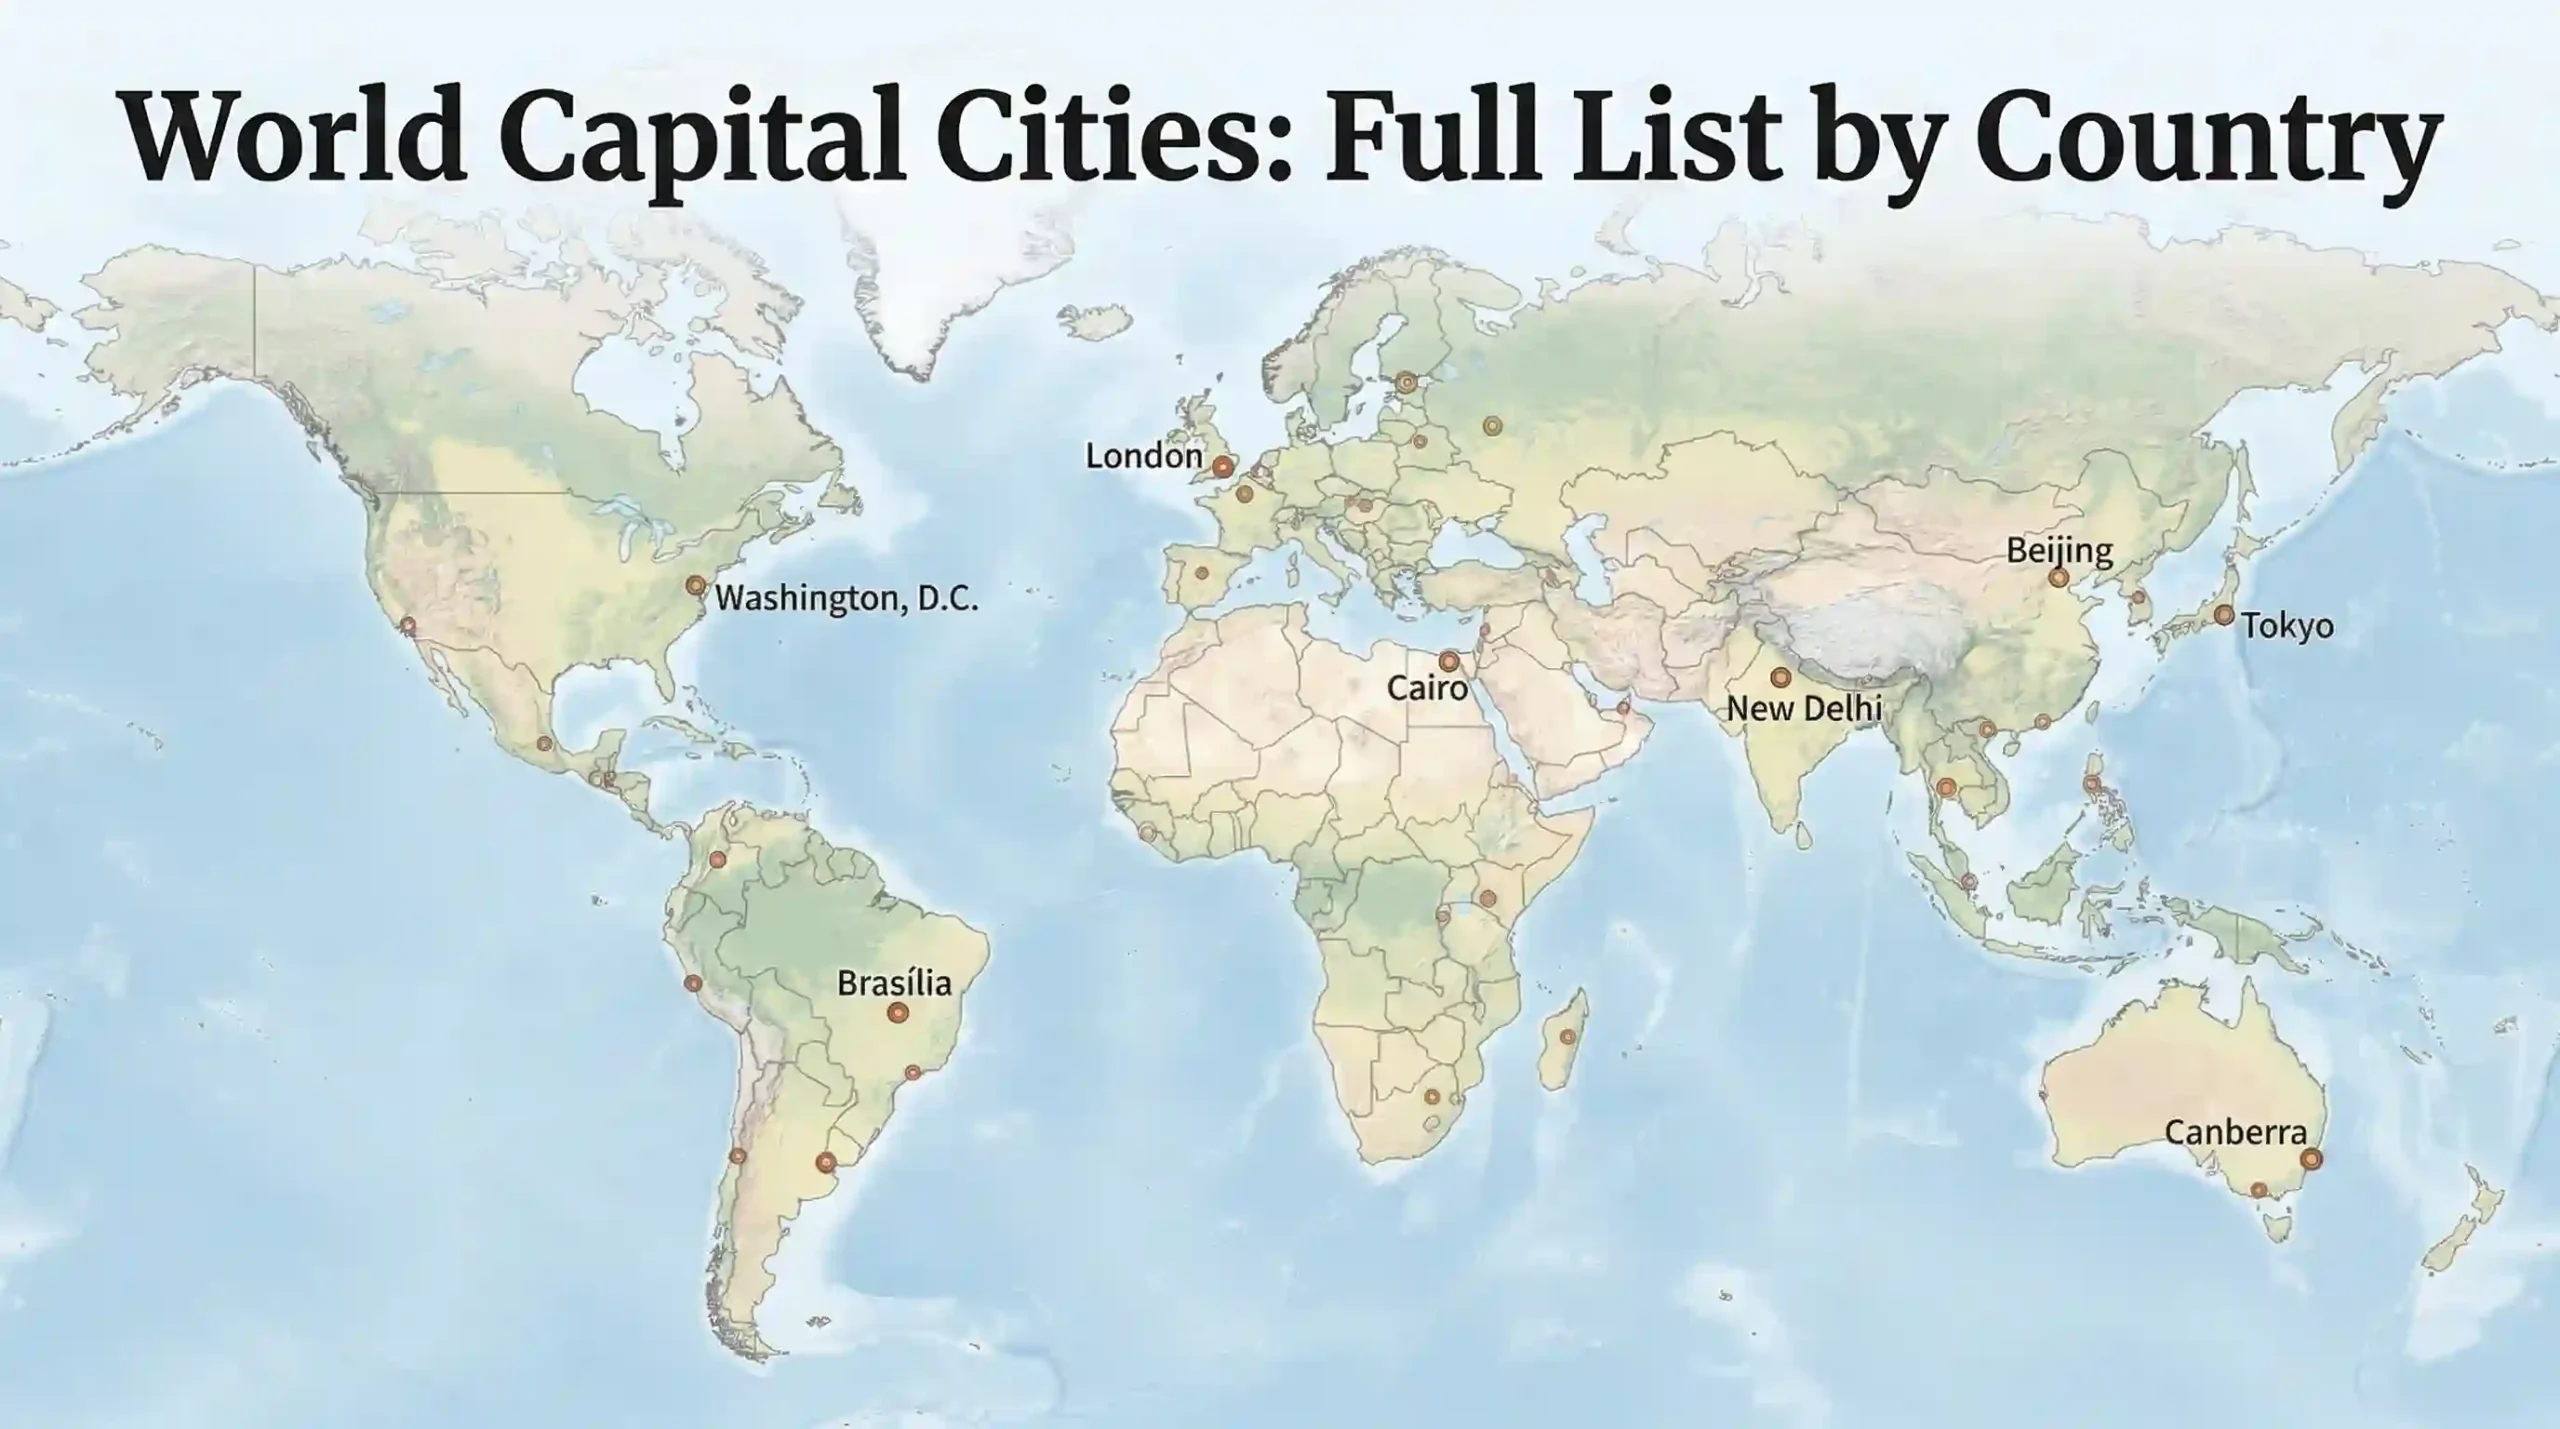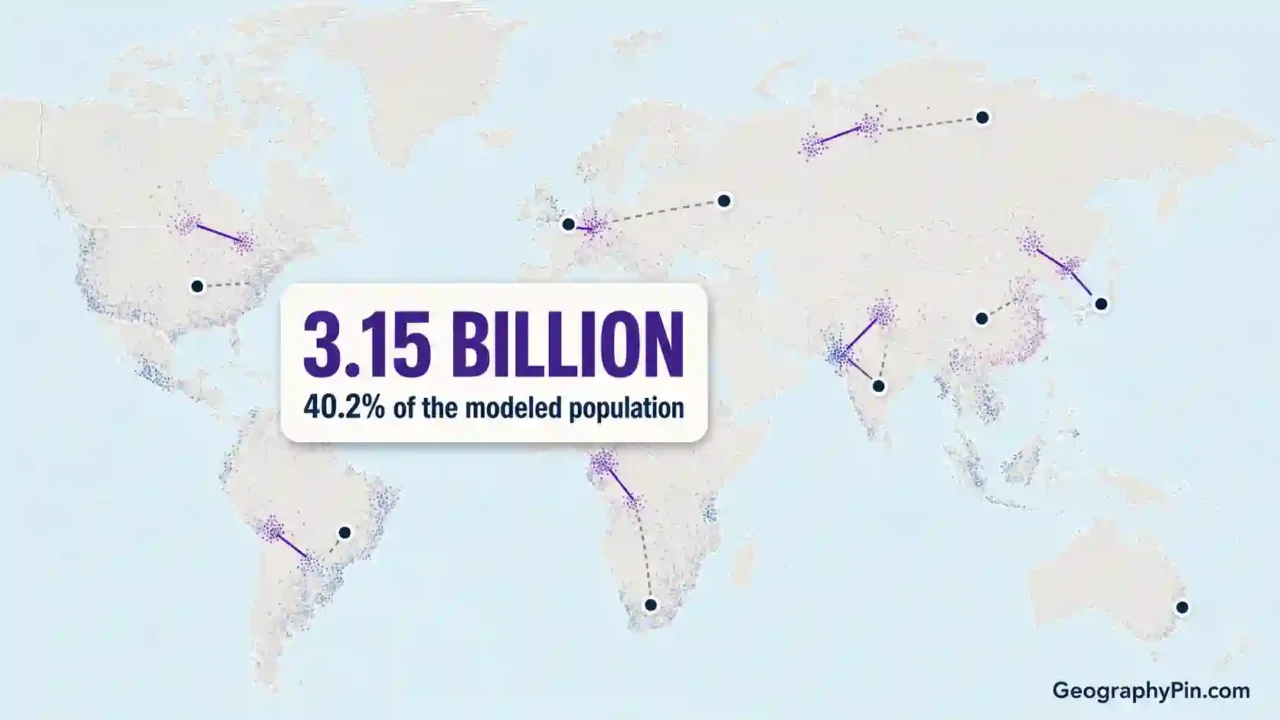
About 3.15 billion people—40.2% of the population represented in the 2020 grid—live closer in straight-line distance to another state’s reference capital than to their own. This is a modeled estimate, not an official census statistic; it uses a 195-state convention and explicit rules for split, disputed and changing capitals.
How to use this article: Start with the headline and coverage check, compare the largest country totals, inspect the capital and recognition rules, or review what the estimate cannot show.
The Model Estimates About 3.15 Billion People
The baseline calculation returns 3.146 billion people out of 7.815 billion represented by the 195-state analysis. That equals 40.25%, which is best communicated as about 3.15 billion people, or roughly two in five. The figure is a sum of fractional population estimates in cells about 0.6 miles (1 kilometer) across, so rounding is more honest than presenting it as a person-by-person count (GeographyPin calculation from GHS-POP R2023A).
Fast check: the four numbers that matter
- Raw 2020 population-grid total: 7.841 billion
- Population covered by the 195-state baseline: 7.815 billion, or 99.67% of the raw grid
- Closer to another state’s reference capital: 3.146 billion
- Share of the covered population: 40.25%
The input is the European Commission Joint Research Centre’s GHS-POP R2023A population grid. It estimates residential population per cell by disaggregating census or administrative totals with information about built-up areas. The 2020 layer is an estimate; its 2025 and 2030 layers are projections (European Commission Joint Research Centre, GHS-POP R2023A).
The 195-state baseline excludes about 25.5 million people assigned by the boundary lookup to Taiwan, Kosovo or the separate Western Sahara unit rather than forcing them into a sovereignty convention. About 0.3 million more fall in generalized coastal or disputed cells that the country lookup did not assign. The broader sensitivity test brings the modeled coverage to effectively the whole grid.
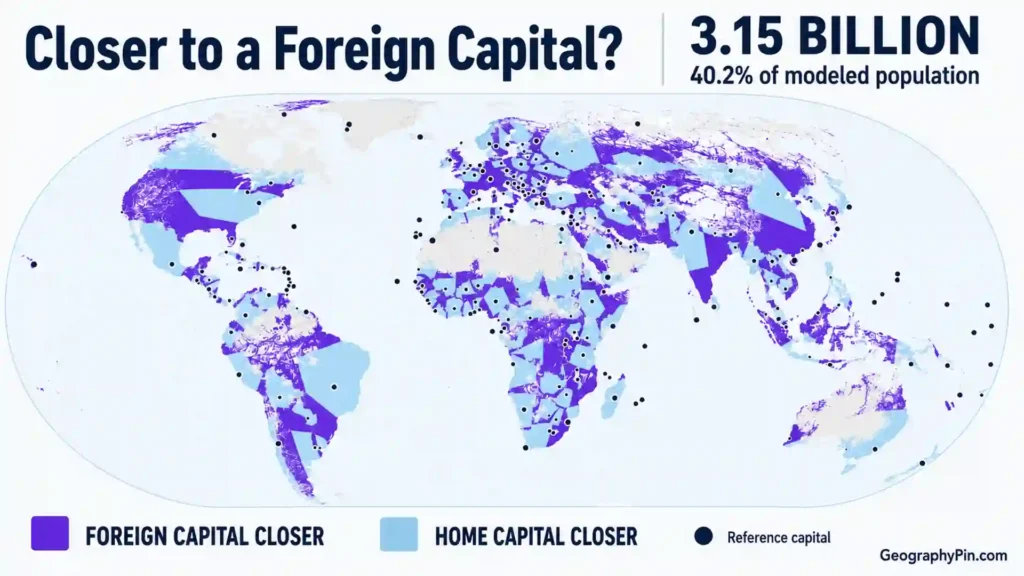
This is not a count of people who live close to an international border. A resident can be hundreds or thousands of miles from any border and still be nearer to a foreign capital, especially when the home capital lies at the far side of a large country.
Which Countries Contribute the Most?
Population size and capital location work together. India and China dominate the total because both have very large populations, and their capitals sit far from several densely populated regions. Together they account for 51.6% of everyone counted on the foreign-capital side of the baseline.
Largest totals by residents affected
| Home state | People closer to a foreign capital | Share | Largest nearer-capital groups |
|---|---|---|---|
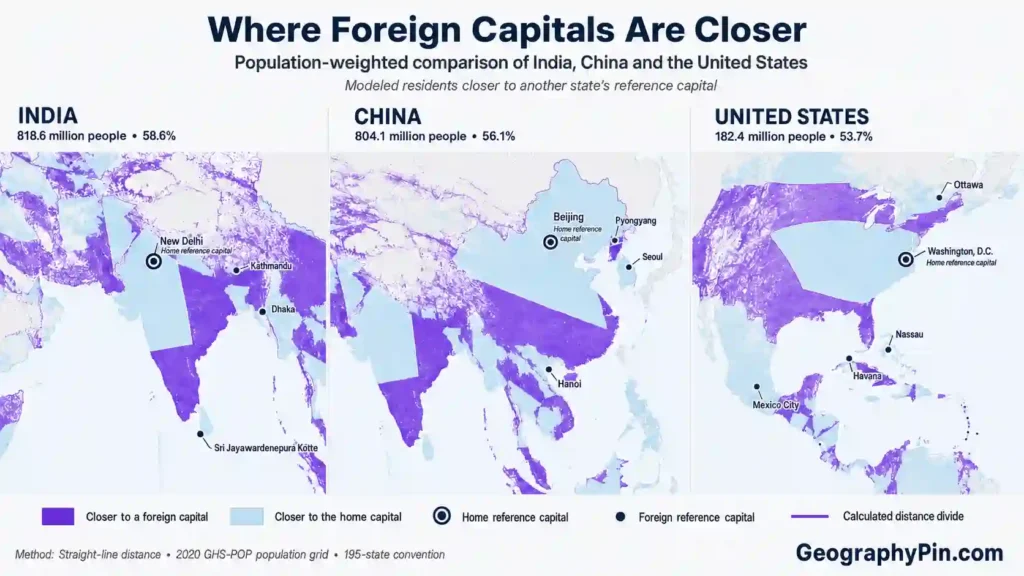
| India | 818.6 million | 58.6% | Kathmandu, Sri Jayawardenepura Kotte, Dhaka |
| China | 804.1 million | 56.1% | Hanoi, Seoul, Pyongyang |
| United States | 182.4 million | 53.7% | Mexico City, Ottawa, Havana |
| Indonesia | 96.9 million | 35.7% | Dili, Kuala Lumpur, Singapore |
| Russia | 82.8 million | 56.0% | Astana, Tbilisi, Helsinki |
| Nigeria | 80.9 million | 38.8% | Porto-Novo, N’Djamena, Niamey |
| Pakistan | 66.4 million | 29.2% | Kabul, Muscat, New Delhi |
| Democratic Republic of the Congo | 63.9 million | 69.2% | Gitega, Kigali, Lusaka |
| Germany | 63.7 million | 76.3% | Luxembourg, Amsterdam, Vaduz |
| Vietnam | 53.8 million | 55.6% | Phnom Penh, Vientiane |
India illustrates why a population grid matters. About 284.1 million residents fall nearer to Kathmandu than New Delhi, 269.4 million nearer to Sri Jayawardenepura Kotte and 180.4 million nearer to Dhaka. Those are modeled cell sums, not metro populations. In China, Hanoi is the nearest foreign reference capital for about 453.2 million residents under the 195-state baseline.
The highest shares are not always in the largest countries
To prevent very small states from dominating a percentage ranking, this comparison includes only states with at least one million people in the grid. Italy, Mozambique and Germany lead because nearby small-state capitals and neighboring capitals divide large parts of their populated territory away from Rome, Maputo and Berlin.
| State | Share closer to a foreign capital | People closer to a foreign capital |
|---|---|---|
| Italy | 79.1% | 47.1 million |
| Mozambique | 78.4% | 24.5 million |
| Germany | 76.3% | 63.7 million |
| Israel | 69.9% | 6.4 million |
| Democratic Republic of the Congo | 69.2% | 63.9 million |
| State of Palestine | 65.6% | 3.0 million |
| Kazakhstan | 61.4% | 11.6 million |
| Saudi Arabia | 59.5% | 21.4 million |
| India | 58.6% | 818.6 million |
| Iran | 57.2% | 50.0 million |
The Israel and State of Palestine rows are especially sensitive to boundary and capital conventions. The model uses Jerusalem for Israel and Ramallah as the Palestinian administrative reference point, avoiding an artificial distance tie from assigning the same disputed Jerusalem coordinate to both. This is a computational rule, not a position on sovereignty.
Why Capital Conventions Change the Result
There is no definition-free global answer. “Country” can follow several recognition conventions, while “capital” can mean a constitutional capital, an executive seat, a legislative capital or a practical government center. The baseline therefore uses a declared rule rather than mixing definitions from case to case.
The baseline rule and three sensitivity tests
The main scope is the common 195-state convention: 193 United Nations member states plus the Holy See and State of Palestine, the two non-member observer states (United Nations). GeographyPin’s world capital cities reference explains the current legal, practical and disputed cases behind that list.
| Scenario | People closer to another capital | Share of covered population |
|---|---|---|
| 195 states, reference capitals | 3.146 billion | 40.25% |
| 195 states, selected government-seat alternatives | 3.159 billion | 40.42% |
| 198 analytical jurisdictions, reference capitals | 3.246 billion | 41.40% |
| 198 analytical jurisdictions, selected government-seat alternatives | 3.260 billion | 41.57% |
Table downloads (3)
- Top 10 state totals under the 195-state reference-capital convention; GeographyPin calculation from GHS-POP R2023A (11 × 4)View tableDownload CSV
- Highest foreign-capital shares among states with at least one million represented residents; GeographyPin calculation from GHS-POP R2023A (11 × 3)View tableDownload CSV
- How political and capital definitions move the global estimate; GeographyPin sensitivity calculation (5 × 3)View tableDownload CSV
Switching selected formal-capital cases to their principal government-seat alternatives changes the 195-state estimate by only 13.4 million people, or 0.17 percentage points. The headline is therefore fairly stable across the official-versus-practical capital question, even though individual countries can move much more. South Africa is the clearest example because using all three capital cities produces a different internal dividing line from using Pretoria alone.
The broader 198-jurisdiction test adds Taiwan, Kosovo and the separate Western Sahara analytical unit without presenting that choice as a recognition judgment. It raises the total by about 100.9 million and the share by 1.16 percentage points. Taipei becomes the nearest capital point for about 396.3 million people in the expanded model, mostly in China, although many of those cells were already nearer to another foreign capital in the 195-state baseline.
How split and exceptional capitals were handled
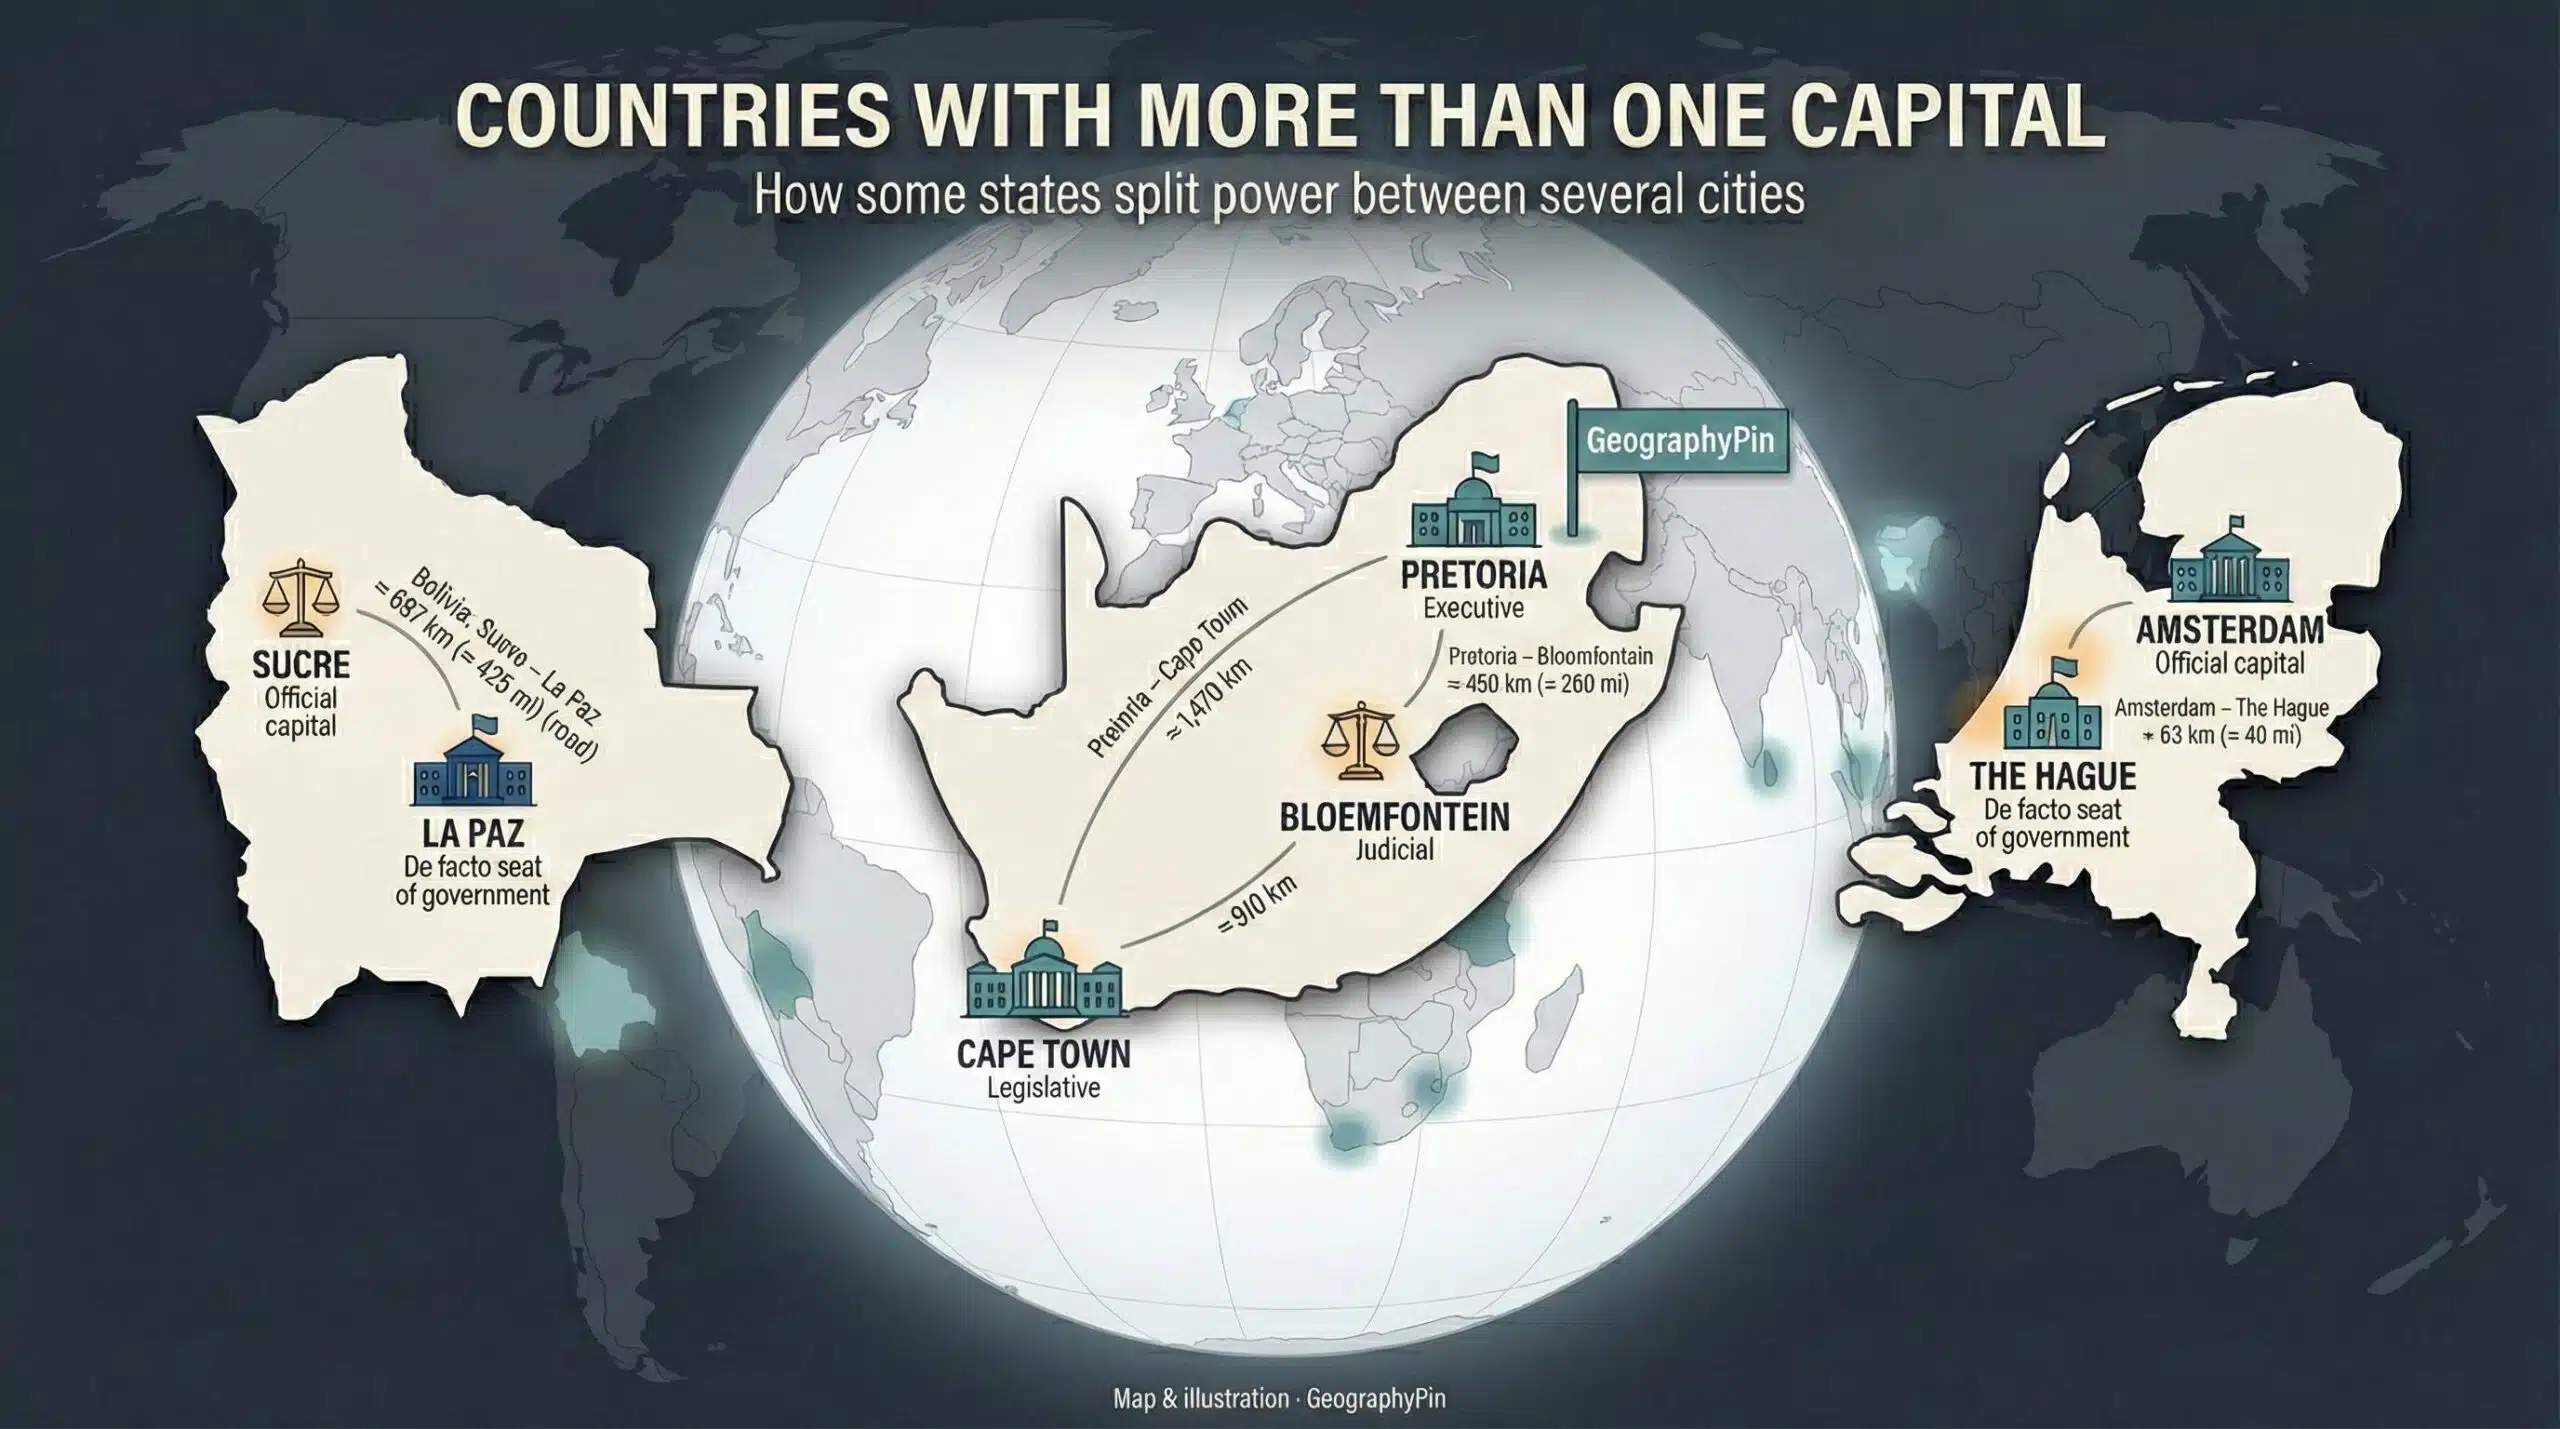
- Multiple formal capital roles: the reference scenario allows Pretoria, Cape Town and Bloemfontein for South Africa, and Mbabane and Lobamba for Eswatini. A resident’s nearest own capital is whichever of those points is closest.
- Official capital versus government seat: the baseline uses choices such as Sucre, Amsterdam, Porto-Novo, Yamoussoukro, Kuala Lumpur and Sri Jayawardenepura Kotte. The alternative uses La Paz, The Hague, Cotonou, Abidjan, Putrajaya and Colombo.
- No formally designated capital: Yaren is used for Nauru and Bern for Switzerland because each functions as the practical national seat.
- State of Palestine: Ramallah is the operational point for the distance model; East Jerusalem remains the claimed capital and its status is disputed.
- Recent changes: the current capital list uses Ciudad de la Paz for Equatorial Guinea after the January 2, 2026 decree
Readers who want the legal and practical distinctions country by country can compare GeographyPin’s guide to countries with more than one capital. The calculation’s purpose is not to settle those disputes; it is to show how much the answer changes when a defensible alternative rule is applied.
How the Calculation Was Made
The method treats every populated cell, about 0.6 miles (1 kilometer) across, as a weighted observation. A cell with an estimated 2,000 residents contributes 2,000 people to the capital that is closest to its center; a cell with 20 residents contributes 20. This avoids the large error that would come from treating empty territory and dense urban areas equally.
Reproducible method in five steps
- Load the population surface. Use the 2020 GHS-POP R2023A grid at approximately 0.6-mile (1-kilometer) resolution in World Mollweide projection. Its positive cells sum to 7.841 billion people.
- Locate each cell. Convert every positive cell center to latitude and longitude, then assign it to a country-level land unit using Rapid Editor Country Coder version 5.6.1. Dependent territories are associated with their administering state in the 195-state model.
- Build the capital list. Assemble the working state and capital records with world-countries version 5.1.0, then match the capital points to Natural Earth’s 1:10 million populated-places data. Documented split-capital, disputed and later changes are handled as explicit overrides (Natural Earth, version 5.1.2).
- Measure distance. Calculate great-circle distance—the shortest path over a spherical Earth—from each cell center to every reference capital.
- Aggregate population. If the nearest capital belongs to a different state, add the cell’s population to the home-state total, the destination-capital total and the global total.
The output is a population-weighted capital Voronoi analysis. A Voronoi region is simply the area closer to one reference point than to any other. Here, capital points create the regions, national boundaries identify each resident’s home state and the population grid supplies the weight.
How to cite the estimate accurately
The compact finding is that GeographyPin’s model estimates 3.146 billion people, or 40.25% of the covered 2020 population grid, live nearer to another state’s reference capital than to their own. The population year, 195-state convention and straight-line-distance method should remain attached whenever the figure is quoted; without them, the estimate can be mistaken for a current census count.
What the Number Does—and Does Not—Mean
The result measures one relationship: where people are distributed relative to national capital points. It reveals how state size, settlement patterns and capital placement interact. It does not measure loyalty, identity, political influence or the quality of a resident’s connection to government.
Five limits to keep attached to the headline
- Straight-line distance is not travel distance. Mountains, seas, border controls, roads, railways and flight networks can reverse the practical answer.
- The population surface represents 2020. The calculation applies current capital rules to the latest non-projection epoch used here, so it is not a live 2026 headcount.
- A cell is not a household. Everyone estimated in a cell about 0.6 miles (1 kilometer) across is measured from the cell center, creating small local uncertainty near dividing lines.
- Boundaries are conventions. Generalized coastlines, disputed land and the treatment of territories can change which state receives a cell.
- Capitals can change. A legal move, a completed relocation or a different split-capital rule redraws the capital Voronoi regions immediately.
These limits do not erase the pattern. The official-capital and government-seat scenarios remain within 0.17 percentage points of each other, and the broader recognition test stays near 41%. The defensible takeaway is therefore not an exact last person; it is that roughly two in five people in the modeled global population live closer to another state’s capital than to their own.
Frequently Asked Questions
Which foreign capital is nearest to the largest number of people?
Hanoi leads the 195-state baseline. It is the nearest foreign reference capital for about 453.6 million people, overwhelmingly residents of China, with a smaller contribution from other home states.
Can the nearest foreign capital belong to a country that does not share a land border?
Yes. The model measures great-circle distance without requiring a shared border. Dili, Singapore, Havana and Nassau all become the nearest foreign capital for sizable populations across water.
Would moving a national capital change the number immediately?
Geometrically, yes. Moving a capital changes its distance-dividing lines even if the population grid stays fixed. A publication update should rerun every cell rather than adjust only the country that moved, because the new capital can become closest to people in neighboring states too.
Could the same research be done with travel time instead?
Yes, but it would answer a different question and require routable roads, ferries, border-crossing rules and possibly flight schedules. Results would also vary by transport mode and access assumptions, while straight-line distance supplies one globally consistent comparison.
What Did We Learn Today?
A population-weighted calculation using cells about 0.6 miles (1 kilometer) across estimates that about 3.15 billion people—40.2% of the covered 2020 population—are nearer in straight-line distance to another state’s reference capital than to their own. Capital and recognition conventions move the estimate, but the central finding remains close to two in five; the practical takeaway is to treat it as a transparent geographic model, not an exact census or a measure of political connection.
Sources & Data Notes
The principal inputs were the European Commission Joint Research Centre’s GHS-POP R2023A population grid for 2020 at approximately 0.6-mile (1-kilometer) resolution, Natural Earth version 5.1.2 populated-place coordinates, United Nations member and observer-state records, world-countries version 5.1.0, Rapid Editor Country Coder version 5.6.1, and official legal or government sources for exceptional capital cases, including Equatorial Guinea’s 2026 decree. Results are original GeographyPin model estimates rounded from fractional grid-cell populations; they may change with later population releases, revised boundaries or capital changes. This article was prepared and editorially reviewed by Z.K. Atlas, who completed the final factual checks and accepts responsibility for publication approval. AI tools may have assisted with language refinement and the creation or editing of visual materials.