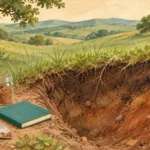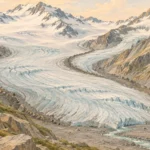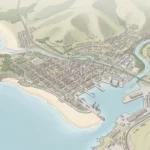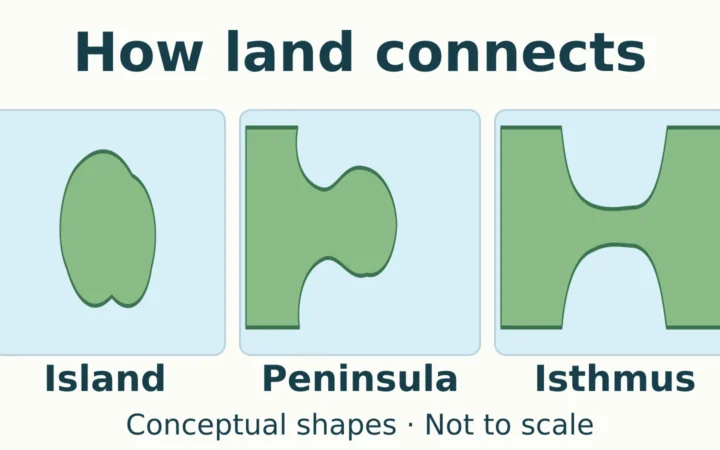
A snow-covered mountain, a forest and a river are connected parts of a landscape. Physical geography investigates those connections: how water moves, why soils and vegetation differ from place to place, and how landforms change.
Physical geography is the branch of geography that studies Earth’s physical environments, their spatial patterns, and the processes that shape and change them. It connects landforms, weather and climate, water, soils, ice and living organisms. It also examines how human activities alter these systems, rather than studying only places untouched by people.
Choose a starting point: Understand why branch lists differ, follow meltwater through a landscape, or see how to test the effects of a land-cover change.
1. Start With Connected Earth Systems
The distinguishing question is not simply “Where is the mountain?” It is “What formed it, what is changing it, and how does it affect its surroundings?” Physical geographers connect the distribution of features with the processes that produce them. This is one part of the broader subject explained in what geography studies.
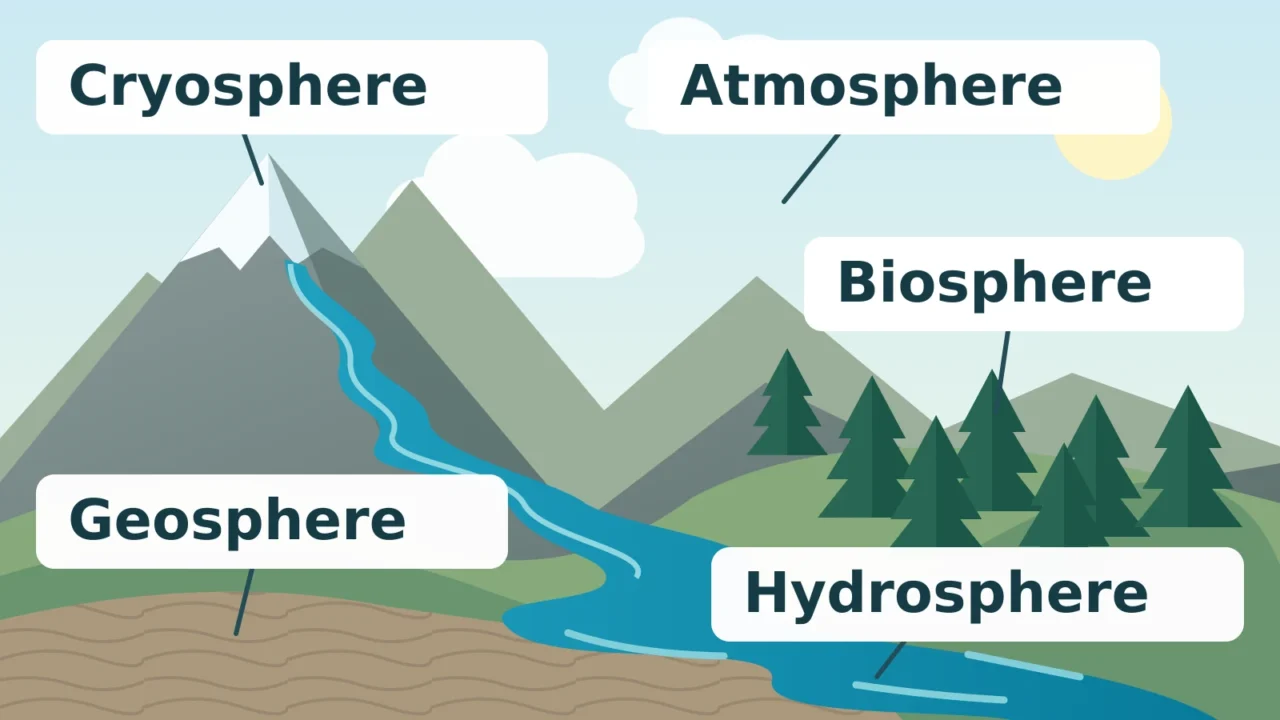
NASA’s Earth-system framework provides a useful way to organize the physical environment:
- Atmosphere: the gases surrounding Earth, including the air involved in weather.
- Hydrosphere: Earth’s water. In the five-part framework used here, liquid water is considered separately from ice and atmospheric water vapor.
- Cryosphere: snow, ice and frozen parts of the environment.
- Geosphere: the solid Earth, including rocks, sediments and landforms.
- Biosphere: living organisms and the parts of Earth where life occurs.
The featured illustration shows examples of five interacting Earth systems. It is a conceptual landscape, not a map or measured cross-section.
These names describe parts of a system, not five independent subjects. Melting snow supplies liquid water, flowing water moves sediment, and plants take up water from soil. Soil itself brings together mineral material, organic matter, organisms, air and water.
Terminology varies with the purpose of the framework. “Hydrosphere” can include water in every state, with the cryosphere treated as its frozen part.
2. Main Branches of Physical Geography
The branches are areas of investigation. Each emphasizes particular processes, but a single landscape usually requires several. This table connects commonly encountered fields with questions they can help answer.
| Field | Main focus | Example question |
|---|---|---|
| Geomorphology | Landforms and the processes that build, wear down and reshape them. | Why is a river cutting into one bank and depositing sediment elsewhere? |
| Climatology | Climate patterns, variability and change. | How does the seasonal pattern of rainfall vary across a region? |
| Hydrology | Water’s distribution, storage, movement and properties. | How much rain becomes streamflow, and how much enters the ground? |
| Biogeography | The distribution of organisms and its environmental and historical causes. | Why do plant communities differ between nearby slopes? |
| Soil geography and pedology | Soil distribution, formation and development. | How do parent material, climate, organisms, terrain and time shape a soil? |
| Glaciology | Glaciers and other natural ice, including their behavior and change. | How is a glacier’s thickness changing, and what controls its movement? |
| Coastal geography and oceanography | Coasts and marine systems, including waves, currents and sediment movement. | How do waves and sediment supply change a shoreline? |
For a closer look at one branch, compare landforms created by erosion. For the timescale distinction behind climatology, see weather versus climate: today’s atmospheric conditions and a long-term climate pattern answer different questions.
Why Different Lists Have Different Numbers
There is no single fixed branch count to memorize. Dartmouth’s reference guide describes a conventional grouping of geomorphology, climatology, hydrology and biogeography, while Simon Fraser University’s overview also discusses soils and environmental geography. More specialized lists separate glacial, coastal or other work.
These fields also extend beyond geography departments. Oceanography is an interdisciplinary science in its own right; it is not exclusively a subdivision of geography. The useful test is what a field investigates, not whether every textbook places it in the same box.
3. A Worked Example: Mountain Snow to Streamflow
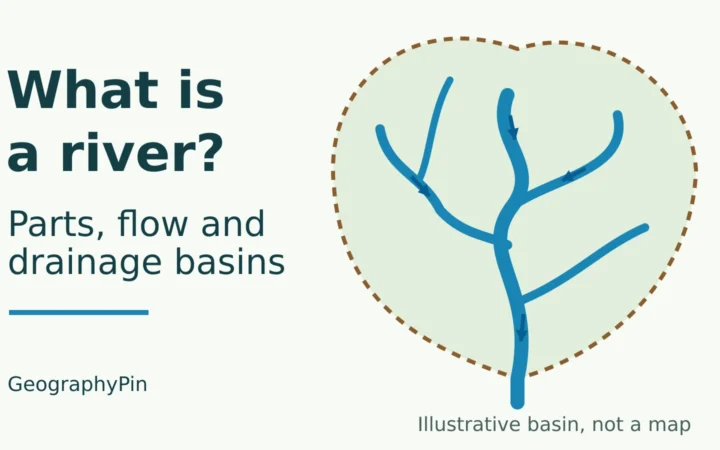
Consider an imaginary mountain catchment with seasonal snow, forested slopes, exposed rock and a stream. A catchment, also called a drainage basin, is the land draining toward a selected outlet. This is a teaching example, not a report of measurements from a real location.
Follow the Meltwater
Start with a question: Why does the stream rise during the melt season, and why does some water arrive later? The USGS explanation of snowmelt describes how mountain snow stores water and releases it as it melts. The size and timing of that contribution vary between places and years.
- Snow accumulates, then melts. Weather determines individual snowfall and melt episodes. Climatology examines the longer-term patterns behind them; snow and ice research examines the stored frozen water.
- Meltwater takes different routes. Some travels across the surface. Some infiltrates, meaning it enters the soil or underlying material. Hydrology follows those routes and the resulting changes in storage and streamflow.
- Soil and rock affect the response. Water movement depends on conditions such as soil properties, existing wetness and openings in rock. Subsurface water can reach the stream later than direct surface runoff.
- Water also moves material. Flow can erode, transport and deposit sediment. Geomorphology investigates the resulting channel and hillslope changes rather than treating the river’s shape as permanent.
- Vegetation participates. Plants take up soil water and release water vapor through transpiration. Vegetation also affects surface runoff. Biogeography asks how the organisms are distributed and how they interact with these conditions.
The branches therefore provide complementary explanations of one event. Measuring only the snowfall would leave out the ground conditions and water pathways that help determine the stream’s response.
Change One Feature, Then Test the Consequences
Now suppose a section of permeable ground is paved. The USGS identifies impervious surfaces and drainage networks as important influences on infiltration and runoff. A reasonable hypothesis is that the paved area will send more rainfall toward the stream, potentially more quickly.
That is a hypothesis to test, not a ready-made flood prediction. The result depends on the paved area, its connection to drains, rainfall, soil conditions and any storage or infiltration measures. Compare suitable observations before and after the change, account for differences in the weather, and examine a comparable unaffected area where possible.
4. How Physical Geographers Test an Explanation
A convincing explanation needs observations at a scale and frequency suited to the question. A single landscape photograph cannot reveal an annual water balance, and one storm does not establish a climate trend.
- Field measurements record conditions directly, such as stream level, rainfall, soil moisture or sediment characteristics. Where and when measurements are collected affect what they represent.
- Laboratory analysis examines samples in more detail, for example the properties of soils or sediments.
- Remote sensing observes Earth from a distance, commonly using aircraft or satellites. The USGS overview describes applications ranging from forest change to ocean temperatures.
- Geographic information systems, or GIS, organize and analyze information by location. In the catchment example, terrain, land cover, rainfall and observation sites can be examined together.
- Models represent selected processes to test explanations or estimate outcomes. Their results depend on assumptions, input data and how well they reproduce independent observations.
Before accepting a conclusion, ask what was measured, whether the observations cover the relevant area and period, and what uncertainty remains. A pattern on a map may suggest an explanation, but other evidence is needed to test the cause.
Physical geography uses these methods across timescales: a storm’s runoff, seasonal snow loss and a valley’s long-term development require different evidence. Maps, fieldwork and models are most useful when they answer a clearly defined question together.
5. Where People Fit Into Physical Geography
Physical geography does not stop at the edge of a city or farm. Pavement changes drainage; reservoirs alter water storage and release; land management affects soils and vegetation. Human actions are often part of the explanation for a physical pattern.
The emphasis differs from human geography, which examines societies and their spatial relationships, including decisions, institutions and unequal access to resources. Studying how a reservoir changes downstream flow is primarily a physical question. Studying who receives that water and how allocation decisions are made requires human-geographical evidence too.
For a fuller comparison, see human geography versus physical geography. The distinction helps choose questions and methods; it does not require separating people from the environments they inhabit.
What Did We Learn Today?
Physical geography explains how Earth’s environments work and why they vary across places and through time. Its branches are connected ways to investigate a landscape, not a universally numbered list. Following snowmelt into a stream shows how air, ice, water, land and life interact, while field measurements, remote sensing and models help test the explanation. Including human changes to those systems makes the investigation more complete.
Sources & Data Notes
This conceptual introduction uses a practical selection of branches rather than a universal taxonomy. The diagram follows a five-part Earth-system framework with ice identified separately from liquid water. The mountain catchment and paving scenario are illustrative, not measured case studies or forecasts. No numerical model results are implied.
- Simon Fraser University: What is Physical Geography? Scope and connected fields.
- Dartmouth Libraries: Defining Physical Geography Reference definitions, conventional subdivisions and methods.
- NASA: About the Earth as a System, with its linked sphere definitions. Framework for the original diagram.
- USDA Natural Resources Conservation Service: Soil Facts Soil composition, formation and investigation.
- USGS: Watersheds and Drainage Basins Catchments, water pathways and human influences.
- USGS: Snowmelt Runoff and the Water Cycle Snow storage and seasonal streamflow.
- USGS: Infiltration and the Water Cycle Ground conditions, vegetation and impervious surfaces.
- USGS: What is remote sensing and what is it used for? Observation methods and examples.
- University of Washington: What is Oceanography? Oceanography as an interdisciplinary field.
- NOAA: What is the difference between weather and climate? Short-term conditions and longer-term patterns.