A news report gives an earthquake a magnitude of 6.0, while a shaking map labels one town VI and another IV. The map is not contradicting the headline: the two measurements answer different questions. Understanding that difference helps you read earthquake reports without turning one number into a prediction for every location.
Magnitude describes the size of an earthquake at its source. Intensity describes the shaking and its effects at a particular place. One earthquake therefore produces different intensities across the affected area. A reported magnitude can be revised as analysis improves, while an intensity map shows how the experience varies from location to location.
How to use this article: You can separate source size from local effects, check the magnitude arithmetic, explain differences between places, or practice reading an intensity map.
Magnitude and Intensity Answer Different Questions
Start with the thing being described
Magnitude is a property of the earthquake source, estimated from seismic observations. Intensity describes conditions at a location. The distinction is similar to asking how large an event was versus asking what happened here.
| Measurement | Question it answers | Example notation |
|---|---|---|
| Magnitude | How large was the earthquake source? | Mw 6.0 |
| Intensity | How strong were the shaking effects here? | MMI VI at one location |
The Modified Mercalli Intensity scale, or MMI, uses effects on people, objects and structures. Its ordered levels are commonly shown with Roman numerals. They are not magnitude values, and intensity VI does not mean magnitude 6.
Other countries use other intensity scales. The British Geological Survey, for example, uses the European Macroseismic Scale. Always read the scale named in the map legend before comparing labels.
Magnitude Is Not Always the Richter Scale
The original Richter scale is a local magnitude scale, written ML. It uses the amplitude of recorded seismic waves with appropriate corrections. It remains useful for some smaller local earthquakes, so “Richter is never used” is also misleading.
Moment magnitude, Mw, is widely used for larger earthquakes. It is derived from seismic moment, which depends on rock rigidity, the area of fault that slipped and the amount of slip. It is not simply a reading of the tallest wiggle at one nearby instrument.
The USGS magnitude-types reference lists several methods with different useful ranges. A report marked Mw, ML or mb should not be casually relabeled “Richter.” Keep the agency’s magnitude type when it is available.
Reports may change after more observations or a different analysis become available. USGS explains why preliminary magnitudes are revised. A revision is an updated estimate of the same event, not evidence that the completed earthquake subsequently grew.
For the physical setting of fault movement, see the plate-tectonics guide. Here, the task is to interpret the measurements reported afterward.
The 10× and 32× Rules Describe Different Comparisons
Subtract the magnitudes before calculating a ratio
On an amplitude-based magnitude scale, a one-unit increase corresponds to ten times the relevant, comparably corrected wave amplitude. That does not mean every person experiences ten times the shaking, or that every seismic wave at every site is ten times larger.
A common approximate energy comparison uses 10 raised to the power of 1.5 times the magnitude difference. The USGS worked explanation derives this relationship. It gives about 32 times as much radiated energy for a one-unit step.
| Magnitude difference | Comparable amplitude ratio: 10^ΔM | Approximate energy ratio: 10^(1.5ΔM) |
|---|---|---|
| 0.2 | 1.58 | 2.00 |
| 1.0 | 10 | 31.62 |
| 2.0 | 100 | 1,000 |
For an illustrative change from 5.0 to 6.0, the difference is 1.0, not a ratio of 6 divided by 5. The energy estimate is therefore about 31.6 times, not 1.2 times. These are teaching comparisons, not measured energy values for two named events.
Moment magnitude and radiated energy are related but distinct. Real earthquakes do not all convert fault movement into seismic radiation identically. Treat the energy rule as an approximation, and never turn either column into a multiplier for building damage.
Local Shaking Depends on More Than Magnitude
Distance, depth, geology and rupture all matter
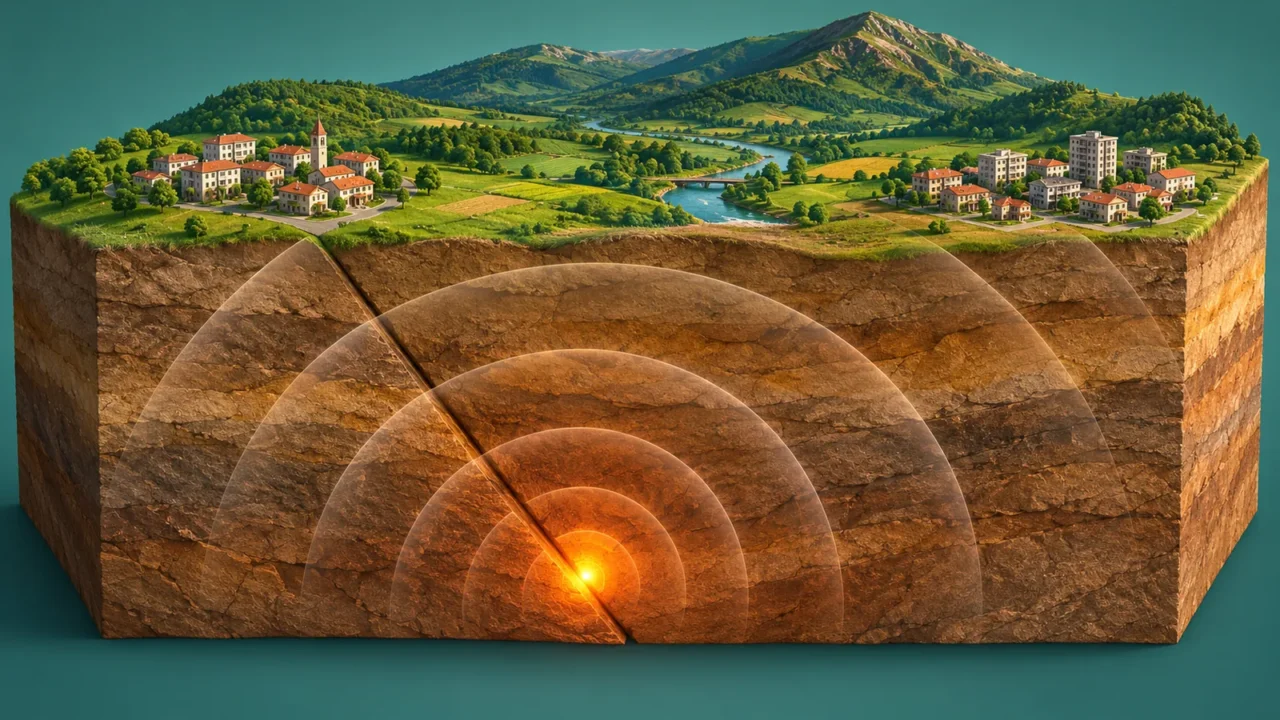
Shaking generally weakens farther from the rupture, but a real intensity pattern need not form neat circles. The depth and direction of rupture, the paths traveled by seismic waves and local ground conditions can change the result.
USGS illustrates the influence of local geology with recordings from the 1989 Loma Prieta earthquake. Stations at similar distances recorded different shaking because the materials beneath them differed.

The condition and construction of a building also affect damage. Two buildings within one mapped intensity area need not suffer the same outcome. Intensity describes local shaking effects; it is not a complete inventory of losses or a building-safety inspection.
Read an Intensity Map in Four Steps
Use the map’s evidence and legend, not just its colors
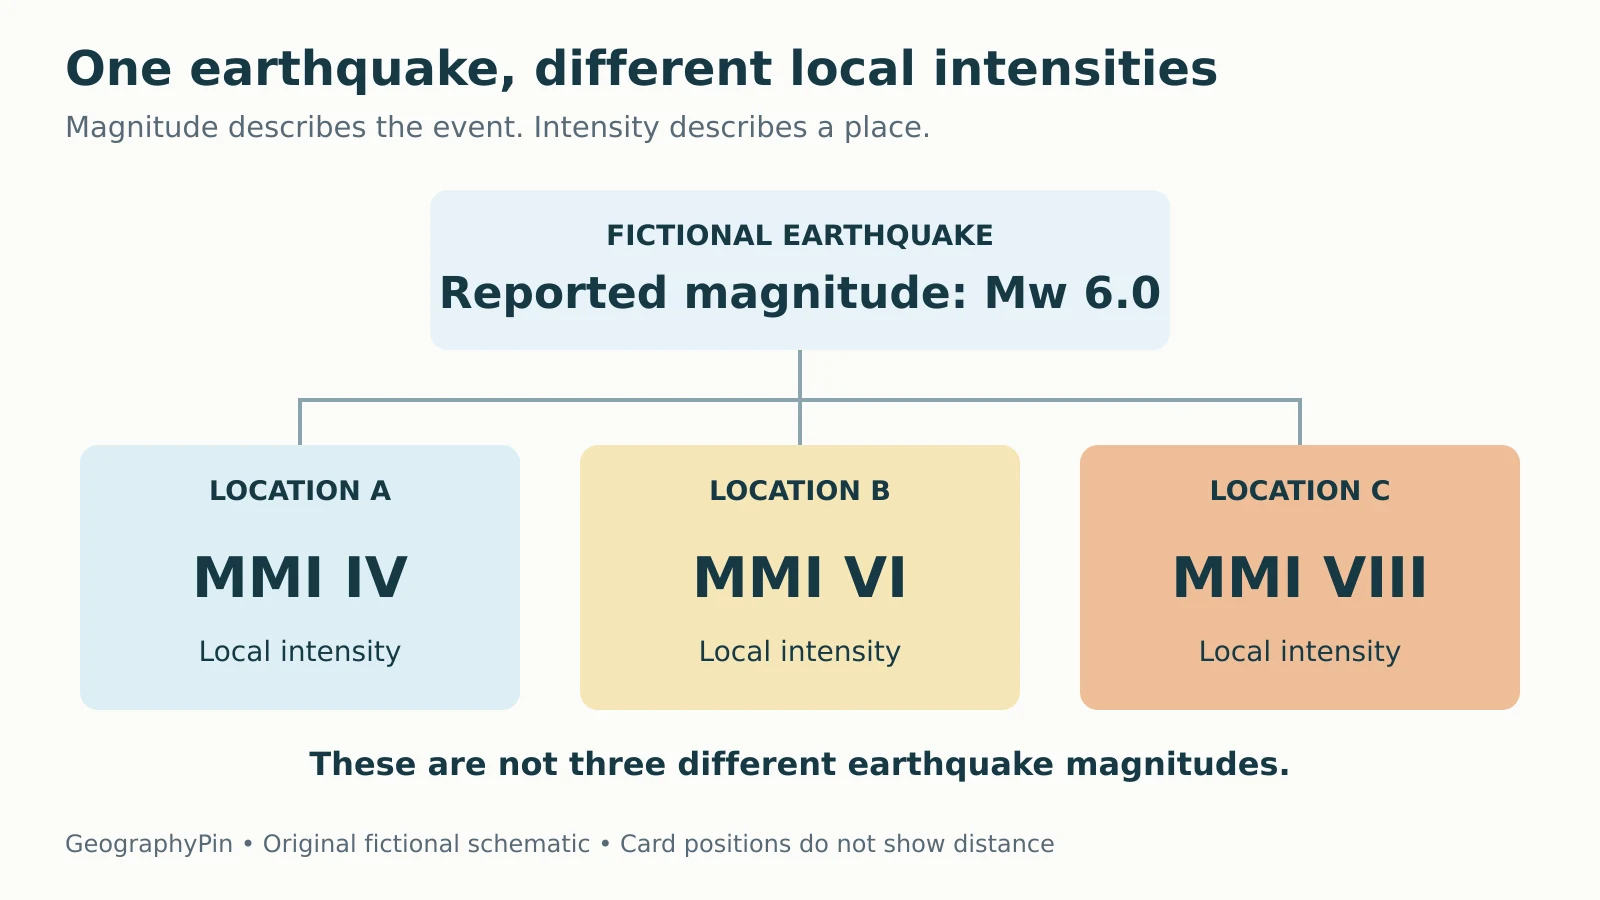
Suppose a fictional map for a Mw 6.0 event shows MMI IV at Location A, VI at B and VIII at C. C has the highest mapped intensity among these locations. All three still belong to the same earthquake.
- Identify the product. Is it an intensity map, a ground-acceleration map or a forecast of future hazard? These are different products.
- Read the legend. Confirm the intensity scale and color categories. A decimal value on an estimated intensity map is not automatically a magnitude.
- Check the evidence. Are values based on felt reports, instruments, modeled estimates or a combination? Look for data coverage and uncertainty.
- Check the event and version. Verify which earthquake the map describes and when the product was updated.
The USGS Did You Feel It? system combines people’s reports into community intensity estimates. ShakeMap uses recorded ground motion and modeling, and can also incorporate felt-report information. These products are related, but their inputs and procedures are not identical.
An area without reports is not necessarily an area where nobody felt shaking. Likewise, a community value does not describe every individual building. The map-reading guide provides the broader habit: establish what the symbols and data actually represent before drawing a conclusion.
Keep the Number Within Its Limits
Do not convert MMI VIII into a magnitude of 8, assume a two-unit magnitude difference means twice the damage, or read an intensity color as a precise property-level assessment. Each mistake treats one type of information as another.
USGS cautions that shaking maps are approximate and that ground motion can vary over short distances. Enlarging a map does not create new local measurements. Updated evidence can also change an early map.
A useful summary preserves both scales: “The event was reported as Mw 6.0, with different local intensities across the affected area.” Add the relevant location and map version when describing a particular place. For immediate decisions after an earthquake, use current official guidance rather than treating an educational comparison as an assessment of safety.
What Did We Learn Today?
Magnitude describes an earthquake source, while intensity describes local shaking effects. Keep the reported magnitude type, use logarithmic comparisons with their assumptions, and treat approximate energy ratios separately from damage. On an intensity map, check the scale, evidence, location and update time before interpreting the colors.
Sources & Data Notes
The original diagram and three-location example are fictional, not a ShakeMap or a hazard forecast. Table ratios are calculated from 10^ΔM and the conventional approximate energy relation 10^(1.5ΔM), rounded as shown. No actual earthquake energy or building damage is calculated.
- USGS: The Modified Mercalli Intensity Scale
- British Geological Survey: How are earthquakes detected, located and measured?
- USGS: Magnitude Types
- USGS Hawaiian Volcano Observatory: Why magnitudes sometimes change
- USGS: Comparing earthquake magnitude and energy
- USGS: Earthquake Magnitude, Energy Release, and Shaking Intensity
- USGS: Did You Feel It? Scientific Background
- USGS: ShakeMap Disclaimer