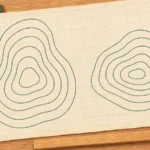
A map becomes easier to read when you separate four questions: what is here, which way is it, how far away is it, and what is the ground like? A road map may answer the first three; a topographic map adds contour lines to show the shape of the land.
To read a map, check its purpose and legend, identify its north reference, use its scale to measure distance, and read contour lines for elevation and slope. Check the units before calculating. On a resized image, use a scale bar that has resized with the map rather than trusting the original printed ratio.
Choose a starting point: Understand the three kinds of north, avoid resized-map mistakes, practice counting contour intervals, or check the worked answers.
1. Start With the Map’s Purpose and Legend
Read the title, publisher, date or edition, and map notes before interpreting the detail. A subway diagram may preserve station order while changing distances. A population map’s colors describe data categories, not necessarily vegetation or elevation. A topographic map represents terrain as well as selected natural and human-made features.
The legend, also called the key, explains the symbols. Read the complete symbol, including its color, shape, line pattern and label:
- Points can represent individual locations, such as a well or a building.
- Lines can represent roads, streams, boundaries or contours. A dashed line and a solid line may mean different things.
- Areas can represent woodland, water or a mapped category.
USGS topographic maps commonly use brown for contours and blue for water features. These are conventions, not a universal color code. Consult the legend of the particular map rather than transferring a symbol’s meaning from another publisher. A prominent symbol may also be enlarged for readability rather than showing the feature’s true width.
Use this fictional practice map throughout the explanation. It represents a simple valley, not a real location or a route to follow. Its scale is defined in meters and kilometers; keep those units while doing the exercises.
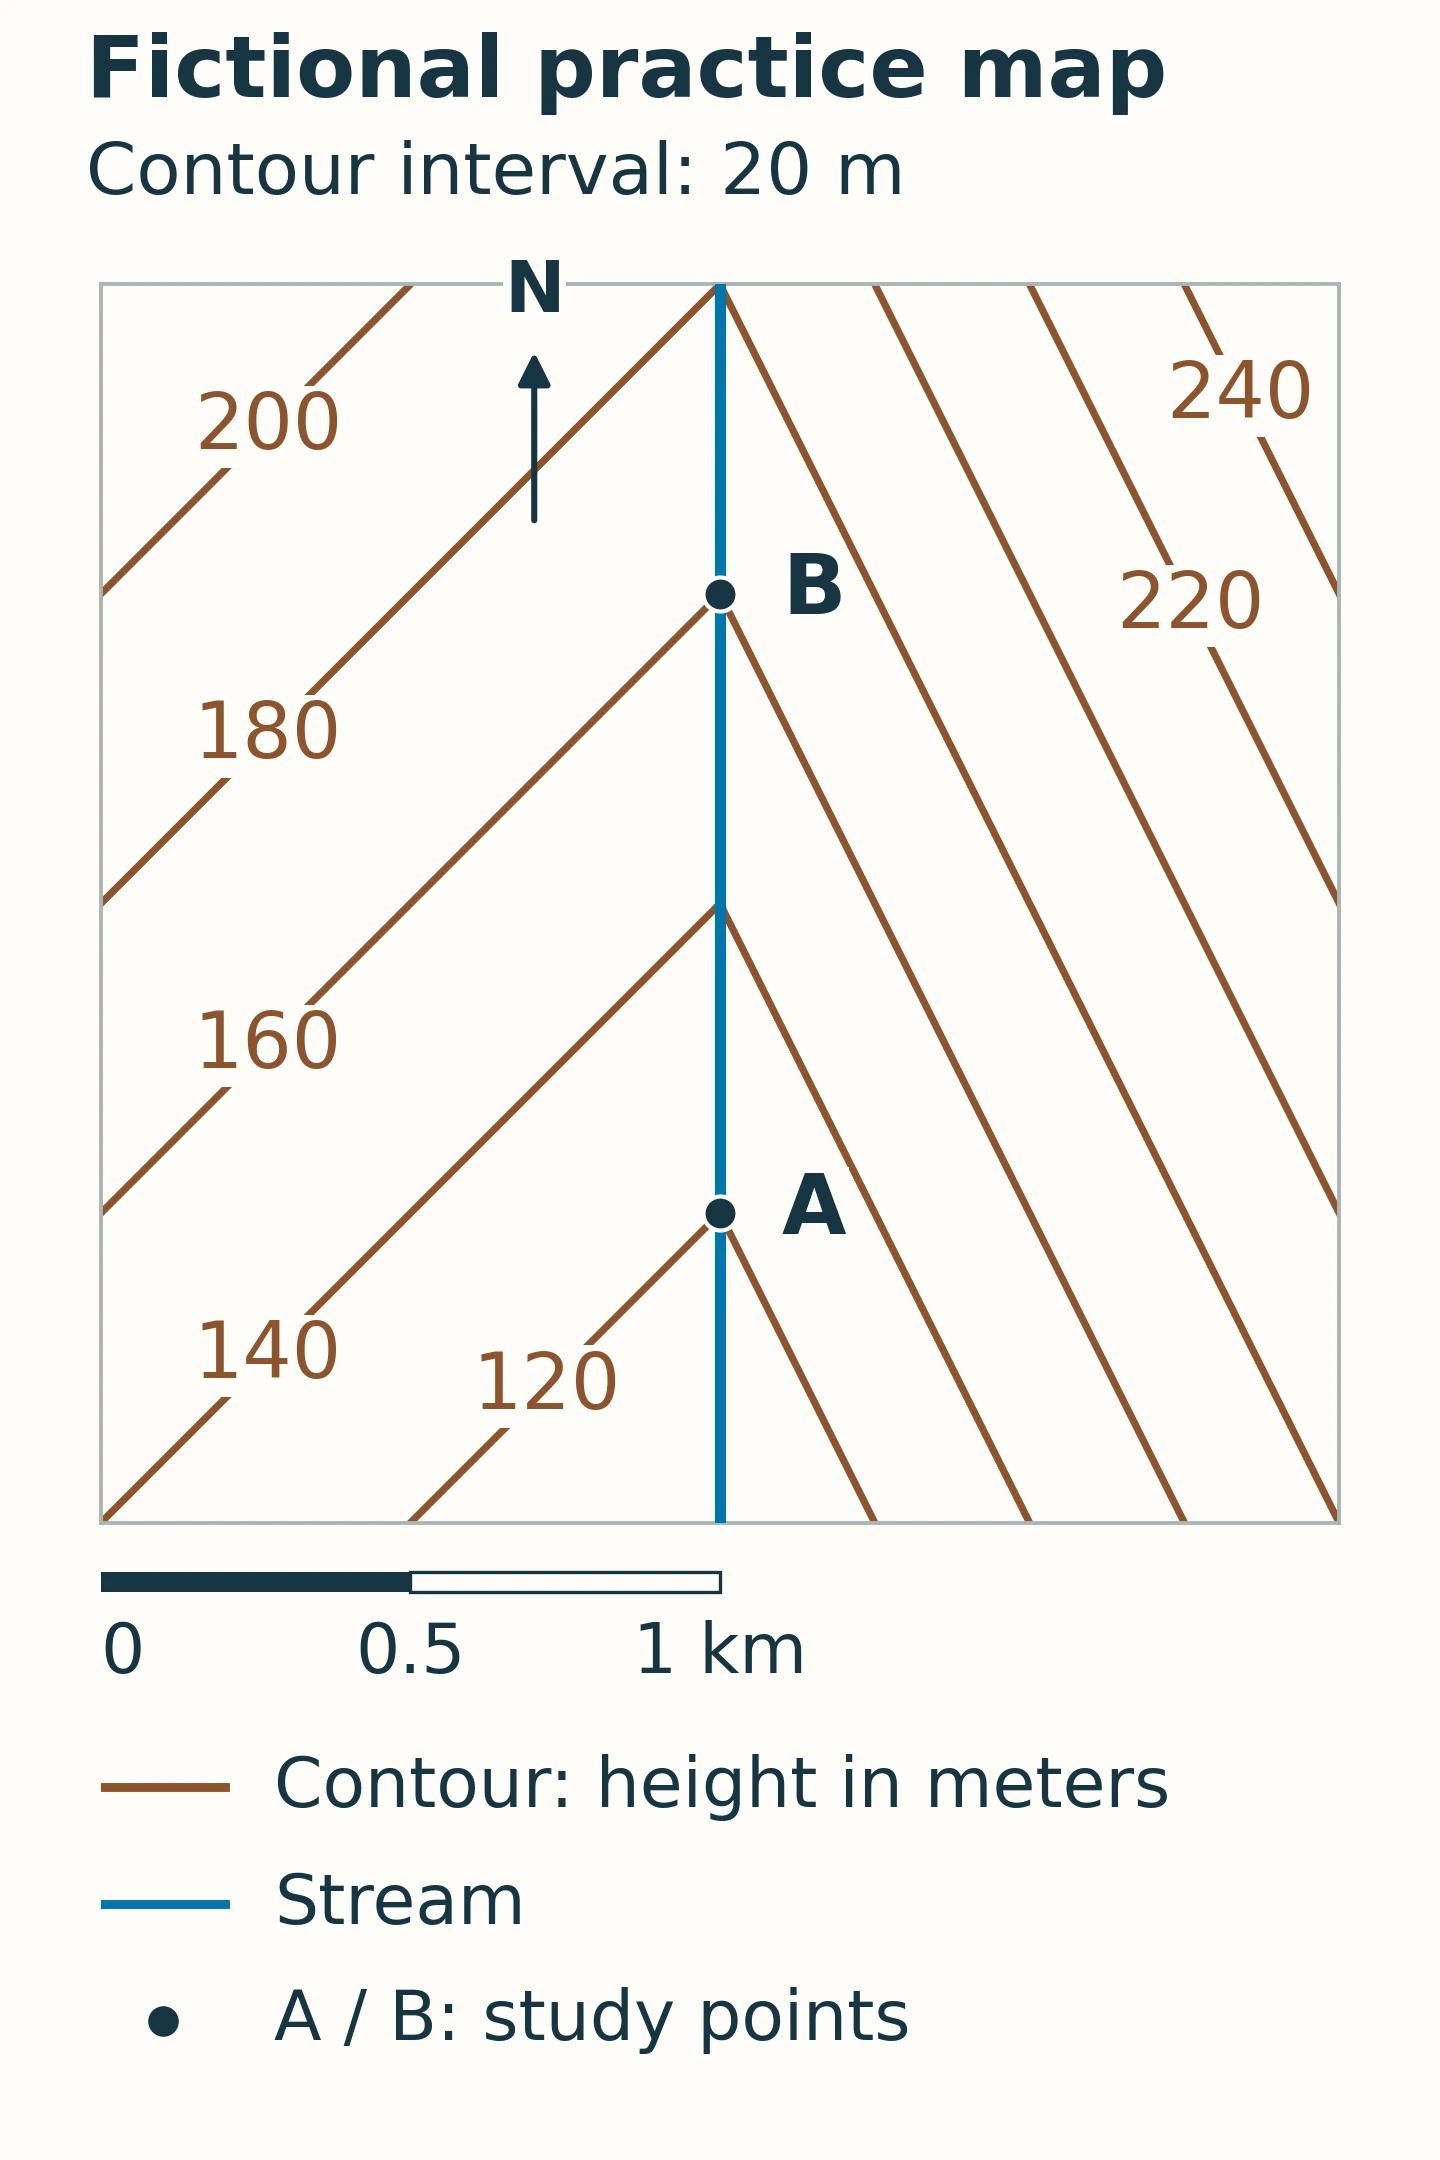
Text version: North is up. A and B lie on the same straight stream, with B directly north of A. A is on the 120-meter contour and B is on the 160-meter contour; the 140-meter contour crosses the stream between them. A–B matches the full 1-kilometer scale bar. Contours are more closely spaced on the eastern side.
2. Check Direction and North
Find the north arrow, coordinate grid or orientation note. Do not assume the top of every map is north: maps can be deliberately rotated, and a phone map can rotate as you move. When north is up, east is right, south is down and west is left.
To orient a map to the landscape, identify recognizable features and turn the map until their arrangement agrees with what you see. Use more than one feature so that a similar-looking road junction or bend does not become your only reference.
True north, grid north and magnetic north
- True north is the local direction toward the geographic North Pole.
- Grid north follows the northward direction of a map’s coordinate grid. It need not coincide with true north.
- Magnetic north is the direction indicated by the north-seeking end of a properly functioning compass, away from local interference.
NOAA defines magnetic declination as the angle between magnetic north and true north. It varies with location and time. The angle between magnetic north and grid north is a different correction. Use current local information and the map’s stated reference when transferring a bearing; there is no universally correct “always add” rule.
Need to identify a precise position rather than a direction? The separate guide to reading latitude and longitude explains coordinate pairs and formats.
3. Measure Distance With the Scale
Scale relates a map distance to the corresponding ground distance. On a conventional local topographic map, the distance measured is horizontal, as viewed from above. It does not include every rise and dip of the terrain.
Read a ratio using the same units
A scale of 1:24,000 means 1 unit on the map represents 24,000 of the same unit on the ground. Therefore, 1 inch represents 24,000 inches, or 2,000 feet. A 3-inch measurement represents 6,000 feet, about 1.14 miles (1.83 kilometers), provided the map is reproduced at its intended size.
The metric calculation works the same way. At 1:25,000, 1 centimeter represents 250 meters. A 4-centimeter measurement represents 1 kilometer. Multiply by the scale denominator first, then convert units.
A 1:25,000 map is larger scale than a 1:250,000 map because 1/25,000 is the larger fraction. For the same sheet size, it covers less ground and can show finer detail. “Large scale” does not mean “large geographic area.”
Use the scale bar on a resized map
A printed ratio describes a particular physical reproduction size. Enlarging a map to twice its original width changes a 1:25,000 reproduction to 1:12,500; the original printed number no longer describes the enlarged sheet. Screen sizes, screenshots and “fit to page” printing can cause the same problem.
A graphical scale bar stays proportional when the map and bar are enlarged or reduced together by the same amount. Compare your measured span directly with that bar. This works only if the image has not been stretched unevenly and the bar belongs to that map or panel. On an interactive map, use the scale displayed at the current zoom level.
For a curved route, follow its bends with a strip of paper, string, or a suitable digital measuring tool, then total the distance. Measuring directly between the endpoints gives a straight-line distance instead. Neither measurement alone establishes walking time.
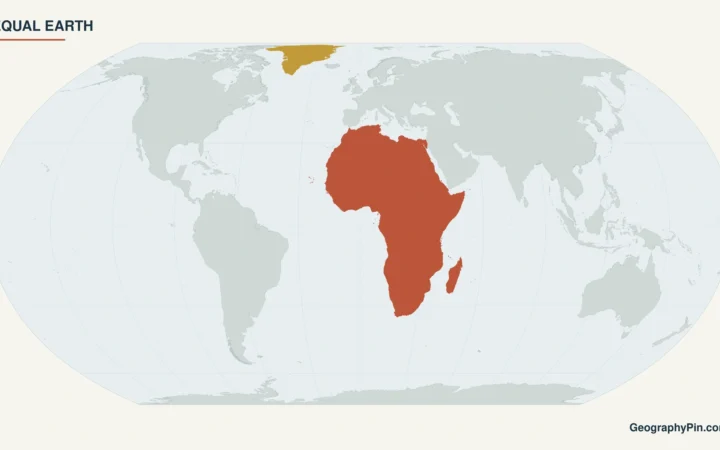
On a world map, projection distortion adds another limitation: one simple scale cannot describe all distances everywhere. Our explanation of map projections and distortion covers that separate problem.
4. Read Contour Lines and Slope
A contour line joins points of equal elevation relative to a stated vertical reference, or datum. The number on the line is an elevation, not a distance along a trail. The contour interval is the vertical difference between successive regular contours.
Check the map notes for both the interval and the units. Do not assume all topographic maps use feet, all metric maps use a 10-meter interval, or every visible line represents a full interval. Some maps include supplementary contours between the regular ones. Heavier index contours provide labeled reference lines; their frequency depends on the map series.
Count the gaps, not just the lines
On the practice map, the sequence 120, 140, 160 meters contains two intervals of 20 meters. Going from the first contour to the last gains 40 meters, not 60. Follow a contour to its label if the number is printed away from the point you are examining.
Between adjacent contours on an ordinary uninterrupted slope, you can bracket a point’s elevation, but you cannot usually assign an exact height from the contours alone. A point between 140 and 160 meters is not automatically at 150 meters: the ground need not slope evenly.
Read spacing and shape together
- Close spacing: the same elevation change occurs over a shorter horizontal distance, indicating a steeper slope. Compare spacing at the same map scale and contour interval, across the contours rather than along them.
- Wide spacing: the slope is gentler. Sparse contours do not guarantee perfectly flat or obstacle-free ground.
- Nested closed contours: check the labels. Increasing elevations toward the center indicate higher ground. A closed loop is not automatically a hill; depression contours commonly have short inward-facing ticks, called hachures, pointing toward lower ground.
- A V where contours cross a stream valley: the tip generally points upstream, toward higher ground. Check the labeled elevations and the stream itself, not a V shape in isolation.
The Connecticut environmental mapping guide describes this upstream-pointing pattern for streams crossing valleys with noticeable relief. In the practice map, the V tips point north while the stream descends south. A ridge can produce a different contour bend, which is why elevation labels matter.
Distinct elevations on an ordinary single-valued land surface do not cross. Vertical cliffs can make contours merge at map resolution; overhangs are a special case that a simple overhead contour model cannot represent cleanly. Consult the map’s cliff or rock symbols rather than treating a dense patch of lines as a complete picture of the terrain.
5. Solve the Practice Map
Return to the fictional map and answer four questions before reading the solution:
- What direction is B from A?
- What is the horizontal distance from A to B?
- How much higher is B, and which way does the stream flow?
- Which valley side is steeper, east or west?
Worked answers
- B is north of A. The north arrow points up, and the points share the same north–south line.
- The horizontal distance is about 0.62 mile (1 kilometer). The A–B span equals the full 0–1 kilometer bar. Compare the two lengths, not a ruler reading against an assumed screen scale.
- B is about 131 feet (40 meters) higher. Subtract A’s 120 meters from B’s 160 meters. The stream flows from B toward A, southward, because its elevation decreases in that direction.
- The eastern side is steeper. Its contours are more closely spaced on the same map with the same 20-meter interval.
An optional calculation makes the slope along A–B explicit: 40 meters ÷ 1,000 meters × 100 = 4%. This is rise divided by horizontal run, not an angle of 4 degrees. Here the fictional stream gradient is constant; on a real route, an average can conceal short steep sections and repeated climbs.
6. Know What the Map Cannot Tell You
Reading the symbols correctly does not make a map complete or current. A stream symbol does not guarantee drinkable water or a safe crossing. A path symbol does not establish public access, present condition or freedom from closures. Check the relevant land manager’s current information before an outdoor trip.
Contours simplify terrain at a chosen scale and interval. They can omit small gullies, banks and other changes that matter on the ground. Do not use this exercise or a general-purpose map as an engineering survey, flood assessment, or guarantee of route safety.
Before relying on a map, check five things together: purpose, legend, orientation, scale and elevation units. Then ask whether its detail, date and coverage match the task. Zooming in or printing it larger cannot create information that was absent from the underlying map.
What Did We Learn Today?
A useful map reading combines several clues: the legend identifies features, the north reference establishes direction, the scale turns a drawn span into distance, and contours show elevation and slope. The practice valley demonstrates how those clues agree: B lies north and uphill from A, the stream flows the other way, and tighter contours mark the steeper eastern side. Checking units and reproduction size prevents simple-looking measurements from becoming wrong answers.
Sources & Data Notes
The practice map is an original, fictional teaching diagram, not a surveyed location. Its 2-by-2-kilometer horizontal frame and 20-meter contours come from a defined piecewise-planar surface: along the central stream, elevation rises 40 meters per kilometer northward; at the same northing, ground rises 40 meters per kilometer westward and 80 meters per kilometer eastward away from the stream. Heights use an arbitrary instructional datum. These assumptions make A–B exactly 1 kilometer horizontally with a 40-meter rise. Imperial equivalents are rounded. Metric units are retained on the diagram so its scale and contour arithmetic remain consistent. Real maps use their own symbols, datums, intervals and accuracy limits.
- USGS: US Topo Cartographic Specifications, Map Symbol Guide — symbols, scale, contours and contour intervals.
- Ordnance Survey: Map Reading Made Easy — legends, measuring distance, scale and terrain reading.
- Ordnance Survey: Compasses and Directions — cardinal directions and the three north references.
- NOAA/NCEI: Magnetic Declination — true versus magnetic north and changes with time and location.
- CT ECO: Connecticut Drainage Basins and Elevation Contours — stream-valley contour patterns and limits of terrain interpretation.