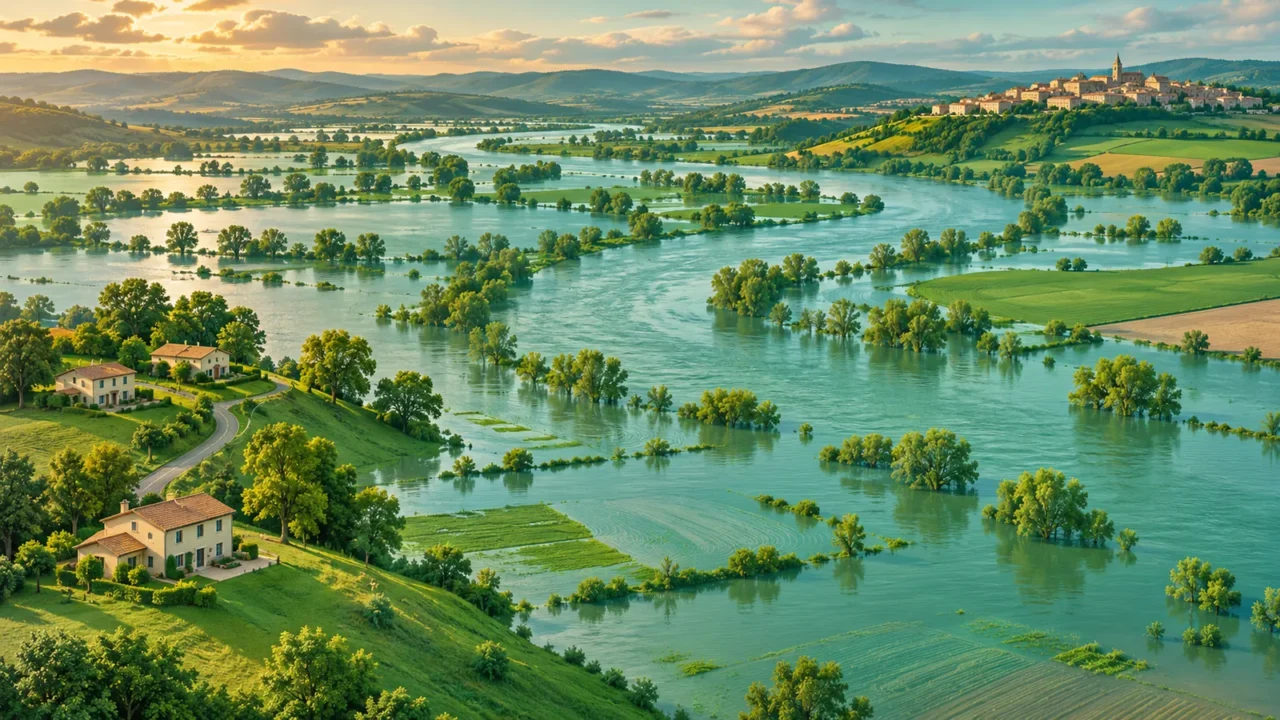
A river exceeds its “100-year flood” level, then does so again a few years later. That does not automatically mean the statistics are contradictory. The phrase describes an estimated probability, and its calendar-like wording can hide what the number means.
A 100-year flood is a flood threshold with an estimated 1% annual chance of being equaled or exceeded at a specified location under the analysis assumptions. It is not a timetable. Exceedances can occur in nearby years, and the chance of at least one exceedance grows when you consider a longer period.
How to use this article: You can decode the annual probability, understand consecutive years, calculate a longer-term chance, or separate rainfall from river flooding.
Start With Annual Exceedance Probability
A threshold, a location and a probability
Annual exceedance probability, or AEP, describes the chance that a specified magnitude will be equaled or exceeded during a year. For river flood-frequency analysis, the variable is commonly annual peak discharge at a particular measurement site. Discharge is the volume of water passing a location per unit of time.
The U.S. Geological Survey encourages AEP wording because “100-year flood” can sound like a date on a calendar. A 1% AEP means one chance in 100 for a year, not one safe century after an event.
| Return period | Annual probability | Percentage |
|---|---|---|
| 10 years | 1 ÷ 10 | 10% |
| 25 years | 1 ÷ 25 | 4% |
| 50 years | 1 ÷ 50 | 2% |
| 100 years | 1 ÷ 100 | 1% |
| 500 years | 1 ÷ 500 | 0.2% |
For this annual-maximum convention, return period in years is 1 divided by the annual probability written as a decimal. Thus 1 ÷ 0.01 = 100. The table concerns the chance of at least one exceedance in a year; it does not count every separate flood event within that year.
Two Nearby Exceedances Do Not Break the Rule
Separate the next year from a pair of years
Suppose the annual probability remains 1%, and exceedance in one year is independent of exceedance in another. Under that model, an exceedance this year does not change next year’s 1% chance. There is no 99-year protection period.
The chance of exceedance in both of two specified years, calculated before either year occurs, is different: 0.01 × 0.01 = 0.0001, or 0.01%. Once the first year’s exceedance is known, the question about the next independent year again has a 1% answer.
This distinction matters when reading headlines. A rare pair of outcomes is possible; a rare first outcome does not make the second impossible. The Global Facility for Disaster Reduction and Recovery likewise explains that return-period events can recur close together or fail to occur within the named interval.
Independence and an unchanged probability are assumptions, not universal facts about rivers. A real analysis must consider the watershed, climate, available observations and statistical model.
Calculate the Chance Across Several Years
Find the chance of no exceedance first
For a fixed annual probability p and n independent years, the chance of no exceedance in one year is 1 − p. Multiply that probability across the n years, then subtract the result from 1:
Chance of at least one exceedance = 1 − (1 − p)n.
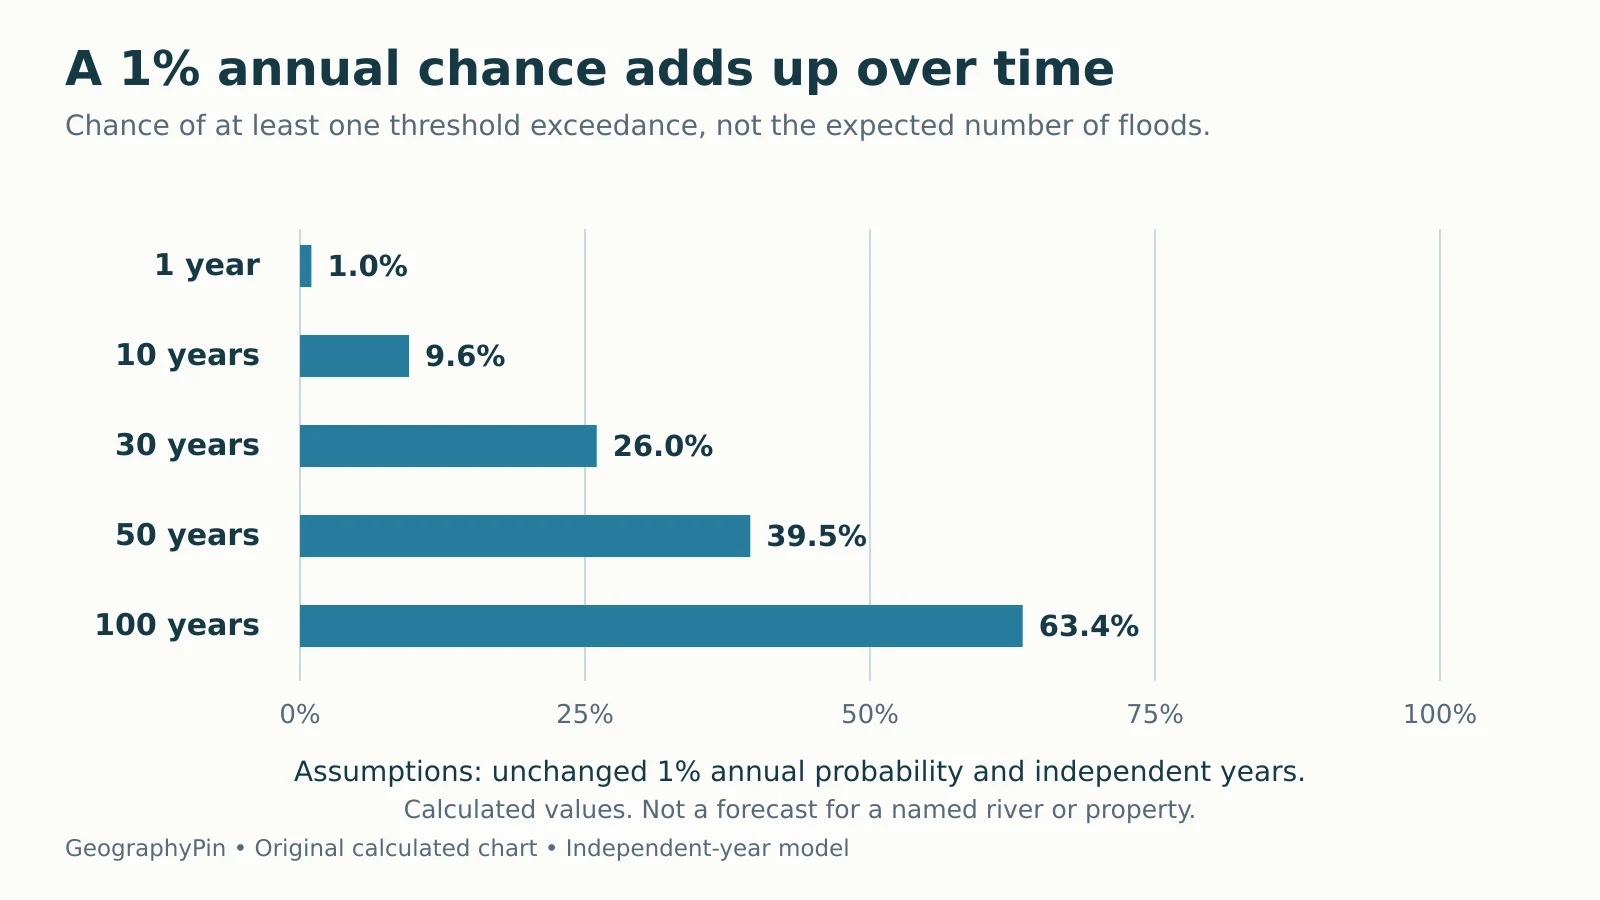
For p = 0.01 and n = 30, the calculation is 1 − 0.9930 = about 0.2603, or 26.0%. USGS gives the same approximately 26% illustration. It is not 30%: simply adding the annual chances would count some multi-year outcomes more than once.

| Period | Chance of at least one exceedance |
|---|---|
| 1 year | 1.0% |
| 10 years | 9.6% |
| 30 years | 26.0% |
| 50 years | 39.5% |
| 100 years | 63.4% |
Download the calculation data as CSV. Even across 100 years, an exceedance is not guaranteed: the same model gives about a 36.6% chance of none. “At least one” includes outcomes with more than one exceedance year.
A 100-Year Rainstorm Is Not Automatically a 100-Year Flood
Match the variable and duration
Rainfall and river discharge measure different things. A rare rainfall amount is defined for a location and duration, and sometimes a specified area. A rare river peak concerns flow at a particular site.
NOAA’s precipitation-frequency FAQ stresses duration, location and area when describing rainfall rarity. A one-hour rainfall total and a 24-hour total are not interchangeable just because both carry the same return-period label.
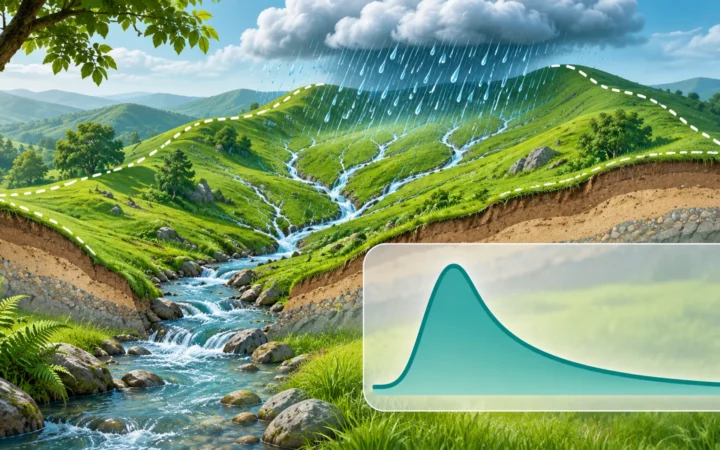
The USGS flood guide explains that rainfall coverage, earlier soil moisture and the relation between storm duration and basin size affect the resulting streamflow. A storm concentrated over one part of a basin may produce a different response from widespread rainfall.
The river guide explains drainage basins and connected river systems. That geographic context helps explain why a rainfall statistic cannot simply be copied onto a downstream flood.
The Estimated Threshold Can Change
A flood-frequency estimate comes from observations and a statistical analysis. It has uncertainty. More data, better measurements or a different justified model can change the estimated discharge associated with 1% AEP.
The underlying conditions can change too. Land development, reservoirs and changing climate can affect river-flow patterns. A fixed historical threshold need not keep exactly the same annual probability indefinitely.
ClimateData.ca distinguishes return period from return level: the first describes frequency, while the second describes the magnitude associated with that frequency. Under changing conditions, a given magnitude can become more or less frequent, or the magnitude associated with a given probability can change.
Those are related but different comparisons. Ask whether a report is holding the physical threshold constant or holding the probability constant before interpreting its trend.
Read Flood Claims and Maps With Care
- Identify the location. A return period at one river site is not automatically the return period everywhere in a region.
- Identify the measurement. Separate rainfall depth, peak discharge, water level and building damage.
- Identify the period and assumptions. Check the study date, data used and whether probabilities are treated as constant.
- Read uncertainty. An estimated threshold is not an exact permanent boundary.
- Check local information. Use current official flood maps and warnings for practical decisions.
A 1% threshold calculation is not an exact damage probability for every home inside a shaded map area. Building elevation, local flooding sources and other conditions matter. The National Flood Insurance Program also emphasizes that lower-risk mapped areas still have flood risk.
For a knowledge check after this explanation, the hydrology quiz includes a return-period question. Keep the central distinction: probability describes what may happen, not when the next event is due.
What Did We Learn Today?
A 100-year flood threshold has an estimated 1% annual exceedance probability under its analysis assumptions. Nearby exceedances are possible, and multi-year probability is calculated differently from a single year’s chance. Rainfall rarity does not automatically determine river-flood rarity. Check the location, measurement, study assumptions and uncertainty before using the number.
Sources & Data Notes
The chart and CSV are original calculations using a fixed 1% annual probability and independent years. They are not observations or parcel-level risk estimates. River examples use the annual-maximum convention; precipitation analyses can use different event-series conventions. Rounded percentages are shown for readability. Local forecasts, regulatory maps and professional assessments serve different practical purposes.
- USGS Water Science School: Floods and Recurrence Intervals
- USGS Water Science School: The 100-Year Flood
- GFDRR: A 100-Year Flood does not only happen once every 100 years
- NOAA National Weather Service: Precipitation-frequency FAQs
- ClimateData.ca: Understanding climate extremes, Return Periods and Return Levels
- National Flood Insurance Program: What is My Flood Risk?