A map of Caucasus glacial lakes can mean two different things: lakes touching today’s ice, or lakes occupying terrain shaped by earlier glaciers. The 2025 research inventory separates those categories. Its publicly downloadable extraglacial table is especially useful for locating lakes, but it needs to be read on its own terms.
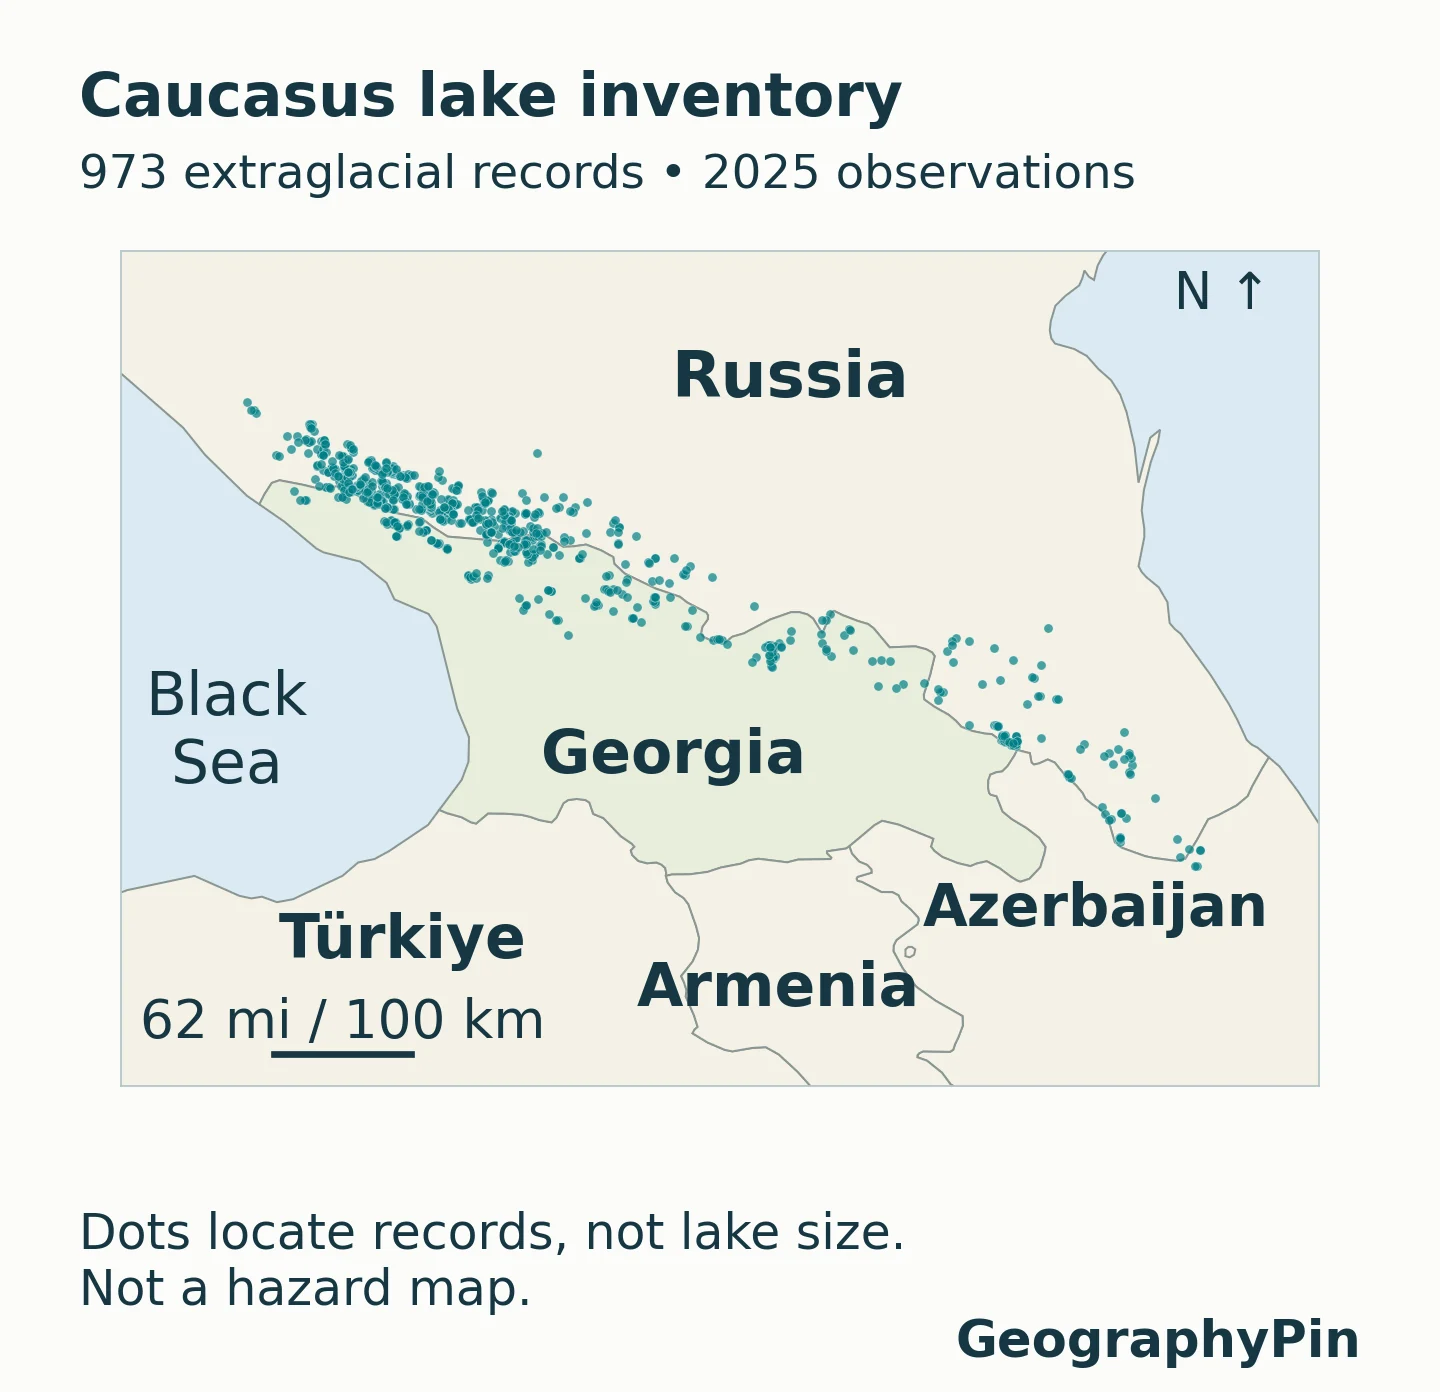
This Caucasus glacial lakes map plots 973 extraglacial records from the 2025 inventory: lakes classified as glacial in origin but situated in glacier-free valleys. The dataset was published in November 2026. It is not a map of every Caucasus lake, present glacier contact, or current outburst danger.
How to use this article: Start with the map key, compare the Georgia records, or check which fields are missing before using the data.
1. The regional map and its limits
The mapped points come from Kidyaeva and colleagues’ PANGAEA dataset, released on November 6, 2026. The year 2025 identifies the observation season, not the publication year. Its 973 rows are the extraglacial component of a larger Greater Caucasus study.
Read the dots as locations, not lake outlines
A point remains visible even when the lake itself would be too small to draw at this scale. It does not show the size of the water body on the ground. Empty spaces mean that no record from this particular table is plotted there; they do not prove that a valley has no lakes.
The inventory’s country field contains Russia, Georgia and Azerbaijan. Armenia has no rows in this export, which is not the same as having no mountain lakes. The study concerns the Greater Caucasus rather than an exhaustive census of all water bodies across the wider Caucasus region.
The associated paper reports 1,384 lakes in total: these 973 extraglacial records and another 411 lakes classed as supraglacial, proglacial or periglacial. The latter group was assessed for outburst hazard. It is not silently added to this map, and the 973 mapped records must not be relabeled as that hazard-assessed group.
2. Georgia close-up: records, not a travel checklist
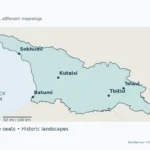
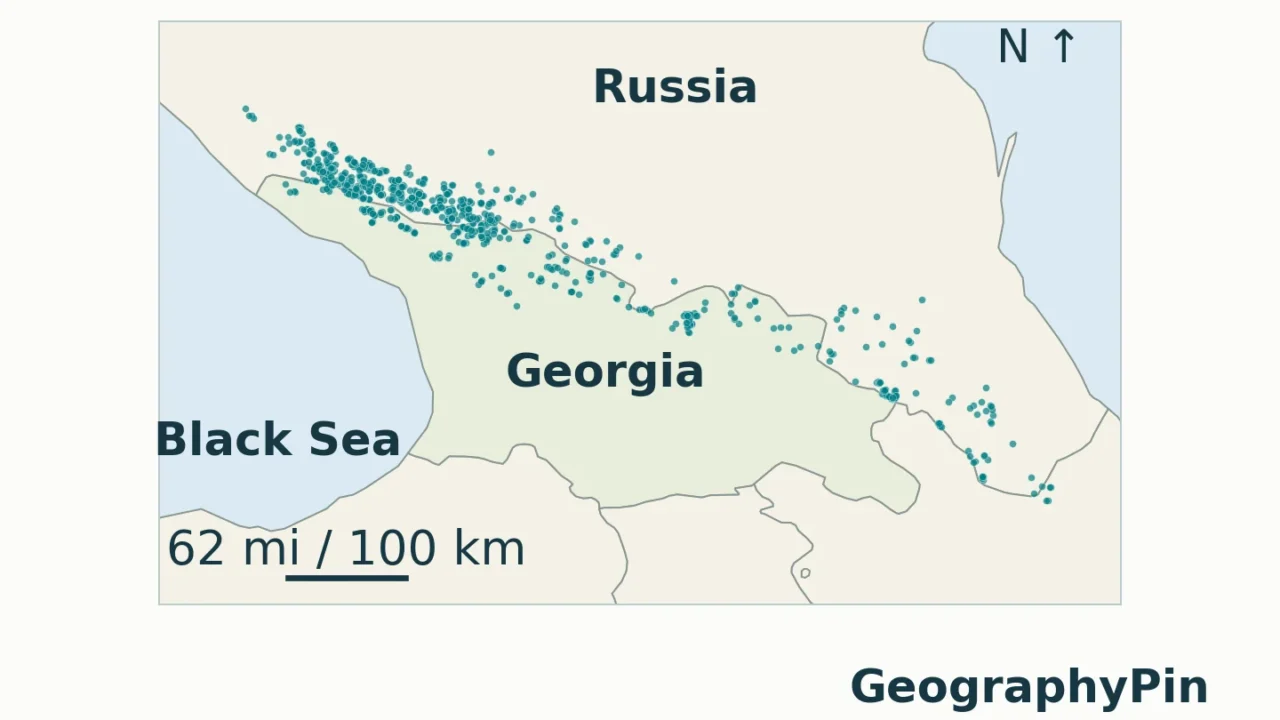
What the 277 Georgia records represent
Filtering the source’s country field for Georgia returns 277 records. Of these, 84 have a populated lake-name field and 193 do not. Keeping the research identifier is therefore essential: an unnamed record is still part of the inventory and still contributes to its count and area.
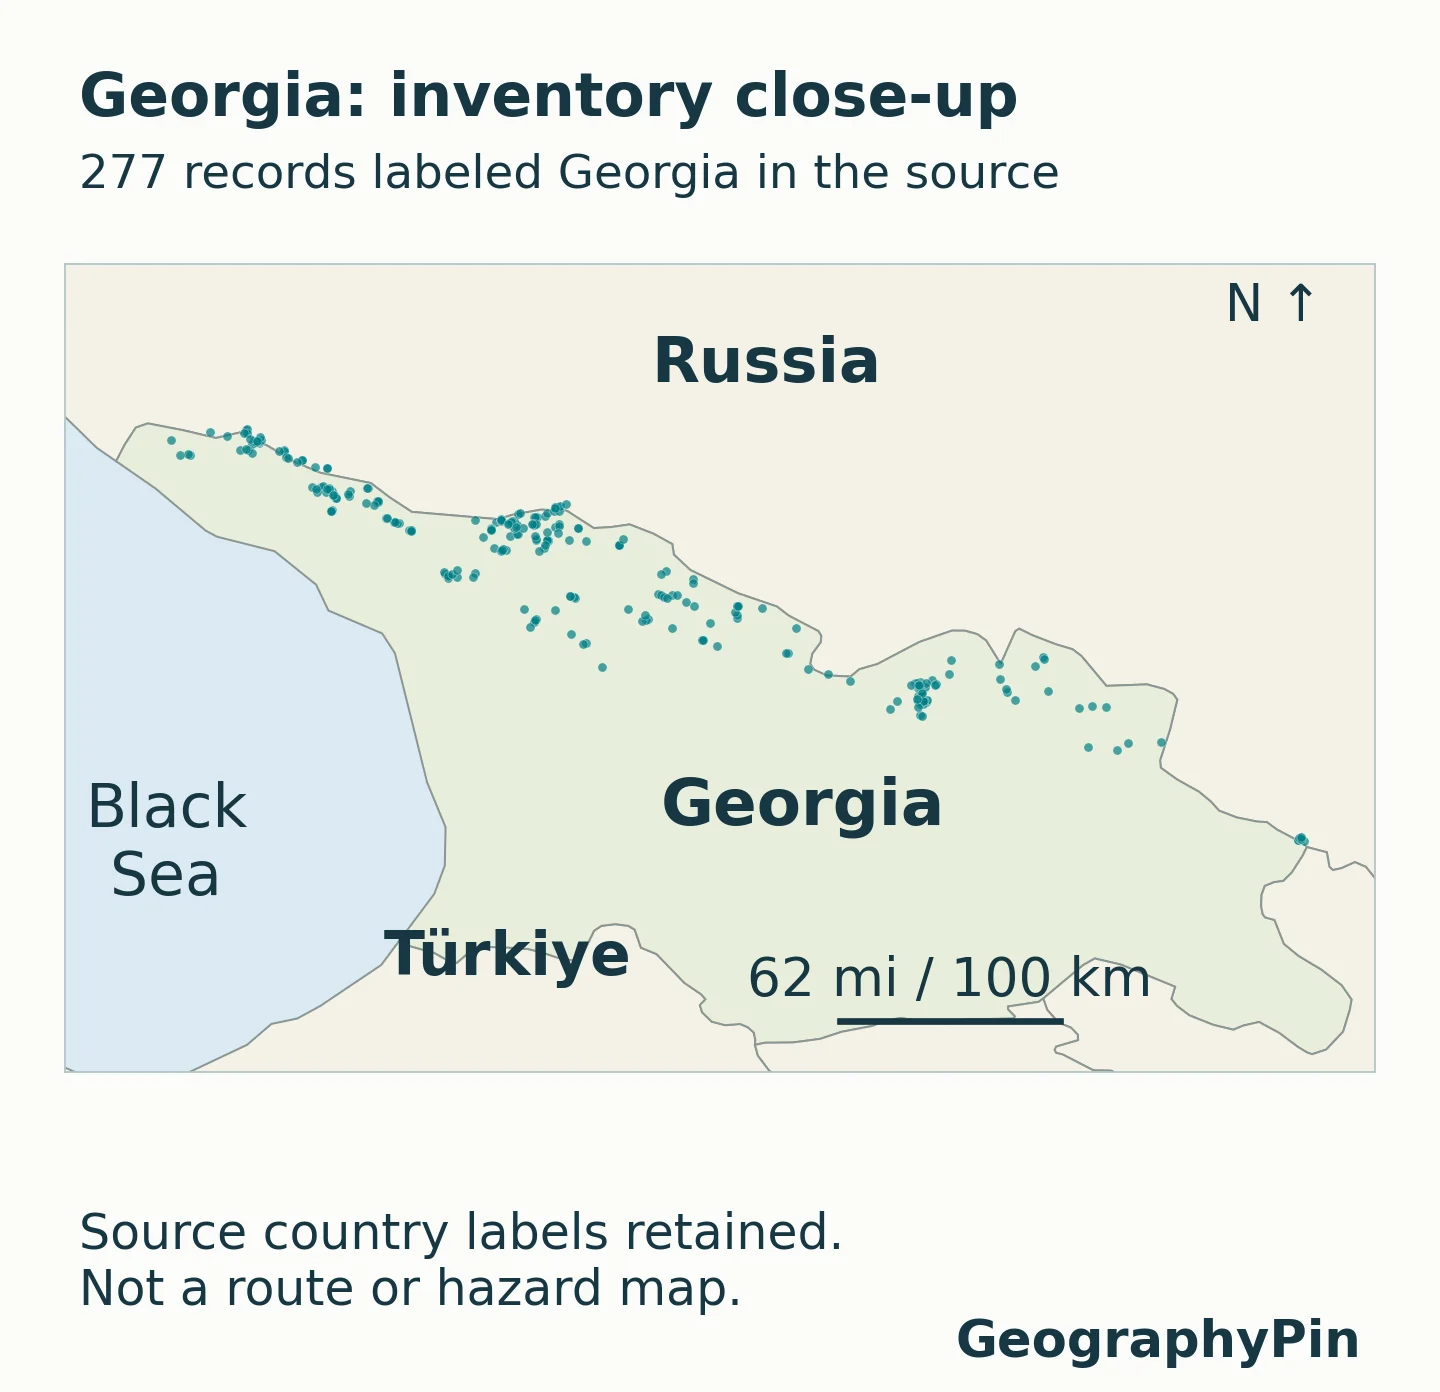
The points place this inventory in Georgia’s mountain geography, but a nearest town is not necessarily the starting point for reaching a lake. Valleys and ridges separate locations that look close on a small map. For broader orientation, use the Georgia country profile; for destination planning, the separate Mestia and Svaneti guide answers a different task.
Country labels in the summaries are transcribed from the research table rather than recalculated from a generalized map. A country total is not a drainage-basin total, a measure of government access, or a statement about the number of currently glacier-fed lakes. Source names are retained rather than replaced with guessed local equivalents.
3. What the country and size comparisons show
The following are GeographyPin calculations from the 973-row export, not a new field survey. Every record is retained, including unnamed entries and the small-area exceptions. Areas are sums of the supplied lake-area values; the extra decimal places support comparison, not a claim of survey-level precision.
| Source country | Records | Share of records | Summed area |
|---|---|---|---|
| Russia | 691 | 71.0% | 3.415 sq mi (8.846 km²) |
| Georgia | 277 | 28.5% | 2.097 sq mi (5.431 km²) |
| Azerbaijan | 5 | 0.5% | 0.037 sq mi (0.095 km²) |
| Total | 973 | 100% | 5.549 sq mi (14.372 km²) |
Russia accounts for about 71% of the records but about 62% of their summed area. Georgia accounts for about 28% of records and about 38% of area. A higher count and a larger total area answer different questions: many small lakes can outnumber a smaller set containing larger water bodies.
Most records describe small water bodies
The median supplied area is about 1.17 acres (4,744 square meters). The median is the middle observation after sorting by area; it is not the arithmetic mean. A total of 504 records are smaller than approximately 1.24 acres (5,000 square meters), while only 18 reach approximately 24.71 acres (100,000 square meters).
| Source area range | Approximate acre equivalent | Records |
|---|---|---|
| Below 500 m² | Below 0.124 acre | 7 |
| 500 to below 5,000 m² | 0.124 to below 1.236 acres | 497 |
| 5,000 to below 10,000 m² | 1.236 to below 2.471 acres | 162 |
| 10,000 to below 50,000 m² | 2.471 to below 12.355 acres | 251 |
| 50,000 to below 100,000 m² | 12.355 to below 24.711 acres | 38 |
| 100,000 m² and above | 24.711 acres and above | 18 |
The grouping thresholds are defined in the source’s square meters so rounding an acre conversion cannot move a record into the wrong bin. A small surface area alone says nothing conclusive about depth, lake age or stability.
4. Why extraglacial does not mean ice-contact
The paper uses extraglacial for glacial-origin lakes in valleys without present glacier occupation, including lakes in glacially eroded hollows. Past ice can shape a basin long before a satellite image records the water now occupying it.
By contrast, supraglacial means on a glacier, and the study’s proglacial group is immediately in front of or beside glacier ice. Its periglacial group is within about 1.24 miles (2 kilometers) of a glacier tongue without direct contact with surface ice. These are the researchers’ operational categories; the word “glacial” alone does not identify which one applies.
All 973 rows in this export carry the same extraglacial type. Coloring their dots as if they represented several different glacier-contact classes would add information the table does not contain. Likewise, a lake’s appearance in a 2025 inventory does not mean that it formed in 2025.
The paper’s outburst assessment applies to the separate 411-lake group. Exclusion from that assessment is not a certificate of safety for the 973 extraglacial records. Neither these maps nor the country table supplies a current warning, a forecast, a route assessment or a probability of flooding.
5. What the measurements can and cannot tell you
Elevation and basin fields are absent from this export
The repository description mentions elevation and river-basin information. However, the downloadable table used here has 15 columns and no separate elevation or river-basin column. Its Area text field is an administrative locality, not surface area and not a basin identifier. It is populated for the Russia records but blank for the Georgia and Azerbaijan records.
That distinction rules out a defensible elevation ranking or lake-by-lake basin comparison from this file alone. Numbers embedded in a lake’s name are not treated as a substitute for a verified elevation field. Assigning a watershed from the nearest river would also be unreliable: the direction of drainage depends on terrain, not proximity.
The paper discusses basin-scale patterns, but those are not silently converted into new assignments for individual records. Georgia’s general drainage pattern is explained in the Georgia rivers map. A future basin analysis would need documented catchment geometry, checked point-to-basin joins and explicit treatment of uncertain locations.
Satellite areas, estimated volumes and small-lake exceptions
The authors manually outlined lakes using Sentinel-2 imagery and calculated their surface areas. Their paper reports a total extraglacial area of approximately 5.55 ± 0.76 square miles (14.37 ± 1.96 square kilometers). The export’s area sum rounds to the same 14.37 square kilometers, but an arithmetic match does not remove uncertainty in the shorelines.
Volume is different. The dataset’s volume values are estimates derived from area, not depth surveys of all 973 lakes. The paper’s regional relationship was developed from 32 bathymetric measurements at nine lakes. When using its equation, area is expressed in thousands of square meters and the resulting volume in thousands of cubic meters; feeding raw square meters into that equation would give the wrong scale.
The study’s nominal selection rules are elevation above about 6,562 feet (2,000 meters) and area of at least about 0.124 acre (500 square meters), with small-lake exceptions retained. The downloaded extraglacial table contains seven area values below 500 square meters, whereas the methods text discusses five exceptions. All seven are kept here; their identifiers are 92, 719, 825, 843, 886, 911 and 930. No unverified reason is assigned to each exception.
The export’s date column spans July 30 to October 15, 2025. The repository’s separate event header gives a shorter interval, and the paper describes most scenes as acquired from July to September. The maps therefore identify the 2025 observation season, not one simultaneous survey day. Individual dates remain in the source download rather than being presented as independently validated scene timestamps.
6. How to use and reuse the inventory
The original tab-delimited inventory download preserves the full source record. Open it in a spreadsheet with tabs as the separator, or import the longitude and latitude columns into a geographic information system as WGS84 decimal degrees.
- Keep the research ID. The Ord No identifier connects a point to its row even when the lake-name field is blank.
- Read missing values literally. No recorded name does not mean no local name exists. Blank locality information is not a new regional classification.
- Match like with like. Compare counts with counts, surface area with surface area, and the extraglacial subset with another explicitly defined subset.
- Preserve the observation period. Do not relabel this as a 2026 lake survey simply because that is when it was released.
PANGAEA releases this dataset under Creative Commons Attribution 4.0, which permits reuse with attribution and the required license notice. Cite Kidyaeva, Iudina, Averina, Pavlyukevich and Gubanov (2026), the dataset title and DOI. Describe any filtering, aggregation or map redesign rather than presenting a derivative as the researchers’ original map.
The downloadable inventory retains the source’s row identifiers; GeographyPin’s maps and summaries report the limits of the available fields. They should be revisited when the authors publish a corrected or expanded inventory. A changed count could reflect a data correction or different selection rules, not necessarily a newly formed or vanished lake.
Frequently Asked Questions
Why might a familiar lake be missing?
The study applies geographic, elevation, size and origin criteria, and this page maps only its extraglacial subset. A missing name may also reflect an unnamed record or a different transliteration. Absence from a name search alone does not establish that the lake was excluded.
Can I calculate mean depth by dividing the volume by the area?
That would produce a model-derived average depth, not a measured one. Because volume is itself estimated from area, the result does not independently reveal the lake bed or the deepest point.
Can these coordinates be used as a walking route?
No. A coordinate identifies a research location, not a trail, legal access point or safe approach. The inventory does not establish present conditions, access permissions, slope hazards or rescue arrangements.
Can the map prove that glacier retreat created more lakes?
Not by itself. This map displays one inventory subset for one observation season. Establishing change requires comparable observations through time and consistent detection and inclusion rules; a larger published list can also reflect more complete mapping.
What Did We Learn Today?
An inventory becomes useful when its map, definitions and measurements are read together. These points represent the extraglacial subset, while country counts and surface-area totals describe different aspects of its distribution. Missing names and missing fields must remain visible limitations, and modeled volume or inclusion in a research table must never be mistaken for measured depth or a present-day safety judgment.
Sources & Data Notes
The underlying observations are from 2025; the PANGAEA release is dated November 6, 2026. GeographyPin counted and summed the 973-row export without dropping unnamed records or small-area exceptions. Country assignments, names and coordinates are source attributes, not independent surveys. Rounded conversions use 1 acre = 4,046.8564224 square meters and 1 square mile = 2.589988110336 square kilometers. The maps show original WGS84 point locations rather than lake polygons. Natural Earth 1:50m country outlines provide generalized context, with Abkhazia and South Ossetia inside Georgia’s internationally recognized outline and no depiction of current control. A generalized border is not suitable for reassessing a lake’s source country assignment. The available export does not support elevation or basin rankings.
- Kidyaeva, V.; Iudina, V.; Averina, A.; Pavlyukevich, E.; Gubanov, A. (2026), Extra glacial lake inventory of the Caucasus, 2025: geographic identification and morphometric characteristic. PANGAEA, CC BY 4.0.
- Kidyaeva and colleagues (2026), Glacial Lake Inventory and GLOF Hazard Assessment in Caucasus Region. GeoHazards 7(5), 130. Definitions, methods, uncertainty and separation of the extraglacial subset from the hazard-assessed lakes.
- Creative Commons Attribution 4.0 International: data-reuse conditions.
- Natural Earth, 1:50m Admin 0 Countries, version 5.1.1, public domain. GeographyPin plotted the source points on this generalized basemap; north is up, and the geographic aspect is adjusted at 43°N. Scale bars are approximate away from their reference latitude.