A soil report gives 40% sand, 40% silt and 20% clay, but the diagram has three axes instead of two. The soil texture triangle turns those proportions into a class name such as loam. Reading it correctly starts with understanding what the percentages measure and which way each scale increases.
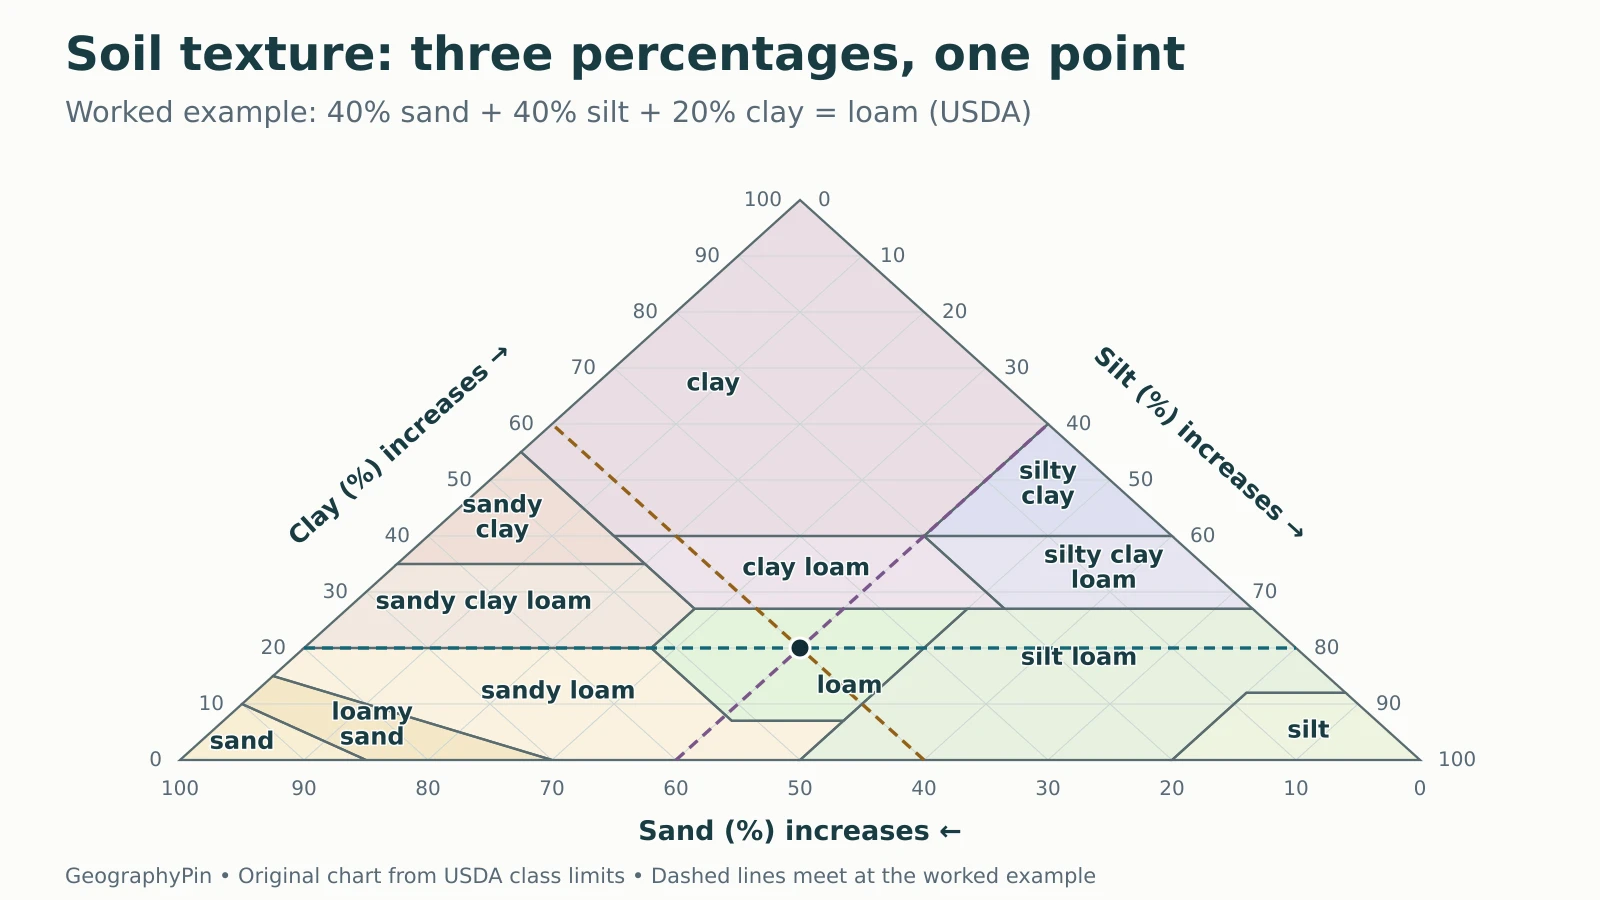
First confirm that sand, silt and clay percentages total 100 on the same fine-earth weight basis. Find each percentage on the USDA triangle and follow its grid line into the diagram. The three lines meet at one point, whose region gives the texture class. For example, 40% sand, 40% silt and 20% clay is loam.
How to use this article: You can check what the percentages measure, follow the three axes, classify three examples, or handle rounding near a boundary.
Check the Percentage Basis Before Plotting
Texture describes particle-size proportions
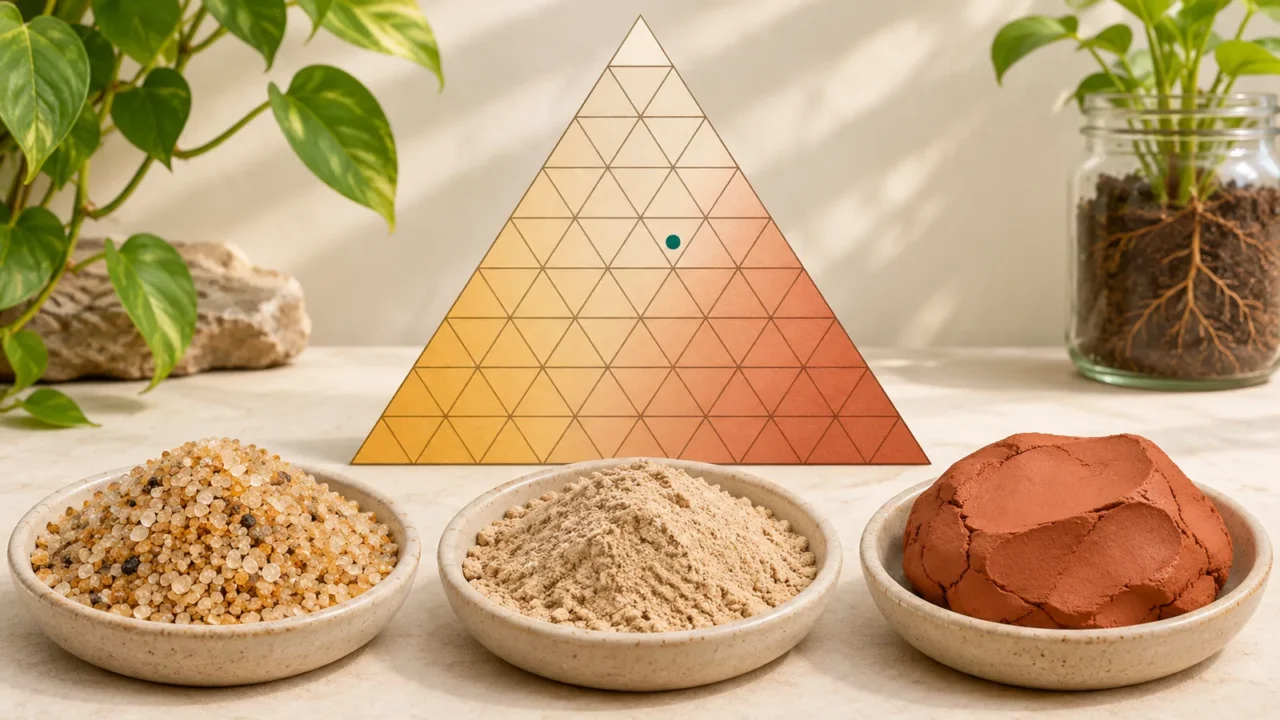
Soil texture describes the proportions of sand, silt and clay-sized particles. Sand is the coarsest of these three groups, clay the finest, and silt lies between them. A texture class combines all three proportions rather than choosing whichever word sounds most familiar.
The USDA’s 2024 field book defines texture using weight percentages of the fine-earth fraction, smaller than 2 millimeters. This scientific size threshold uses the standard metric convention. Coarse fragments at or above that size are described separately; gravel is not a fourth axis.
The laboratory preparation and reporting basis matter. The chart is not a pie chart of the whole soil’s water, air, roots, organic matter and stones. Use the reported mineral particle-size percentages, not percentages of garden-bed volume.
Check the total: 40 + 40 + 20 = 100. If a report provides 45% sand and 35% silt on that same complete basis, the remaining clay is 100 − 45 − 35 = 20%. If the categories or basis are unclear, clarify them before calculating a remainder.
Follow the Grid Lines, Not Vertical Lines from Every Axis
Each scale increases toward its own corner
A triangle works because the three percentages must sum to 100. Once two are known, the third is fixed. Every point therefore represents one combination, not three unrelated measurements.
In the USDA orientation shown below:
- Clay increases upward along the left edge. Constant-clay lines run horizontally, parallel to the base.
- Silt increases downward along the right edge. Constant-silt lines run parallel to the left edge.
- Sand increases from right to left along the base. Constant-sand lines run parallel to the right edge.

The University of Nebraska–Lincoln’s texture lesson explains these same parallel-line directions. Start by reading the labels, because a differently oriented ternary chart may place its components elsewhere.
For the marked example, follow 20% clay horizontally, 40% sand diagonally up-left, and 40% silt diagonally down-left. All three meet inside loam. If they form a small triangle instead, recheck your totals, the axis direction and any rounding.
Classify Three Samples and Check the Result
The region name is the answer
The following are fictional compositions with percentages safely inside their USDA class regions. Read each row in the same sand–silt–clay order; switching the columns changes the point.
| Sample | Sand | Silt | Clay | Texture class |
|---|---|---|---|---|
| A | 40% | 40% | 20% | Loam |
| B | 60% | 30% | 10% | Sandy loam |
| C | 40% | 30% | 30% | Clay loam |
A and C have the same sand percentage, but they are not the same texture. Moving from A to C replaces 10 percentage points of silt with clay. On the triangle, the point moves along the constant-40%-sand line into clay loam.
The USDA Soil Survey Manual, chapter 3, defines the class boundaries. It recognizes 12 basic classes. Loam is a region containing many compositions, not a requirement for exactly 40–40–20 or equal thirds.
The official NRCS texture-calculation resources provide another way to check percentages. The optional sand-size subdivisions refine some names; they do not add a fourth component to the basic triangle.
Keep Precision Near a Class Boundary
A rounded label can hide which side the sample occupies
USDA’s loam-to-clay-loam boundary includes a 27% clay segment, not 28%. Suppose one fictional sample contains 40% sand, 33.1% silt and 26.9% clay. It is loam. Another contains 40% sand, 32.9% silt and 27.1% clay. It is clay loam.
Both can round to 40%, 33% and 27% when displayed as whole numbers. That does not make their original classifications identical. Classify using the appropriate reported precision and the stated system, rather than rounding first and treating the result as exact.
A sample on a boundary needs the formal class rule, not a guess based on the thickness of a printed line. Measurement uncertainty also matters: a precise-looking graph cannot recover precision absent from the analysis. Record uncertainty or a field estimate honestly instead of inventing extra decimal places.
Separate Texture from Structure and Soil Quality
Texture is composition; structure is arrangement. Structure describes how particles form aggregates and how pores connect. Two samples with the same texture can have different aggregation or compaction.
Colorado State University Extension distinguishes texture, structure and pore space. Crushing a clod into smaller aggregates does not automatically turn its constituent clay-sized particles into sand-sized mineral grains.
Texture helps explain water and nutrient behavior, but the triangle does not measure fertility, contamination, drainage rate or suitability for a particular crop. Organic matter, mineralogy, structure, profile depth and other conditions also matter. NC State’s soil guide treats physical properties and chemical testing as different parts of soil assessment.
Likewise, “clay” can mean a particle-size fraction or a texture class. Sample A contains 20% clay-sized particles but is classified as loam. Do not replace the complete class name with the name of just one ingredient.
Record a Reproducible Texture Description
A useful result states more than a label: “Sample A: 40% sand, 40% silt and 20% clay by the reported fine-earth weight basis; USDA texture class loam.” For a real sample, also retain its location, sampled depth or horizon, analysis method and relevant uncertainty.
The Soil Survey Manual distinguishes laboratory particle-size determinations from field estimates by feel. A hand-texturing estimate can be useful, but should be identified as an estimate. Settled layer heights in a household jar are not automatically equivalent to standardized laboratory weight percentages.
Check the reporting system before comparing datasets. Particle-size and classification conventions can differ between soil-science and engineering systems. The class on this page is a USDA textural class, not a complete soil taxonomic identity or a site-specific engineering assessment.
For practice with related soil properties, try the Soil Geography Quiz. The physical-geography guide places soil study within the wider connections among land, water, climate and living systems.
What Did We Learn Today?
A soil texture triangle classifies a composition, not the quality of an entire site. Check the fine-earth percentage basis and total, follow the correct three grid directions, and read the region at their intersection. Keep precision near boundaries, name the USDA system and distinguish measured particle proportions from structure, field estimates and broader soil assessment.
Sources & Data Notes
All sample compositions are illustrative. The original chart was constructed from the USDA Soil Survey Manual’s 12 class definitions and checked against the 2024 field-book triangle. Exact boundary membership follows the formal definitions, not printed line width. Millimeters are retained for the scientific fine-earth cutoff. No real soil test, location-specific amendment or crop recommendation is presented.
- USDA NRCS: Field Book for Describing and Sampling Soils, version 4.0, pages 2–35 to 2–37
- USDA NRCS: Soil Survey Manual, chapter 3, pages 120–125
- University of Nebraska–Lincoln: Soil Texture
- USDA NRCS: Soil Texture Calculator resources
- Colorado State University Extension: Texture, Structure and Pore Space
- NC State Extension: Soils and Plant Nutrients