A before-and-after image of the Aral Sea can show a striking disappearance, but it can also hide an important distinction: not every part followed the same path. The useful comparison identifies the date, the basin and whether the picture shows water on the surface or a measure of how much water remains.
The Aral Sea shrank into separate northern and southern basins after large river diversions reduced its water supply. The South Aral then fragmented further. Kazakhstan’s dam-supported North Aral recovered partly, while southern waters fluctuated and contracted. Dated satellite images show these different outcomes; they are not a map of today’s shoreline.
How to use this article: Compare the two August snapshots, identify the basin names, or separate northern recovery from a whole-sea recovery claim.
1. Read the Aral Sea before-and-after images
Two August snapshots, not a live shoreline
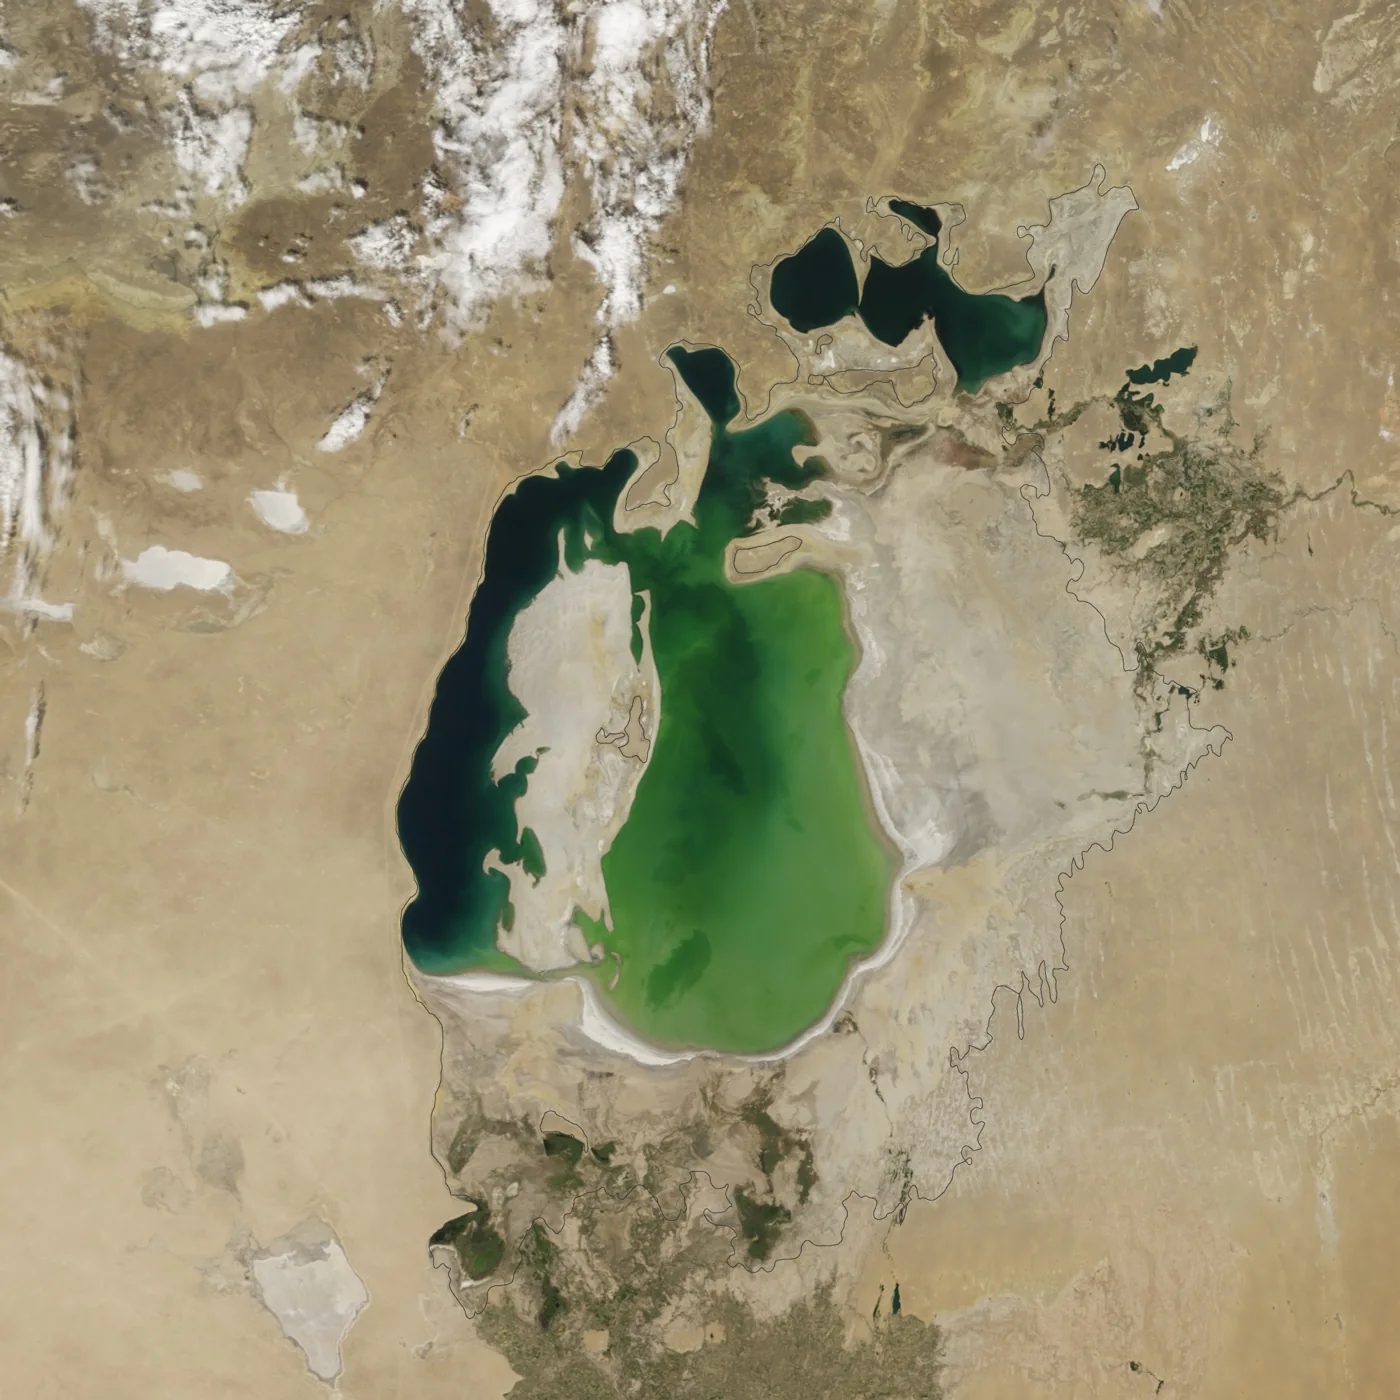
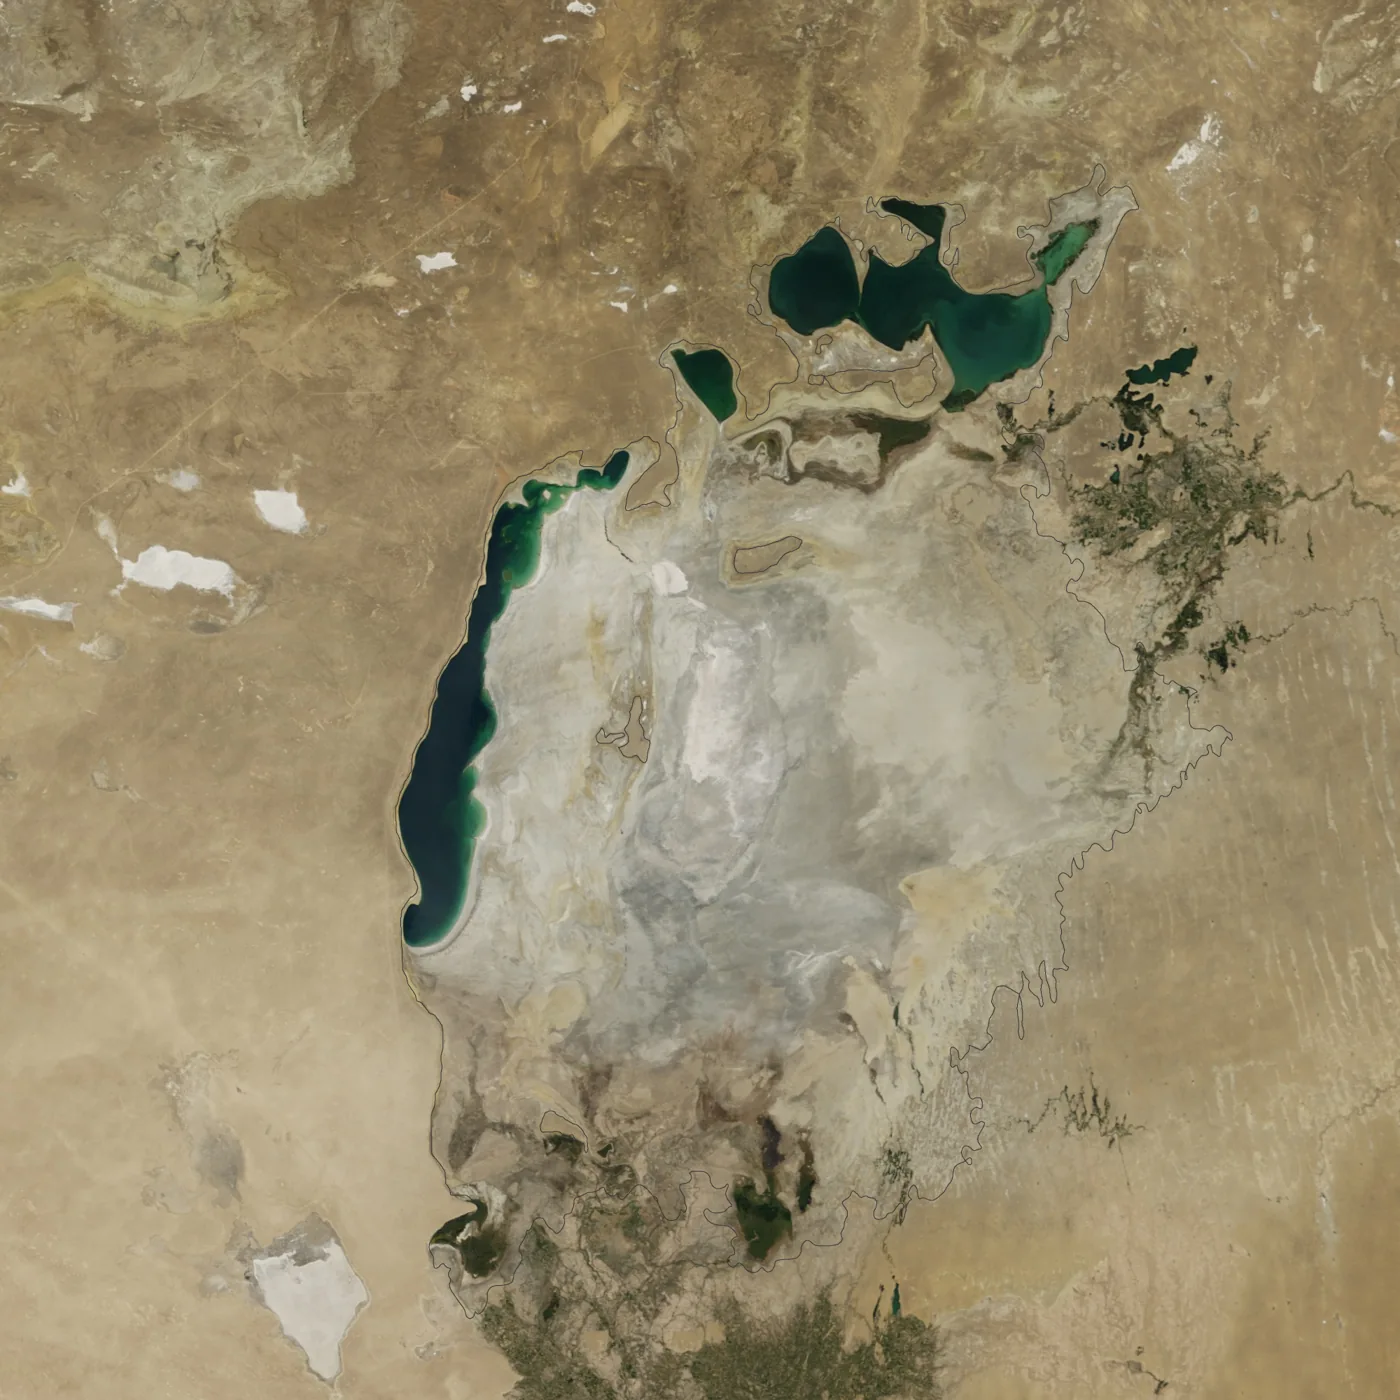
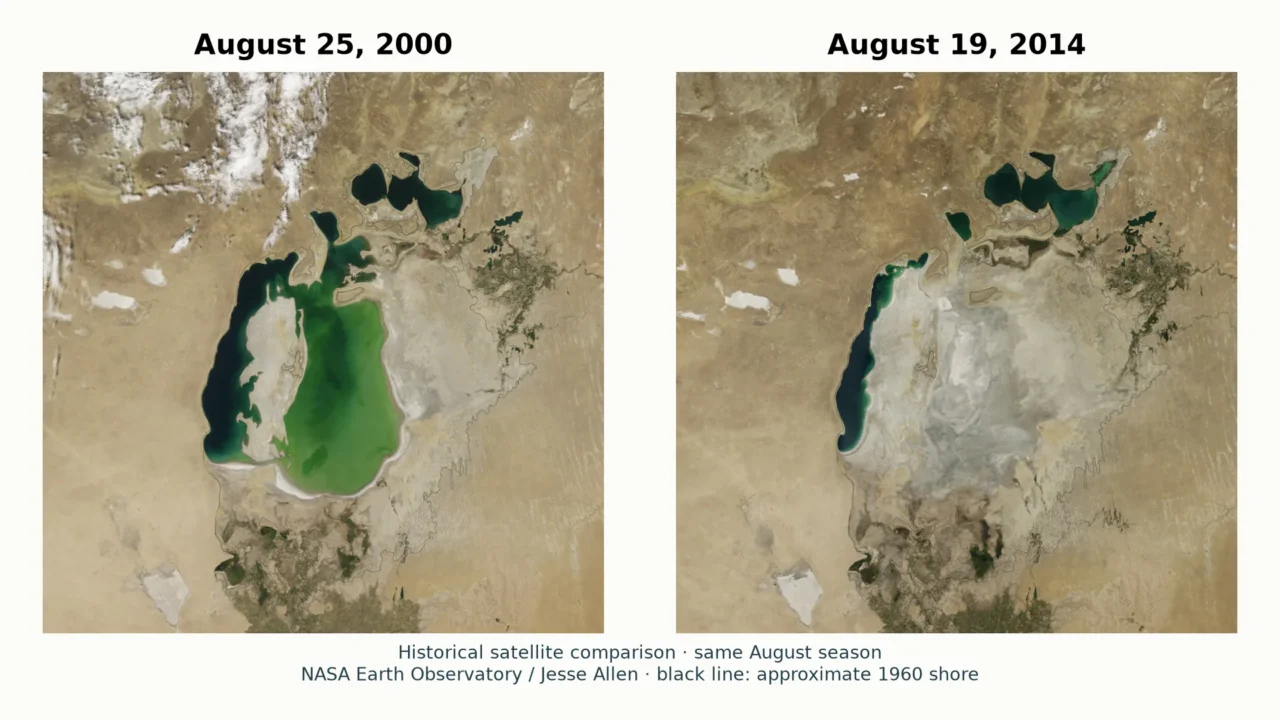
These NASA Terra/MODIS views compare August 25, 2000 with August 19, 2014. Both are late-summer observations, presented at matching scale and geographic framing. The comparison is therefore more useful than placing a spring flood image beside a late-summer low-water image without explaining the difference.

Start with the northern water body near the top. Then follow the long western strip of the South Aral and the broad eastern basin beside it. In the 2000 image, considerable water occupies the southern basin. In the 2014 image, its eastern lobe is dry, while water remains elsewhere. NASA’s account of the 2014 event explicitly identifies the eastern basin of the South Aral, not the entire Aral Sea, as the part that dried completely.
The older image is not a picture of an undamaged Aral Sea. By 2000, decades of shrinkage had already separated the northern and southern waters. NASA’s approximate 1960 shoreline outline supplies a historical reference around the much smaller water bodies. It is a reconstructed reference line, not a satellite observation from 1960.
Nor is 2014 the end of the story. NASA’s longer image sequence documents later fluctuations through 2018. A dry basin on one date does not establish that it remained dry on every later date. Read the dates before treating any widely shared “before and after” pair as a present-day map.
2. Locate the North Aral, South Aral and their rivers
The Aral Sea lies in Central Asia between Kazakhstan and Uzbekistan. The North Aral is in Kazakhstan; the former larger southern water body extended across the Kazakhstan–Uzbekistan border region. This is an inland drainage system, not an arm of the ocean. Its major tributaries are the Syr Darya from the east and southeast and the Amu Darya approaching from the south.
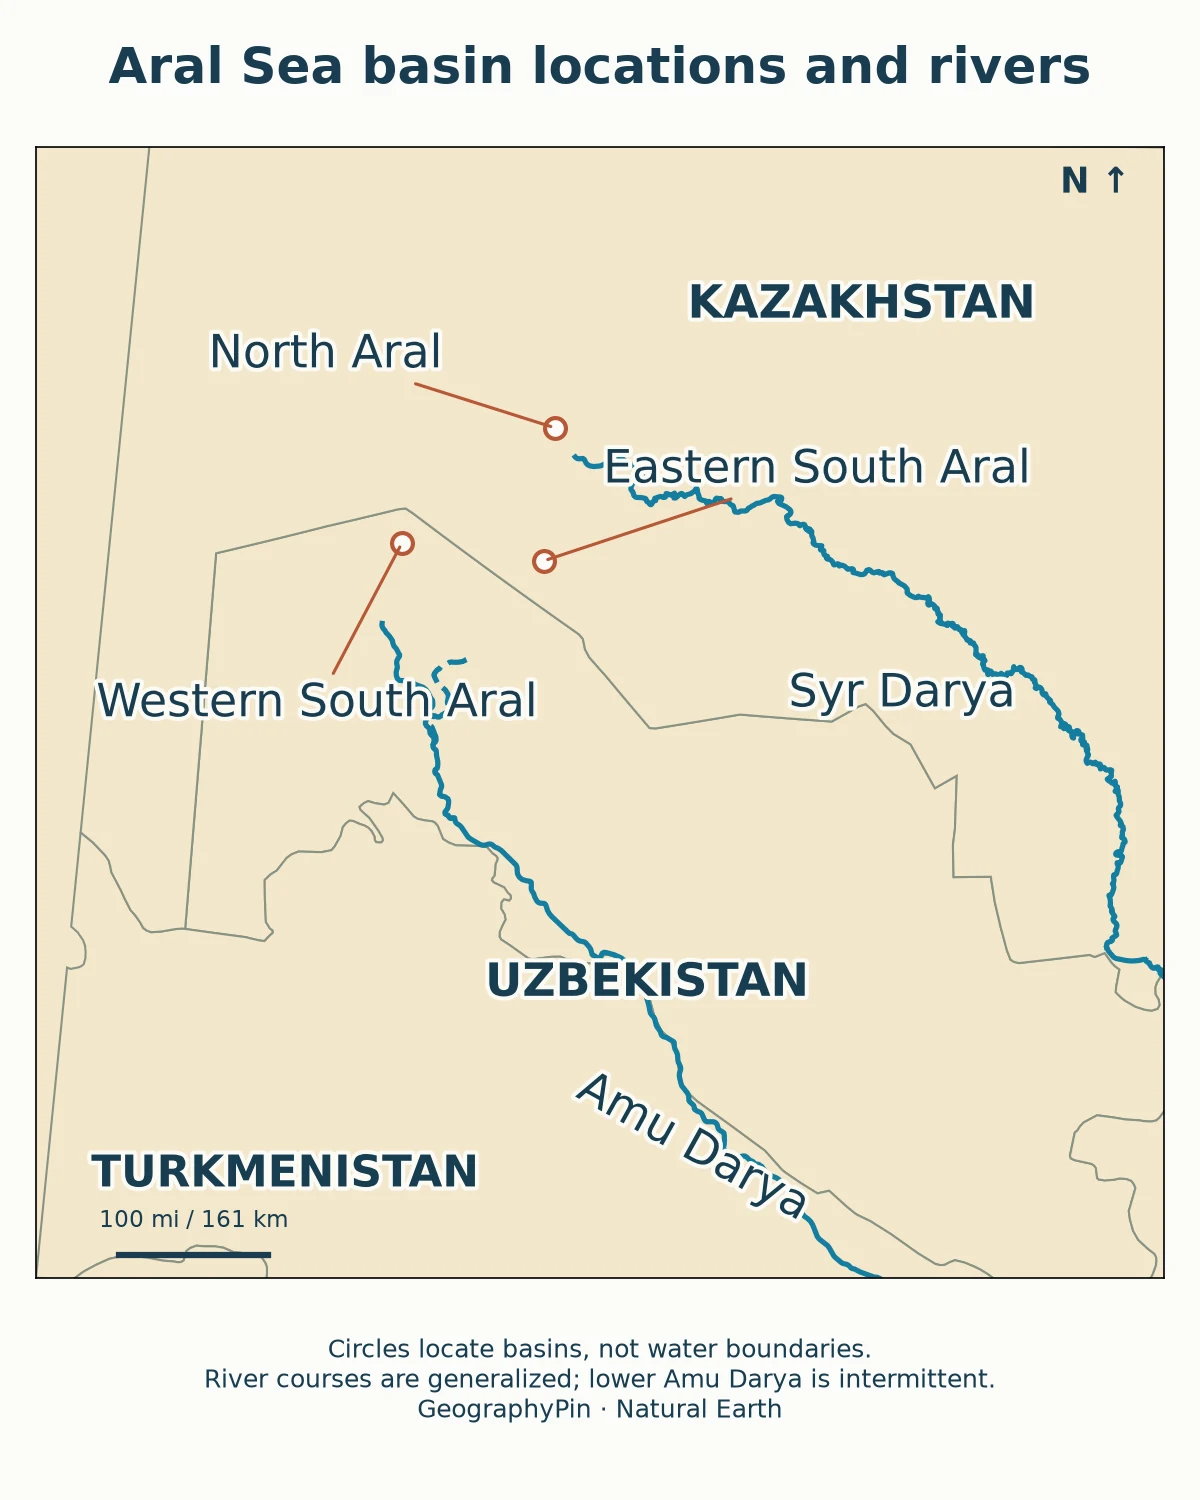
The names describe different pieces of the former lake
| Name | Where to look | What the name means |
|---|---|---|
| North Aral / Small Aral | Northern end, in Kazakhstan | A separate water body supplied by the Syr Darya and retained by the Kok-Aral structure. |
| South Aral / Large Aral | South of the North Aral | The former larger southern water body; not one unchanging lake outline. |
| Western South Aral | Longer, narrow western depression | The deeper western lobe, distinct from the shallow eastern basin. |
| Eastern South Aral | Broad low basin to the east | The shallow lobe that nearly dried in 2009, received water again in 2010 and dried completely in summer 2014. |
| Aralkum | Exposed parts of the former lakebed | Desert terrain created as the water retreated, not the name of a surviving lake. |
These are the principal units needed to read the comparison, not an exhaustive inventory of every disconnected pool or delta lake. A fixed answer such as “the Aral Sea is now three lakes” can become misleading as water levels change and smaller connections open or close.
The river names also prevent a common mix-up: the Syr Darya is the main inflow relevant to the North Aral recovery story; the Amu Darya is central to the southern basin’s losses and intermittent replenishment. Showing a river channel on a locator does not prove that water reaches its historical mouth continuously.
For the wider regional setting, the Central Asia countries map places Kazakhstan and Uzbekistan alongside their neighbors. For the underlying terminology, the definition and water balance of a lake explains why an inland water body can still be called a “sea.”
3. Why one lake became separate basins
Less river water reached a basin that kept losing water
A lake does not need to drain through a newly opened outlet to shrink. Its storage falls whenever losses exceed inputs. For the Aral, the critical modern change was the diversion of water from the Amu Darya and Syr Darya for irrigation, especially during Soviet-era agricultural expansion. Cotton was important, but saying that all diverted water served only cotton oversimplifies a broader irrigation system.
Evaporation continued while less river water arrived. As the surface fell, shallow connecting areas emerged. Water that had once formed a single large lake became isolated in separate depressions. The resulting shorelines depended on the shape of the lakebed as well as the amount of water entering it.
That basin geometry explains why the southern lobes did not shrink identically. Water can retreat a long distance across a shallow floor with a relatively modest fall in level, while a deeper depression retains a narrower body of water. A dramatic horizontal shoreline retreat is therefore not a direct measurement of depth lost.
A short chronology of the visible changes
| Period | What changed |
|---|---|
| 1960s onward | Large-scale river diversions drove the modern retreat; the 1960 outline is a historical comparison baseline. |
| By August 2000 | North and South Aral were already separate; the South Aral had eastern and western lobes with tenuous connections. |
| 2005 | Completion of the Kok-Aral dam and dike helped retain water in the northern basin. |
| 2009–2010 | The eastern southern lobe nearly disappeared in 2009, then water spread back over its shallow floor in 2010. |
| August 2014 | NASA documented a completely dry eastern southern basin, with water persisting in other parts. |
| August 2026 | Kazakhstan reported a dated water-volume estimate for the North Aral, not restoration of the whole former sea. |
Weather and upstream snowmelt still matter. NASA attributed the 2014 eastern-basin drying to reduced rain and snow in the watershed alongside continued irrigation withdrawals. Climate variability changes the water available in a particular year, but it does not erase the role of long-term diversion in the modern collapse.
4. What northern recovery does—and does not—mean
Recovery has a location, a measure and a date
The Kok-Aral dam and dike, completed in 2005, retain water in the North Aral rather than allowing it to drain freely toward the lower southern basin. NASA observed a strong northern rebound between 2005 and 2006 and describes the recovery of fisheries there. This is a real improvement in one part of the system, not a return to the single lake shown by the 1960 outline.
A more recent, separately dated indicator comes from Kazakhstan’s Ministry of Water Resources and Irrigation. Its August 19, 2026 statement reported about 5.6 cubic miles (23.4 cubic kilometers) of water in the North Aral. That is a volume estimate for the northern water body on the ministry’s reporting date. It is not the area of the whole Aral Sea, and it does not supply a matching southern shoreline survey.
The historical satellite pair and the newer ministry estimate answer different questions. The images reveal where surface water appeared on two August dates; the statement describes water stored in one basin years later. Combining them into a single undated “current Aral Sea” statistic would discard the distinction that makes each useful.
Saving northern water is not the same as refilling the south
Northern retention helps explain why “the Aral is recovering” and “the Aral has suffered enormous losses” can both be true. The first statement needs a defined basin and measure; the second describes the wider historical transformation. Water retained in the north is not simultaneously available to fill the south.
Southern restoration also includes work on land that is no longer under water. The World Bank describes vegetation planting and landscape rehabilitation on the exposed seabed in Uzbekistan. Those projects aim to stabilize soils and reduce wind erosion. Their success should not be reported as equivalent to re-creating the former lake.
The comparison here deliberately makes no claim to map the exact southern shoreline in 2026. A current basin-by-basin water-extent assessment would require newer dated observations and consistent treatment of shallow water, wet sediment and small isolated pools. The 2014 image cannot substitute for that assessment.
5. Compare area, volume and seasonal change correctly
| Measure | What it answers | Common mistake |
|---|---|---|
| Surface area | How much ground is covered by water? | Calling an area percentage a percentage of water volume. |
| Volume | How much water is stored? | Assuming a broad shallow refill replaces the former deep storage. |
| Water level | How high is the surface relative to a stated datum? | Treating a level change as an equal shoreline movement everywhere. |
| Salinity | How concentrated are dissolved salts? | Applying one basin’s measurement to every remaining water body. |
Table downloads (3)
- Principal names used for the Aral Sea system (6 × 3)View tableDownload CSV
- Selected milestones, not a continuous annual record (7 × 2)View tableDownload CSV
- Four measurements that should not be substituted for one another (5 × 3)View tableDownload CSV
NASA’s account of the 2010 southern refill illustrates the area–volume trap. A shallow layer of water spread across the eastern lakebed, making the lobe look much larger than it had in 2009. A larger blue patch did not mean the former volume had returned.
Likewise, water color is not a salinity meter. Sediment, water depth and other optical conditions affect what a satellite sees. A pale or turquoise surface cannot be converted into a salt concentration simply by looking at the image.
For a fair before-and-after comparison, keep four checks together: use the same geographic footprint; show the acquisition dates; compare similar seasons; and identify the basin. Even late-August scenes are single observations rather than annual averages. They reduce one source of seasonal mismatch without eliminating differences in weather, inflow or reservoir operation.
This is why an undated claim that the sea “lost 90 percent” is incomplete. Ninety percent of which measure, relative to which baseline, across which basins, and on what date? A percentage without those details can sound precise while hiding the most important information.
6. What the exposed lakebed tells us
Retreating water changes more than the blue shape on a map. It exposes sediments and salts, moves shorelines away from former waterfronts and changes the relationship between communities and fisheries. The exposed Aralkum is part of the Aral story even where no open water remains.
The World Bank’s December 2024 account describes salt and agricultural residues in exposed soils, wind erosion, damage to land and threats to livelihoods. Its restoration discussion emphasizes adapted vegetation that helps bind soil. This is a different task from increasing lake storage, and both need their own evidence of progress.
The strongest reading of the map therefore avoids two extremes: the entire Aral Sea has not simply vanished, and a northern recovery does not undo the regional environmental loss. The visible pattern is a fragmented water system alongside a large transformed lakebed, with outcomes that differ by place and time.
Frequently Asked Questions
Is the Aral Sea connected to the Caspian Sea?
Not as a present-day surface-water outlet. The Aral is an inland, closed drainage system. The Caspian lies farther west; putting both on a regional map does not mean that their water surfaces are connected.
Why do some maps still show one large Aral Sea?
A map may depict a historical shoreline, use an old basemap or simplify the feature at small scale. Check its data date and legend. An outline retained for historical comparison is useful only when it is clearly distinguished from observed water.
Can I calculate the amount of water lost from these two pictures?
Not reliably from the pictures alone. Estimating volume requires information about water levels and the shape and depth of the basin, as well as a consistent date and boundary. A surface-water comparison is not a bathymetric survey.
What Did We Learn Today?
The Aral Sea’s changing outline is a story of river supply, basin shape and water management, not one uniform disappearance. Its northern and southern waters need to be read separately, and every comparison needs a date. Matching satellite views reveal shoreline change; they do not by themselves measure volume, salinity or the success of restoration across the entire system.
Sources & Data Notes
The main comparison uses NASA Terra/MODIS images acquired August 25, 2000 and August 19, 2014, with their original matching view retained. NASA’s 1960 shoreline is approximate. These are historical observations, not a current shoreline survey. The North Aral volume is a separate Kazakhstan ministry report dated August 19, 2026, rounded from cubic kilometers to cubic miles. The regional locator shows generalized river geography, not measured contemporary flow or a mapped watershed boundary.
- Natural Earth: Rivers and Lake Centerlines, generalized river source for the locator
- Natural Earth: public-domain data terms
- NASA Earth Observatory: The Aral Sea Loses Its Eastern Lobe, including image dates and credit
- NASA Earth Observatory: World of Change, Shrinking Aral Sea
- NASA Earth Observatory: The Shrinking Aral Sea Recovers, the 2010 shallow-water refill
- Kazakhstan Ministry of Water Resources and Irrigation: North Aral water report, August 19, 2026 (Russian)
- World Bank: Greening the Desert, landscape restoration in Uzbekistan, December 4, 2024