An El Niño map, a winter outlook and a snowfall forecast answer different questions. The useful comparison for this winter is between the Pacific climate signal and NOAA’s separate forecasts for U.S. temperature and precipitation, with the dates kept visible.
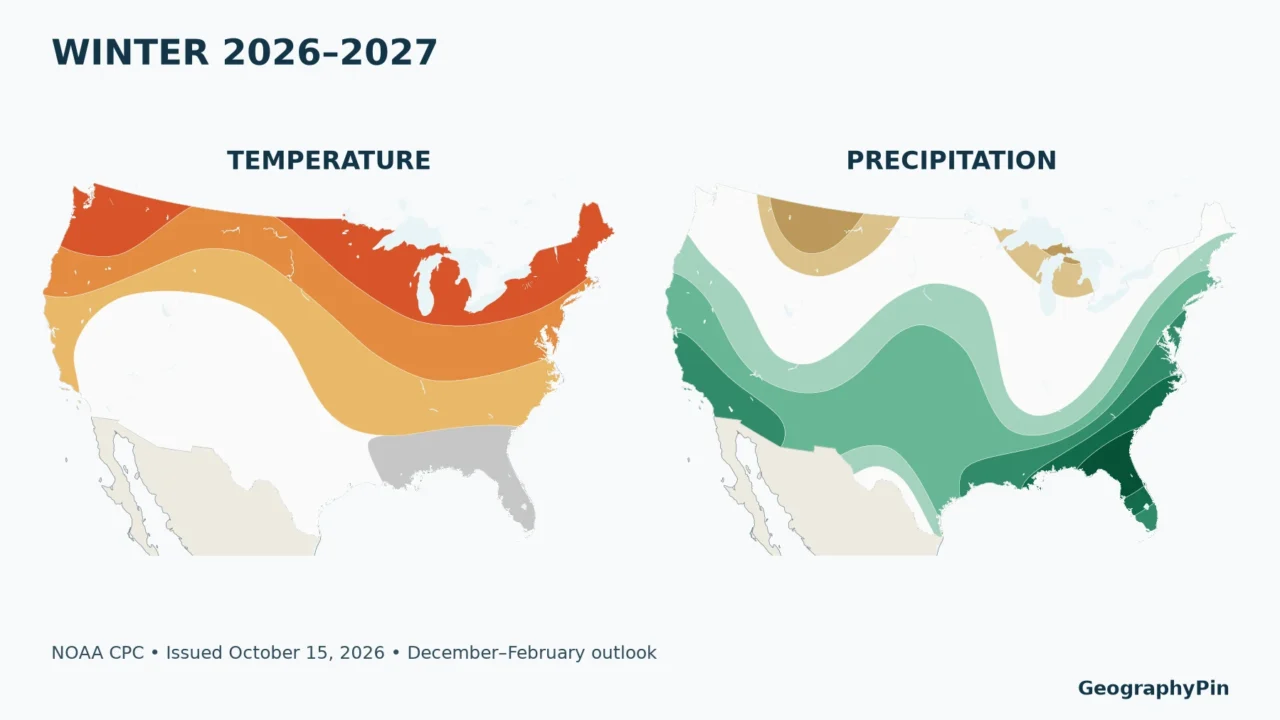
The 2026–2027 U.S. winter outlook favors warmer conditions across much of the North and wetter conditions across the South and East. El Niño is a major influence, not a guarantee. The maps below cover December–February and show probabilities for seasonal temperature and precipitation categories, not snowfall totals or individual storms.
How to use this article: Start with the two issue dates, compare city reference points, or check what equal chances means before interpreting your location.
1. Read the Forecast Dates Before the Colors
A November advisory and an October winter outlook
The Climate Prediction Center’s November 12, 2026 ENSO discussion keeps an El Niño Advisory in effect. It reports that a strong-to-very-strong event remains likely through January–March 2027, with a probability above 79%.
The U.S. maps are a different product. They were issued on October 15, 2026 and are valid for December 2026–February 2027, often abbreviated DJF. The November ENSO discussion does not automatically replace those October seasonal maps. CPC lists November 19 as the next seasonal outlook release.
That distinction prevents a common mistake: putting the newest advisory date on an older temperature map. Another is choosing the first seasonal panel on CPC’s website, which currently covers November–January rather than meteorological winter. Always read both the issue date and the three-month period.
The original maps below redraw CPC’s forecast polygons for the contiguous United States. Alaska, Hawaii and U.S. territories are not shown in this map extent; use the official winter outlook for their coverage. A number marks a city reference point, not an airport observation or a citywide forecast boundary.
2. Temperature: A Warmer North Does Not Mean No Cold Spells

Number key: 1 Los Angeles; 2 Minneapolis; 3 Seattle; 4 Dallas; 5 Miami; 6 Atlanta; 7 Chicago; 8 New York. The same numbers appear on the precipitation map and in the comparison table.
The strongest warm shading on this contiguous-U.S. map follows parts of the Pacific Northwest and northern states, including the Upper Midwest and Great Lakes. Farther south, much of the Southwest is unshaded for equal chances. A gray near-normal area covers part of the Gulf Coast and Florida.
“Above normal” concerns the average temperature across the entire three-month season relative to the 1991–2020 reference climate. It does not mean every day will be mild. A season can finish warmer than normal while still containing a damaging cold outbreak, snowstorm or extended icy spell.
Similarly, near-normal is a favored category, not a promise of ordinary weather every week. Large swings can average into the middle category. Compare the meaning of a temperature anomaly and its baseline before treating a warm color as an absolute temperature.
3. Precipitation: Wetter Is Not the Same as Snowier

Number key: 1 Los Angeles; 2 Minneapolis; 3 Seattle; 4 Dallas; 5 Miami; 6 Atlanta; 7 Chicago; 8 New York.
The precipitation map favors a wetter season across much of the southern United States and along the East Coast. Parts of the northern Rockies and Great Lakes favor the drier category. Other areas have no favored category. These broad patterns are not a forecast that every state receives the same outcome.
Precipitation includes water arriving as rain or frozen precipitation, expressed as its liquid-water equivalent. Snowfall accumulation depends on additional conditions: temperatures through the atmosphere, the storm track, elevation and the timing of cold air relative to moisture. A wet winter can be predominantly rainy at a low-elevation location.
NOAA’s winter outlook does not project seasonal snowfall totals. Nor can its colors establish the chance of snow on the ground on December 25. That is a separate question from both total winter precipitation and whether snow falls on Christmas Day. Our White Christmas probability map explains the historical snow-depth measure.
Local mechanisms also matter. Around the Great Lakes, lake-effect snow bands can produce sharp contrasts across short distances. The lake-effect snowbelt map provides geographic context, not a substitute for a current storm forecast.
4. Compare the Same Point on Both Maps
Eight city reference points
These examples come from point-in-polygon checks of the actual CPC GIS layers, not from assigning one forecast to an entire state. The coordinates are Natural Earth’s representative city locations. Probability bands reproduce the map’s favored-category intervals; they are not precise predictions for individual homes.
| City reference | Temperature | Precipitation |
|---|---|---|
| 1. Los Angeles | Equal chances | Above normal, 50–60% band |
| 2. Minneapolis | Above normal, 50–60% band | Equal chances |
| 3. Seattle | Above normal, 50–60% band | Equal chances |
| 4. Dallas | Equal chances | Above normal, 40–50% band |
| 5. Miami | Near normal, 33–40% band | Above normal, 50–60% band |
| 6. Atlanta | Above normal, 33–40% band | Above normal, 40–50% band |
| 7. Chicago | Above normal, 50–60% band | Equal chances |
| 8. New York | Above normal, 40–50% band | Above normal, 40–50% band |
Los Angeles illustrates why the two maps must be read separately: its point falls in equal chances for temperature but a wetter-than-normal precipitation band. Minneapolis and Chicago have favored warmth without a favored precipitation category at their plotted points. Miami combines a near-normal temperature category with favored wetness.
A neighboring place can fall in another polygon. These are broad-scale seasonal outlooks, and contour boundaries should not be treated as sharp physical weather barriers. For a location close to a contour, the safest reading is the surrounding regional tendency rather than an exact threshold at a street address.
5. Understand the Probabilities
Equal chances is not a near-normal forecast
The outlook divides the historical range into three categories: below normal, near normal and above normal. Without a forecast tilt, each category has roughly one-third of the probability. An equal-chances area retains that three-way baseline; it does not specifically favor the middle category.
By contrast, a gray near-normal temperature area explicitly favors the middle category. White and gray therefore communicate different information. The map legend is essential, especially when comparing temperature and precipitation images with different color palettes.
A 50–60% band is not 50–60% more rain
Suppose a point is in a 50–60% above-normal precipitation band. The category has a greater probability than its roughly one-third climatological share. The band does not say rainfall will exceed normal by 50–60%, that it will rain on half the days, or that every storm will be stronger.
Also, “favored” does not always mean more likely than all other outcomes combined. An above-normal category with a probability in the 33–40% band can be the single favored category while the other two categories together still hold most of the probability. A forecast tilt is useful information without being certainty.
6. Separate El Niño Tendencies from This Winter’s Forecast
El Niño involves linked changes in the tropical Pacific Ocean and atmosphere. The November advisory describes stronger-than-average ocean warmth and an atmospheric response, including altered winds and tropical rainfall. It is not a storm that travels intact from the Pacific into the United States.
Historical El Niño winters help forecasters interpret how Pacific conditions can influence North American circulation. A shifted jet stream can change where winter storms tend to travel. But the historical relationship is a tendency across events, not a deterministic template for the next winter.
The current CPC outlook also considers forecast models, longer-term climate trends and other climate influences. That is why a generic “typical El Niño winter” illustration should not replace the dated official temperature and precipitation maps. Even unusually strong events do not reproduce every familiar impact in every region.
El Niño strength and local weather risk are different quantities. A high probability of a strong Pacific event does not become the same percentage chance of a wet winter in your city. The regional map supplies the relevant local seasonal probability; shorter-range forecasts address specific storms.
7. Use Seasonal Guidance at the Right Scale
The seasonal outlook is useful for understanding a broad shift in the odds. It can provide context for water planning, seasonal expectations or a classroom comparison between climate patterns and weather. It cannot specify the weather on a travel date, guarantee a ski holiday, or replace warnings.
For an approaching event, use the National Weather Service forecast for the actual location and time. Check weather.gov for local forecasts and warnings rather than inferring a storm threat from a three-month color band.
When the next seasonal outlook is issued, compare like with like: the same variable, valid season and reference climate. A change from a November–January panel to a December–February panel is not solely an update in forecast confidence; it also changes the months being predicted.
This edition preserves the October 15 winter maps alongside the November 12 ENSO advisory. Subsequent releases may change the odds. The dated maps remain a record of that forecast, not a continuously updating feed.
Frequently Asked Questions
Does a warmer winter eliminate the risk of freezing weather?
No. A seasonal average can be above normal even when individual days or weeks are very cold. Use local forecasts and warnings for freezing conditions.
Can I use the color to estimate my heating bill?
Not directly. A favored seasonal category does not specify the temperature departure, daily pattern, energy price or building demand needed for that calculation.
Why does a new El Niño advisory not produce a new winter map immediately?
They are separate forecast products with their own release schedules. Read the date on each product rather than assuming they were issued together.
What Did We Learn Today?
The most useful winter map is a dated probability map read at the right scale. Temperature and precipitation describe different seasonal outcomes; equal chances differs from near normal; and El Niño influences the odds without determining every storm. Keep the Pacific advisory, U.S. seasonal outlook and local weather forecast separate.
Sources & Data Notes
ENSO status uses the November 12, 2026 CPC discussion. Forecast maps use CPC’s October 15, 2026 DJF 2026–2027 GIS layers, with the 1991–2020 reference climate. GeographyPin redrew the published polygons without estimating new probabilities. The map extent is the contiguous United States. City coordinates come from Natural Earth and identify representative points, not observation stations. The GIS stores the lower boundary of a probability band; labels show the corresponding map interval. Forecast polygons are not local weather boundaries. NOAA data and Natural Earth basemaps do not imply endorsement of this article.