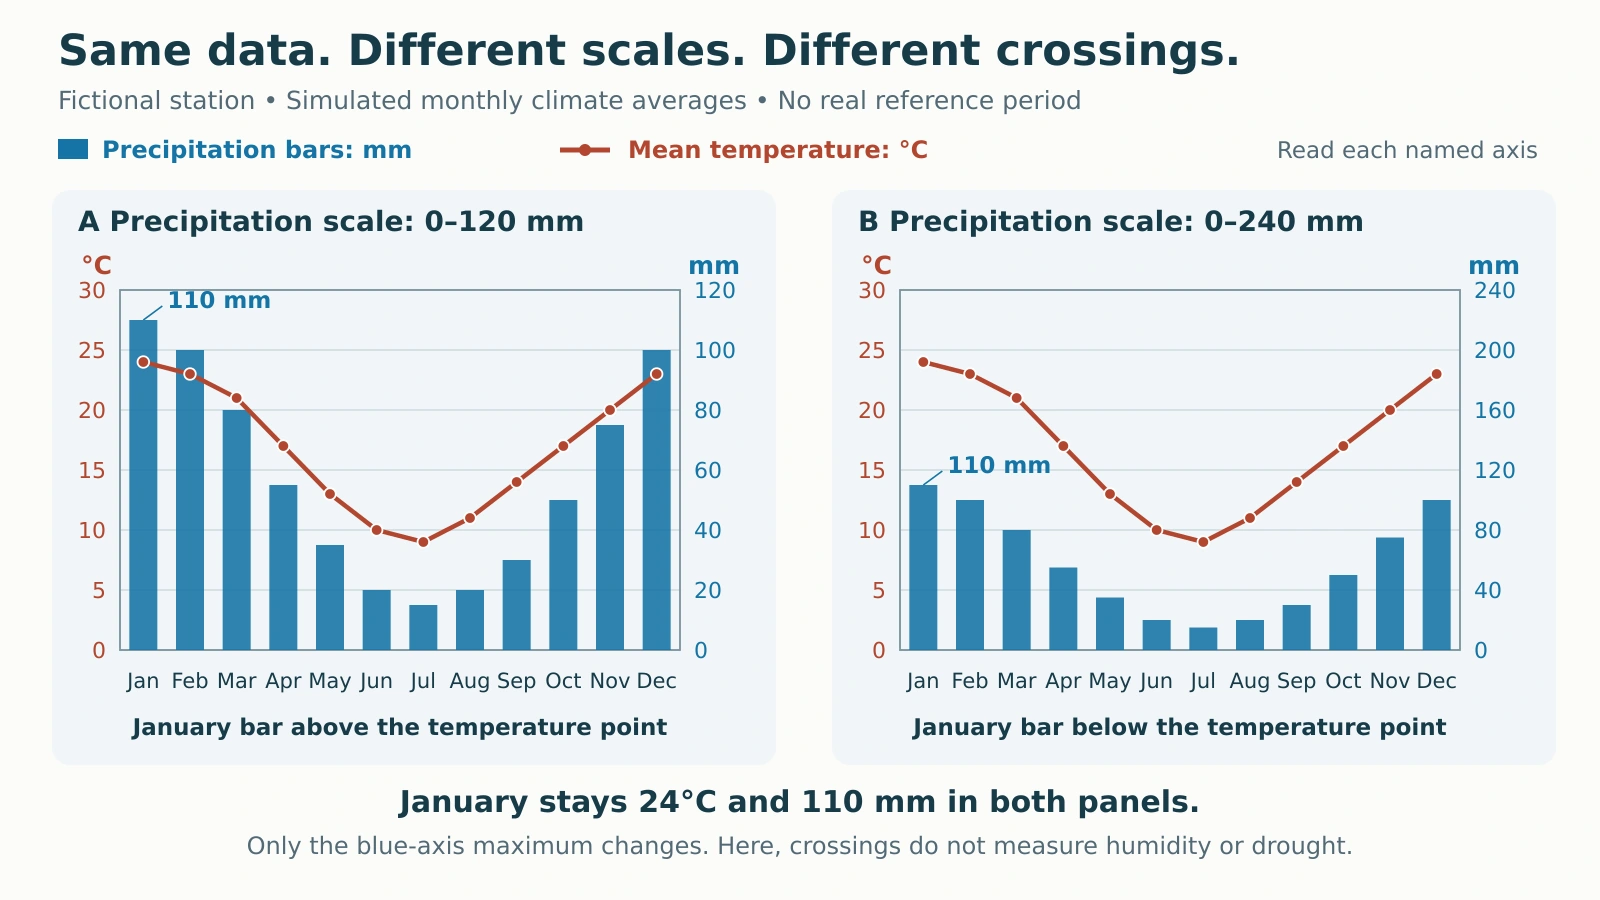
A climograph puts monthly temperature and precipitation on one chart, but their heights use different scales. Reading those scales correctly matters more than whether a rainfall bar rises above the temperature line. A worked example makes that trap visible by plotting the same data twice.
To read a climograph, identify the months, temperature line, precipitation bars and their separate labeled axes. Read each value on its own scale, then compare the seasonal pattern. Add monthly precipitation totals to obtain the annual amount; average monthly temperatures using the stated convention. Bar–line crossings alone do not identify wet or dry conditions.
How to use this article: You can read one month, test the axis-scale trap, or check the annual mean.
Check What the Graph Measures
A climograph, or climate graph, commonly pairs monthly mean air temperature with monthly precipitation. The UCAR/GLOBE climograph lesson shows precipitation bars and a temperature line, while noting that some versions use separate average-high and average-low temperature lines. Read the legend rather than assuming every red line means the same statistic.
Check the location, reference period, units and month order. Temperature and precipitation axes can appear on either side. A chart may summarize one observed year or long-term monthly averages. NOAA’s U.S. Climate Normals use a standard 30-year period; the example below is entirely fictional, with no claimed observation period.
A normal January precipitation total is an average of January accumulations across the reference years, not all those Januaries added together. Precipitation depth represents water, including the liquid equivalent of snow; it is neither snow depth nor a count of rainy days. The wider distinction between weather and climate explains why a seasonal average is not tomorrow’s forecast.
Read the Fictional Station Month by Month
Both panels contain identical invented monthly averages. Scientific chart axes stay in degrees Celsius and millimeters so the scale comparison is easy to reproduce. The table and prose give U.S. units first, with metric equivalents; the plotted metric inputs are exact teaching values.

Follow one month to each named axis
Find January, move up to its temperature point, then read the temperature axis. The result is 75.2°F (24°C). Read January’s bar against the precipitation axis: 4.33 inches (110 mm). July gives 48.2°F (9°C) and 0.59 inch (15 mm).
When a point falls between grid lines, estimate only as precisely as the graph allows. Use a data table for exact calculations. Here, January is both the warmest and wettest month; July is both the coldest and driest.
| Month | Mean temperature, °F (°C) | Mean monthly precipitation total, inches (mm) |
|---|---|---|
| January | 75.2 (24) | 4.33 (110) |
| February | 73.4 (23) | 3.94 (100) |
| March | 69.8 (21) | 3.15 (80) |
| April | 62.6 (17) | 2.17 (55) |
| May | 55.4 (13) | 1.38 (35) |
| June | 50.0 (10) | 0.79 (20) |
| July | 48.2 (9) | 0.59 (15) |
| August | 51.8 (11) | 0.79 (20) |
| September | 57.2 (14) | 1.18 (30) |
| October | 62.6 (17) | 1.97 (50) |
| November | 68.0 (20) | 2.95 (75) |
| December | 73.4 (23) | 3.94 (100) |
Why a Bar Crossing the Line Can Mislead
Change the scale without changing the climate
In panel A, the precipitation axis reaches 120 mm. January’s 110 mm bar fills about 92% of the plot height. Its 24°C temperature point reaches 80% of the fixed 0–30°C scale, so the bar rises above the point.
In panel B, the precipitation axis reaches 240 mm. That same bar now fills about 46% of the plot height, while the temperature point stays at 80%. The bar falls below the point even though neither measurement has changed.
The axes measure different quantities. A visual intersection does not mean precipitation equals temperature, and its position cannot establish humidity, drought or a water surplus. Specialized climate diagrams may use a prescribed relationship between their scales; their interpretation rules must be stated and cannot be transferred to these independently scaled charts.
Before comparing two locations visually, compare their axis ranges. A taller bar on one chart can represent less precipitation than a shorter bar on another. Reading the labeled number prevents that mistake.
Calculate Annual Summaries with the Right Operation
Annual precipitation: add all twelve monthly amounts. The fictional values total 27.17 inches (690 mm). Dividing that sum by twelve produces 2.26 inches (57.5 mm), the average monthly amount, not annual precipitation.
Subtract the coldest monthly mean from the warmest
The annual range of monthly mean temperature is 75.2 − 48.2 = 27°F, or 24 − 9 = 15°C. This is not the year’s highest individual temperature minus its lowest. Monthly averages conceal daily extremes.
For a temperature difference, multiply Celsius degrees by 1.8 to obtain Fahrenheit degrees. Do not add 32. That offset belongs to converting an actual temperature, not a range.
State how the annual temperature average is calculated
For this exercise, give each monthly mean equal weight: 202 ÷ 12 = 16.833…°C, giving 62.3°F (16.8°C) after rounding. The sum of 202 is an intermediate calculation, not an “annual total temperature.”
Equal-month averaging differs from weighting months by their number of days. Leap years can also matter when daily observations are involved. Real climate products need their provider’s method and published annual statistic. For example, the Australian Bureau of Meteorology’s temperature-map documentation explicitly averages monthly grids for multi-month maps; that is a declared product convention, not a universal formula for every station record.
Describe Seasonal Timing Without Guessing a Location
The temperature peak falls around December–February. That is consistent with a Southern Hemisphere location, where the seasons run opposite to those in the Northern Hemisphere, as NASA’s seasons explanation describes. Timing alone does not prove the country, latitude or hemisphere; weak or complex near-equatorial cycles need more context.
Assume a Southern Hemisphere location for this exercise. December–February receives 12.20 inches (310 mm), compared with 2.17 inches (55 mm) in June–August. A defensible summary is “warmer, wetter summers and cooler, drier winters.” That describes relative seasonality without assigning a formal climate class or diagnosing drought.
Month order also matters: December and January are adjacent in the seasonal cycle, although they occupy opposite ends of this January-to-December chart. GeographyPin’s tundra–taiga comparison illustrates how climate graphs can support a different task, comparing biomes.
Keep the Conclusion Within the Data
A monthly climograph cannot show which days were wet, how hard an individual storm rained or how often temperatures crossed a threshold. Two months can have the same precipitation total but very different daily distributions. A missing value is unknown, not zero.
A seasonal curve is also not a climate-change trend. It moves through months, not successive years. To compare climate periods, use comparable stations, variables, methods and reference periods, with appropriate records beyond this twelve-point illustration.
Before writing an answer, check four things: the statistic, its own axis, the units and the time period. Then report the numerical result before interpreting the pattern. That keeps a display choice from becoming a false climate conclusion.
What Did We Learn Today?
The fictional station keeps the same climate statistics when its precipitation axis changes. Read each series against its own units, sum precipitation, and distinguish a range from an average temperature. Describe seasonal timing cautiously. Neither a bar–line crossing nor twelve monthly averages can reveal humidity, individual storms or a long-term trend.
Sources & Data Notes
All monthly inputs and both chart panels are original fictional teaching material, not measurements for a real place. Calculations use exact metric inputs, 25.4 mm per inch, and the stated equal-month temperature convention; displayed U.S. values are rounded. The displayed table contains every plotted monthly value. Source charts were consulted for reading conventions, not copied or used as datasets.