A wet Black Sea coast and a much drier eastern city can appear in the same climate category. That is not necessarily a map error: climate classifications describe combinations of temperature and precipitation, not just how much rain falls. This map concerns Georgia the country in the Caucasus, not the U.S. state.
Western Georgia receives moist maritime air from the Black Sea, while inland distance and mountain barriers help make the east drier. Elevation adds another contrast: highland and mountain climates are colder than nearby lowlands. The map shows long-term climate classes, not rainfall totals, forecasts or sharp boundaries on the ground.
Read the map first: Use the climate-color key, compare the three station settings, or check what the mountain evidence cannot tell us.
1. Read Georgia’s climate map

Climate-color key
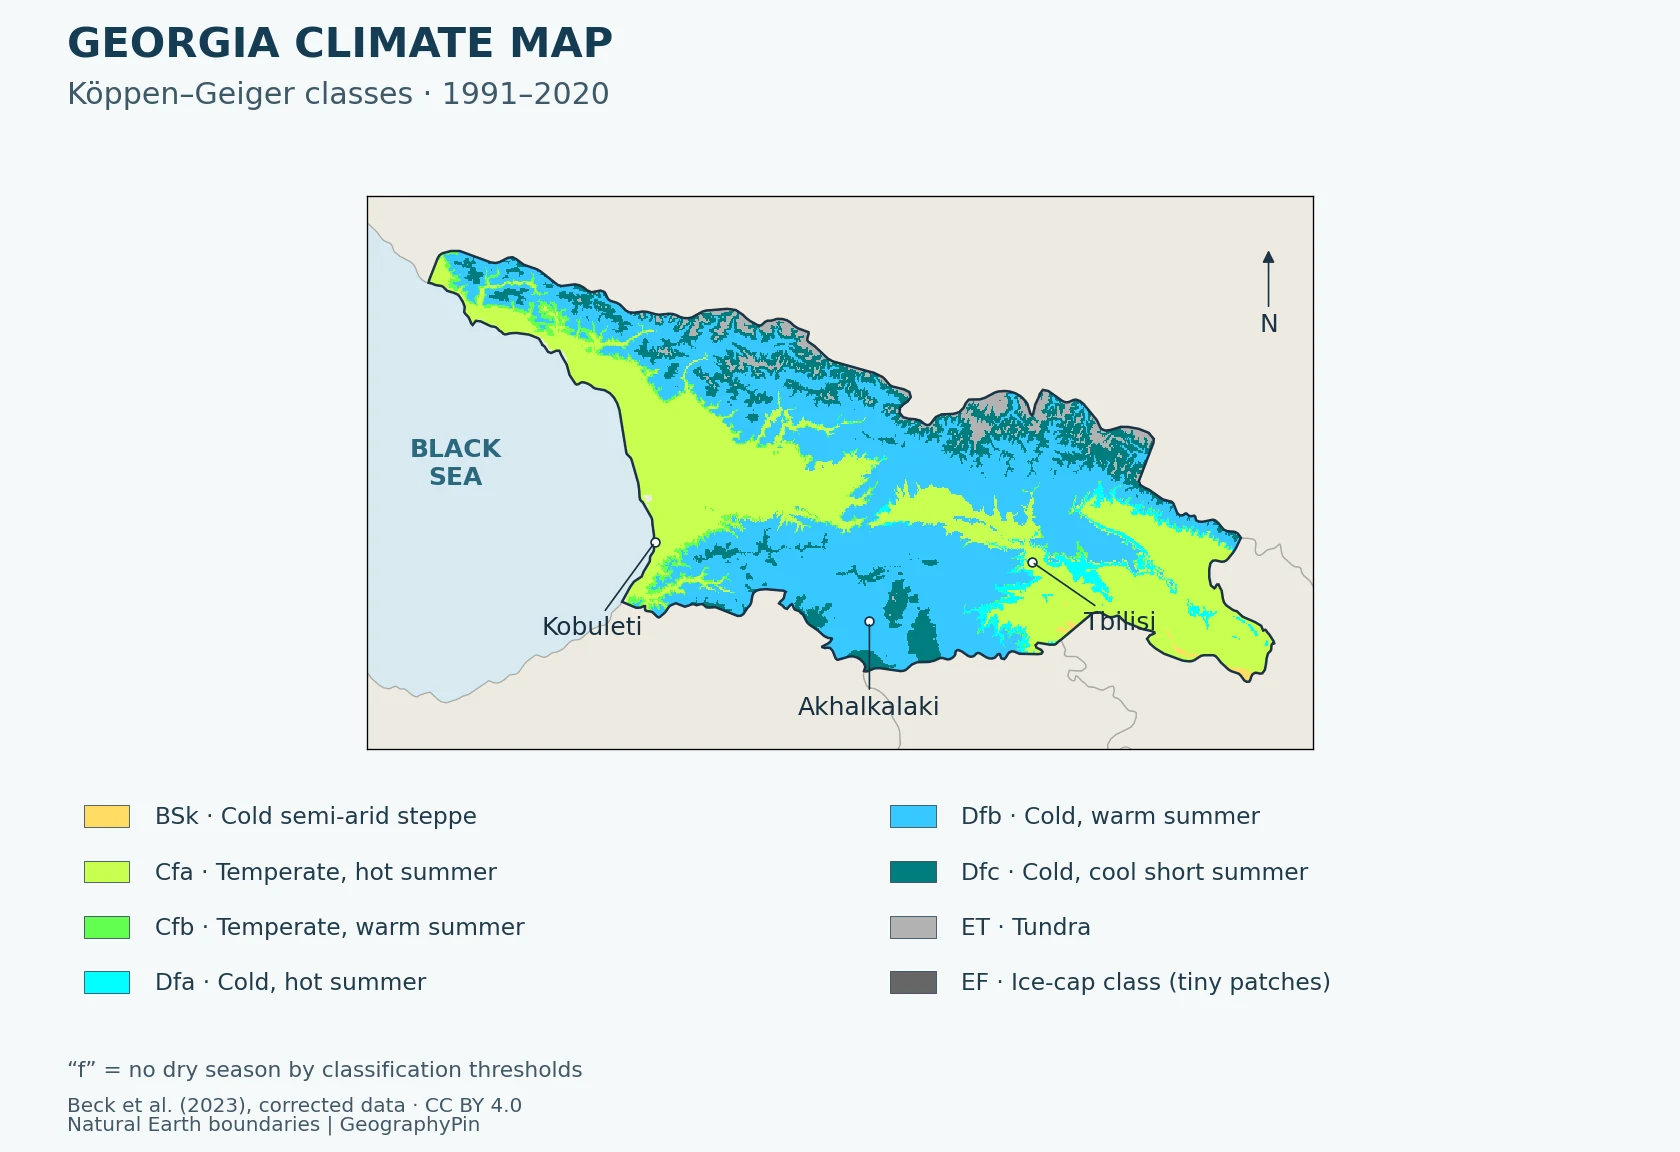
- BSk: Cold semi-arid steppe
- Cfa: Temperate; no dry season; hot summer
- Cfb: Temperate; no dry season; warm summer
- Dfa: Cold; no dry season; hot summer
- Dfb: Cold; no dry season; warm summer
- Dfc: Cold; no dry season; cold summer
- ET: Tundra
- EF: Frost/ice-cap class; only tiny patches in this crop
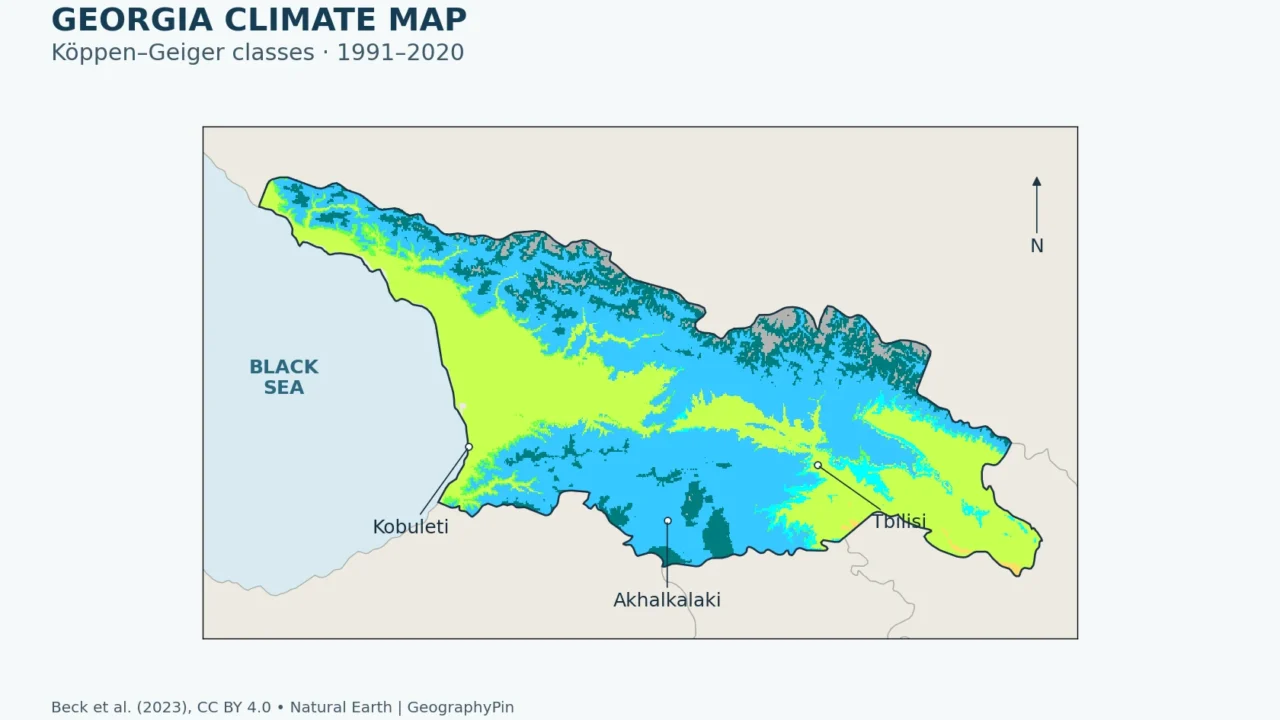
The greener temperate areas occupy much of the lower western country and parts of the eastern lowlands. Blue and darker teal classes spread across uplands; gray tundra patches follow the higher northern mountain country. Small yellow steppe areas occur toward the southeast. These patterns come from the raster, not from hand-drawn regional boundaries.
Read the letters as classification labels. “No dry season” means the seasonal rainfall pattern does not meet the scheme’s dry-season thresholds; it does not mean rain falls every day, that drought is impossible, or that all places of that color are equally wet. A colder class is not automatically wetter than a warmer class.
The outline uses Georgia’s internationally recognized borders, including Abkhazia and South Ossetia. It does not depict present-day administrative control. The base geography is generalized, so tiny edge pixels should not be used to settle a local boundary question. For wider orientation, see the Georgia country guide.
2. Why the coast and interior differ
Black Sea moisture meets mountain terrain
The World Bank–Asian Development Bank climate profile identifies distance from the Black Sea and altitude as central controls on Georgia’s climate. The western coast has a strong maritime influence. Farther inland, that influence weakens, while mountains affect the movement of moist air. The Likhi Range helps separate the broad western and eastern climatic settings.
As moist air rises over terrain, it can cool and produce precipitation. After losing moisture on one side of a range, air reaching sheltered areas can be drier. This rain-shadow mechanism helps explain the contrast, but it is not a single straight dividing line: the arrangement of valleys, ridges and incoming weather systems matters. Nor should every west-facing slope be assigned a precise rainfall amount without observations.
The coast-to-interior change also has a temperature dimension. Maritime moderation and inland conditions produce different seasonal patterns, while increasing elevation generally brings colder conditions. These controls act together. “West versus east” is useful orientation, but it cannot replace distinctions between lowlands, enclosed valleys, plateaus and high mountains.
The map’s categories should therefore be read alongside precipitation data. A large difference in rainfall can occur without a change in climate code. Conversely, a temperature threshold can move a place into a colder category even when its annual precipitation is not especially high. A colored climate map is a summary of several variables, not a substitute for looking at those variables separately.
3. Compare coast, eastern city and southern highland
Three settings, one reference period
The following comparison uses Georgia’s station submissions to the WMO, archived by NOAA NCEI, for 1991–2020. Kobuleti represents a low coastal site; Tbilisi an eastern urban setting; Akhalkalaki a southern highland plateau. These are individual stations, not averages for entire regions. Kobuleti appears as “Qobuleti” and Akhalkalaki as “Akhalkhalakhi” in the source filenames.
| Station | Station height | Annual precipitation | January average daily low | August average daily high |
|---|---|---|---|---|
| Kobuleti | 16 ft (5 m) | 99.3 in (2,521.4 mm) | 36.7°F (2.6°C) | 82.9°F (28.3°C) |
| Tbilisi | 1,417 ft (432 m) | 20.1 in (511.5 mm) | 31.3°F (−0.4°C) | 89.4°F (31.9°C) |
| Akhalkalaki | 5,653 ft (1,723 m) | 22.2 in (563.0 mm) | 11.5°F (−11.4°C) | 77.4°F (25.2°C) |
Kobuleti’s annual precipitation normal is about 4.9 times Tbilisi’s. That is a comparison between these two stations, not a ratio that applies to all western and eastern Georgia. Akhalkalaki is much higher and colder, but its annual precipitation normal is far below the coastal station’s. Height alone does not explain the rainfall pattern.
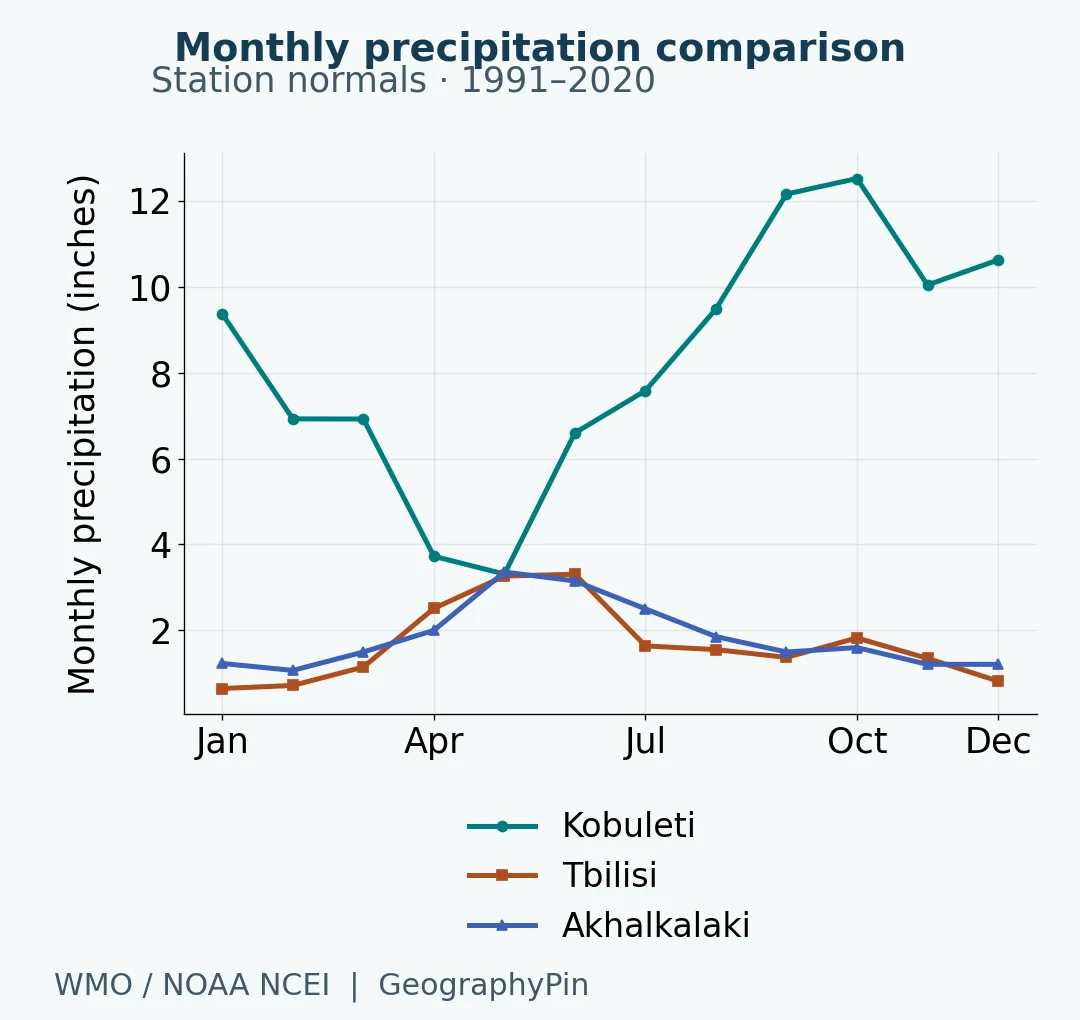
Seasonality matters as well as the annual total. Kobuleti’s wet autumn is not simply a scaled-up version of Tbilisi’s monthly pattern. Comparing the curves avoids treating “wet west” and “dry east” as if their rainfall were distributed identically through the year.
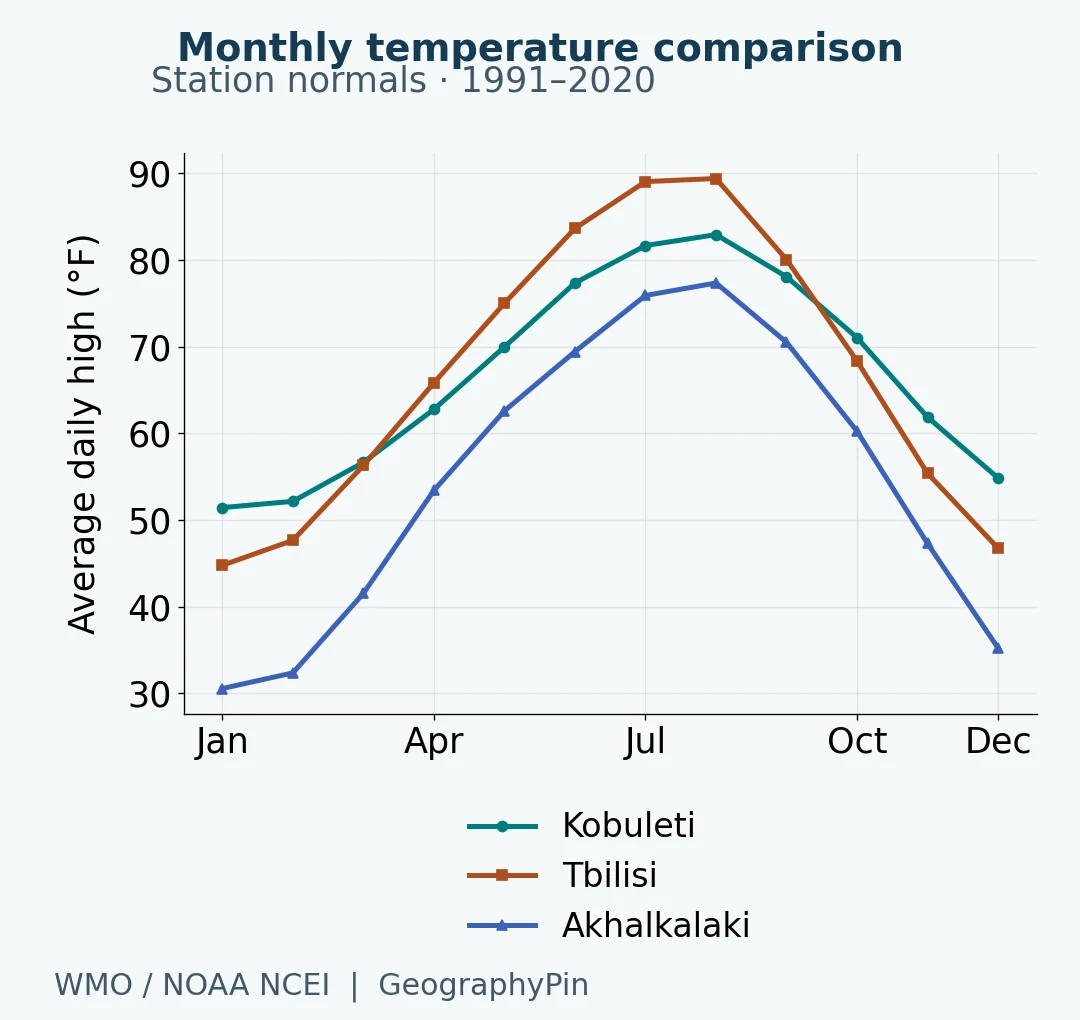
Tbilisi’s August average daily high exceeds the coastal station’s, while Akhalkalaki’s January average daily low is substantially lower than either. A person moving from coast to plateau crosses a meaningful thermal contrast even without reaching an alpine summit. The values also explain why describing the entire country with one temperature or one seasonal label is unhelpful.
Monthly source values have 29–30 contributing years, depending on station, month and variable. All selected months have reported values; no gaps were filled. The temperature chart deliberately uses average daily maxima because matching mean-temperature series are not supplied for all three stations. For a more detailed month-by-month low/high comparison including Borjomi, see Georgia weather by month.
4. What the map and charts cannot tell you
A plateau station is not a high-alpine station
Akhalkalaki adds a genuine high-elevation comparison, but it is a southern plateau site, not a substitute for the Greater Caucasus or a glacier. The 21-station Georgian WMO submission used here does not provide a matching high-alpine series. We therefore do not attach its numbers to Kazbegi, Gudauri, a summit or every mountain valley.
The gridded map still covers mountain terrain, but its class at a location is a dataset estimate assembled from climate inputs, not proof that a weather station operated in every cell. It has a nominal resolution of about 0.6 mile (1 kilometer). Narrow valleys, steep slopes and local exposure can vary within that scale. Finer-looking pixels do not remove the uncertainty of the underlying climate data.
A historical classification is not a forecast
The map uses the historical 1991–2020 layer, not one of the dataset’s future scenarios. The source also contains other periods and projections; they have not been mixed into this view. Comparing this map with a different-period map would require a consistent method before claiming that a local climate zone has changed.
The stations and the map share a reference period, but they are separate evidence products. Station normals are observations summarized at named locations. The raster assigns climate classes across space. The station values were not read from the colored map, and three stations cannot independently validate every pixel.
Only two pixels in this particular clipped raster carry the EF frost/ice-cap class. They are retained rather than enlarged into a persuasive-looking zone. Their presence should not be treated as a measured glacier outline, a complete inventory of permanent ice, or proof of a sharply defined local boundary. Climate categories, land cover and glacier extent are different things.
Frequently Asked Questions
Can I use this map to choose a planting site?
It is useful for broad climate context, not a planting guarantee. A climate class does not specify frost pockets, soil, irrigation, slope exposure or the extremes a particular crop can tolerate. Local station records and site-specific advice are needed for that decision.
Does a small steppe-colored patch mean there is a desert there?
No. BSk is the source’s cold semi-arid steppe class, not its desert class. The distinction is part of the classification; the yellow patches should not be relabeled as deserts.
Can these charts tell me whether it will rain next week?
No. They summarize a historical 30-year reference period. Use a current forecast for a particular week, and remember that an individual month can differ substantially from its long-term normal.
What Did We Learn Today?
Georgia’s climate is easier to understand when three questions stay separate: where moisture comes from, how terrain and elevation modify conditions, and what a classification actually measures. The national map supplies the spatial pattern; the station comparisons show why the same color need not mean the same rainfall, and why a highland station cannot stand in for every mountain.
Sources & Data Notes
Map: Beck et al. (2023), historical 1991–2020 Köppen–Geiger raster from the corrected January 2026 release. The original class values were clipped to generalized Natural Earth country geometry and displayed without inventing boundaries or interpolating categories. The source palette is retained. Nominal resolution is approximately 0.6 mile (1 kilometer); class edges are not surveyed boundaries. Natural Earth’s Georgia outline is used as an internationally recognized-border convention, not a statement of control.
Stations: Georgia-submitted WMO 1991–2020 normals, NOAA NCEI archive, parameters 1 Sum (precipitation), 3 Mean (daily maximum) and 4 Mean (daily minimum). Annual precipitation uses the source annual field. Contributing years vary from 29 to 30; no values were imputed. Conversions: °F = °C × 1.8 + 32; inches = millimeters ÷ 25.4; feet = meters ÷ 0.3048. Rounding is for display. These products are not a climate-trend analysis.
- GloH2O: Köppen–Geiger data, historical periods and reuse terms
- Beck and colleagues: corrected dataset, version 2 of the repository record
- Beck et al. (2023): High-resolution Köppen–Geiger maps
- NOAA NCEI: WMO climate normals and methodology
- Kobuleti source station data
- Tbilisi source station data
- Akhalkalaki source station data
- World Bank and ADB (2021): Climate Risk Country Profile, Georgia
- UNDP: Georgia regional climate context
- Natural Earth: public-domain basemap terms
Climate map adapted by GeographyPin from Beck et al. (2023), licensed under CC BY 4.0: cropped, masked, relabeled and combined with public-domain Natural Earth boundaries. Climate data authors retain credit; GeographyPin identifies this map composition, not ownership of the underlying dataset. Charts are GeographyPin visualizations of the cited station data.