A lake-effect snow belt map helps explain why one Great Lakes community can be buried in snow while another nearby sees much less. The useful starting point is the relationship between the lakes, the wind and the land downwind, rather than a single line separating snowy places from snow-free ones.
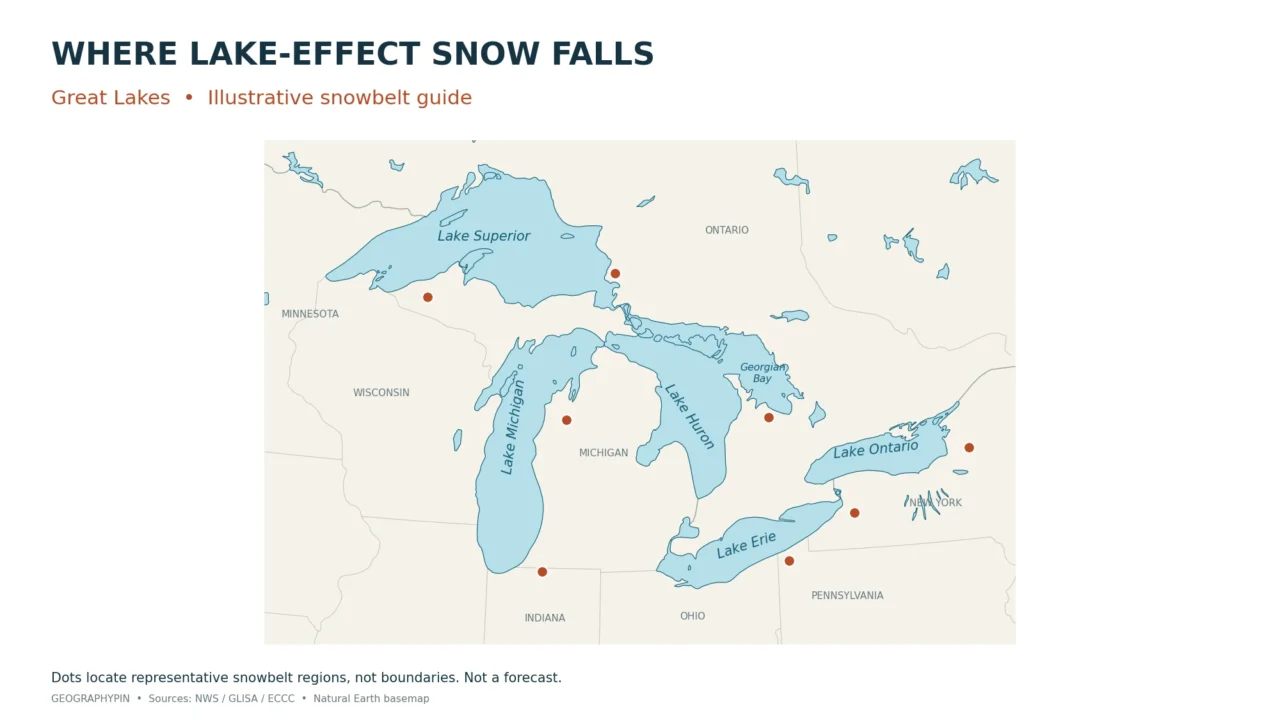
Great Lakes lake-effect snowbelts occur mainly downwind of the lakes, especially along southern and eastern shores and nearby uplands in the United States and Canada. The shaded map shows their approximate distribution, including western Lower Michigan, western New York and parts of Ontario. These are schematic regions, not fixed boundaries; active snow bands shift with the wind.
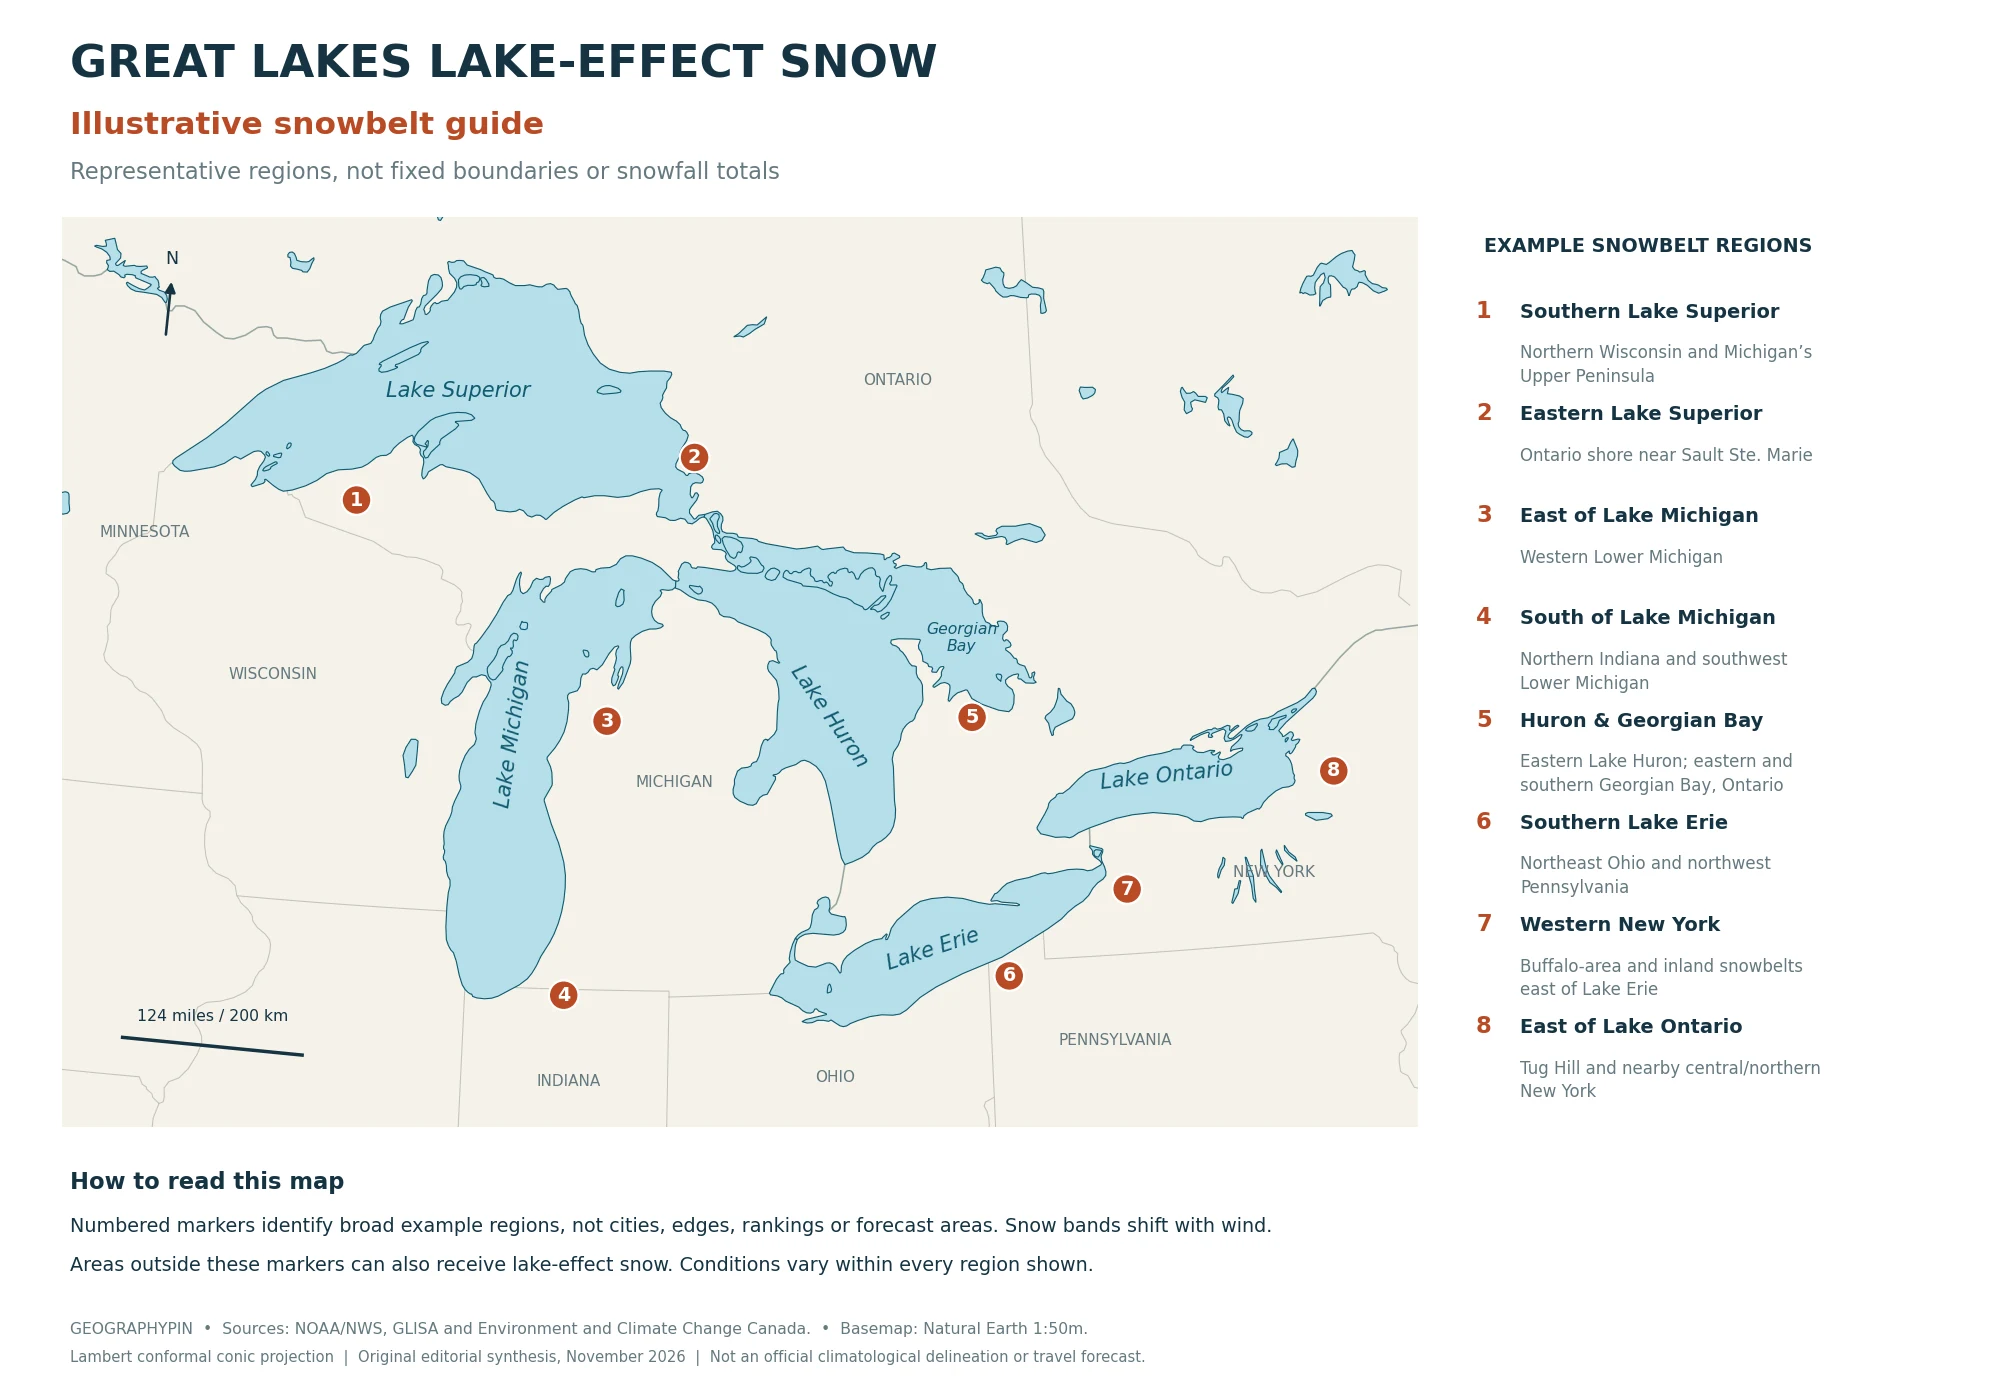
1. Read the Great Lakes Snowbelt Map
A snowbelt is an area repeatedly affected by lake-effect snow. Use the map and its numbered key to find the major recurring regions around the Great Lakes.
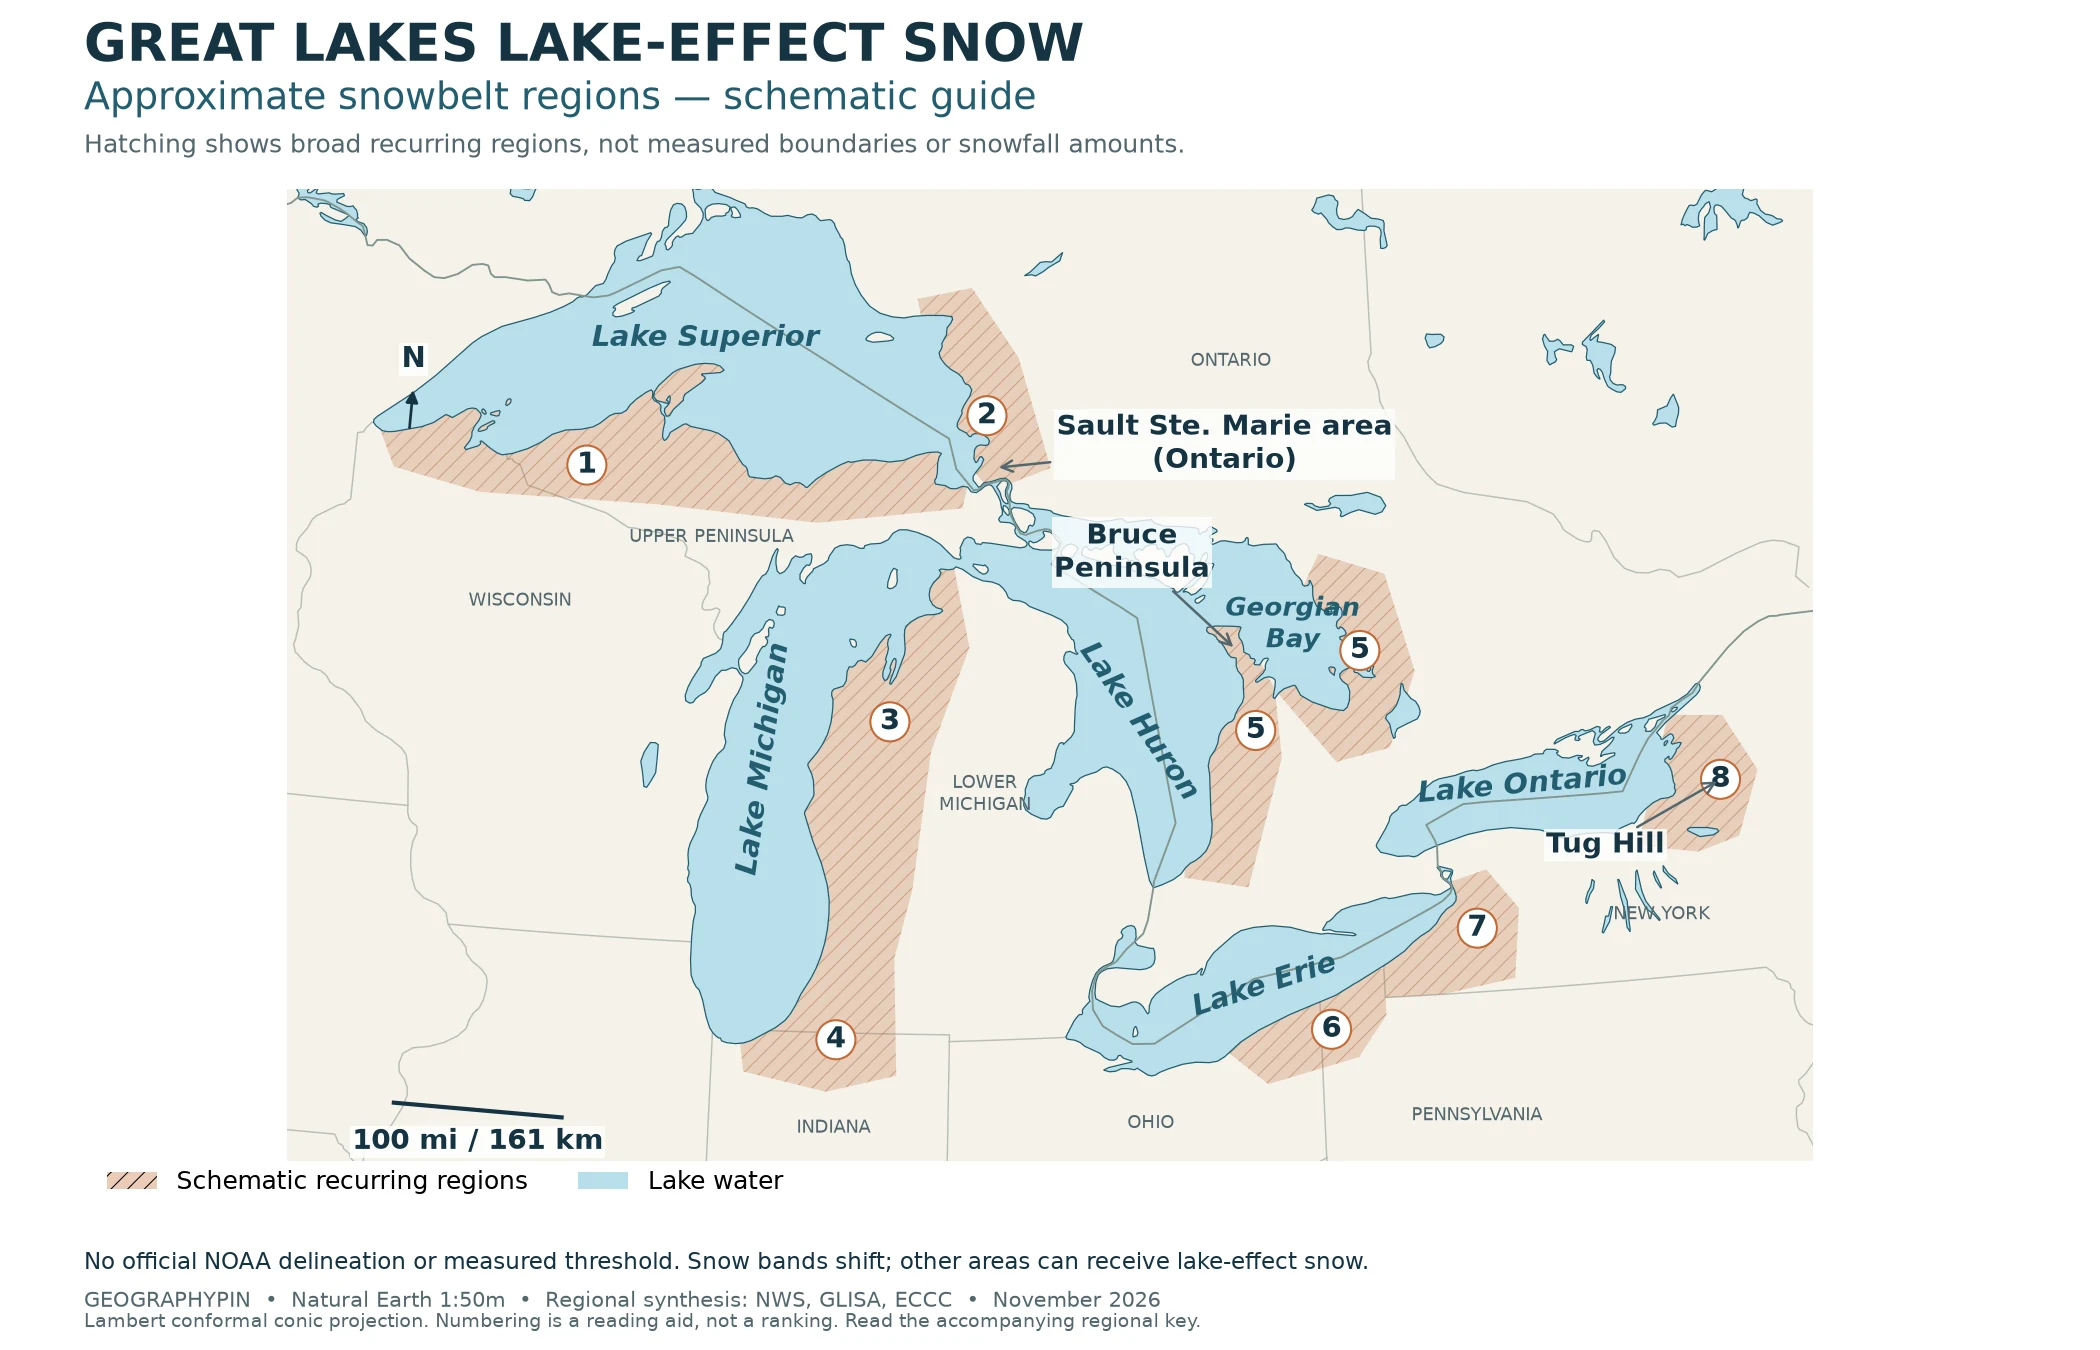
What the numbers mean
- 1. Southern Lake Superior
Northern Wisconsin and Michigan’s Upper Peninsula. - 2. Eastern Lake Superior
Ontario near Sault Ste. Marie and adjacent downwind areas. - 3. Eastern Lake Michigan
Western and northwestern Lower Michigan. - 4. Southern Lake Michigan
Northern Indiana and southwestern Lower Michigan. - 5. Lake Huron and Georgian Bay
Eastern Huron/Bruce Peninsula, plus eastern and southern Georgian Bay. Both #5 areas belong to this group. - 6. Southern and southeastern Lake Erie
Northeastern Ohio and northwestern Pennsylvania. - 7. Eastern Lake Erie
Buffalo-area snowbelts and the western Southern Tier of New York. - 8. Eastern and southeastern Lake Ontario
The Watertown region, Tug Hill and nearby central/northern New York.
To locate a place, first identify its nearest lake and which side of that lake it occupies. Then use the numbered key to find the relevant region. For a particular storm, add the actual wind direction: the shore downwind that day may differ from the familiar regional pattern.
How to use this article: Check the lake-by-lake differences, follow the wind and fetch explanation, or compare what different snow maps measure.
2. Find the Snowbelts Lake by Lake
The lakes share the same basic snow-making process, but their shapes and surrounding terrain create different patterns. Southern and eastern shores feature prominently because common cold-air flows cross the water toward them. Other wind directions can bring lake-effect snow to other shores.
Why the regional examples differ
Superior and Michigan: Northern Wisconsin and the Upper Peninsula lie south of Superior, while western Lower Michigan, including the Grand Rapids and Traverse City regions, lies east of Lake Michigan. These orientations matter more than a state label. A northerly flow over Superior and a westerly flow over Michigan can each carry lake moisture toward different snowbelt shores.
Huron and Georgian Bay: Canadian coverage is essential to the map. Environment and Climate Change Canada identifies snowbelt areas east of Superior and Huron and east and south of Georgian Bay. The eastern Lake Huron shore and the eastern/southern shores of Georgian Bay are different downwind settings, even though Georgian Bay is part of Lake Huron. Which one receives a band depends on the wind and other weather conditions.
Erie and Ontario: Erie’s affected regions extend from northeastern Ohio through northwestern Pennsylvania into western New York, including inland uplands as well as lakeshore areas. Farther east, Lake Ontario supplies moisture to snow bands reaching New York’s Tug Hill Plateau. Research by Veals and Steenburgh documents the distribution and variability of lake-effect precipitation east of Lake Ontario and over Tug Hill. Distance from the shoreline alone therefore cannot explain the local pattern.
A localized extreme: Environment and Climate Change Canada reports that the November 17–21, 2014 lake-effect event brought up to 88 inches (223 centimeters) of snow near Buffalo. That is a reported local event total, not a Buffalo-wide measurement or an annual average. A narrow band can produce sharply different totals across a metropolitan area.
3. Why Wind, Water and Terrain Move the Snow
According to the National Weather Service’s lake-effect snow explanation, cold air moving across relatively warmer open water gains heat and moisture. The air rises, clouds develop, and snow can fall in narrow bands downwind. Strong differences over short distances are part of this process, not a contradiction of the regional map.
Lake-effect snow is common in late fall and winter, when cold air can cross lake water that remains relatively warm. Season alone does not determine an event: the air-water contrast, available moisture, wind and ice cover still have to be considered together.
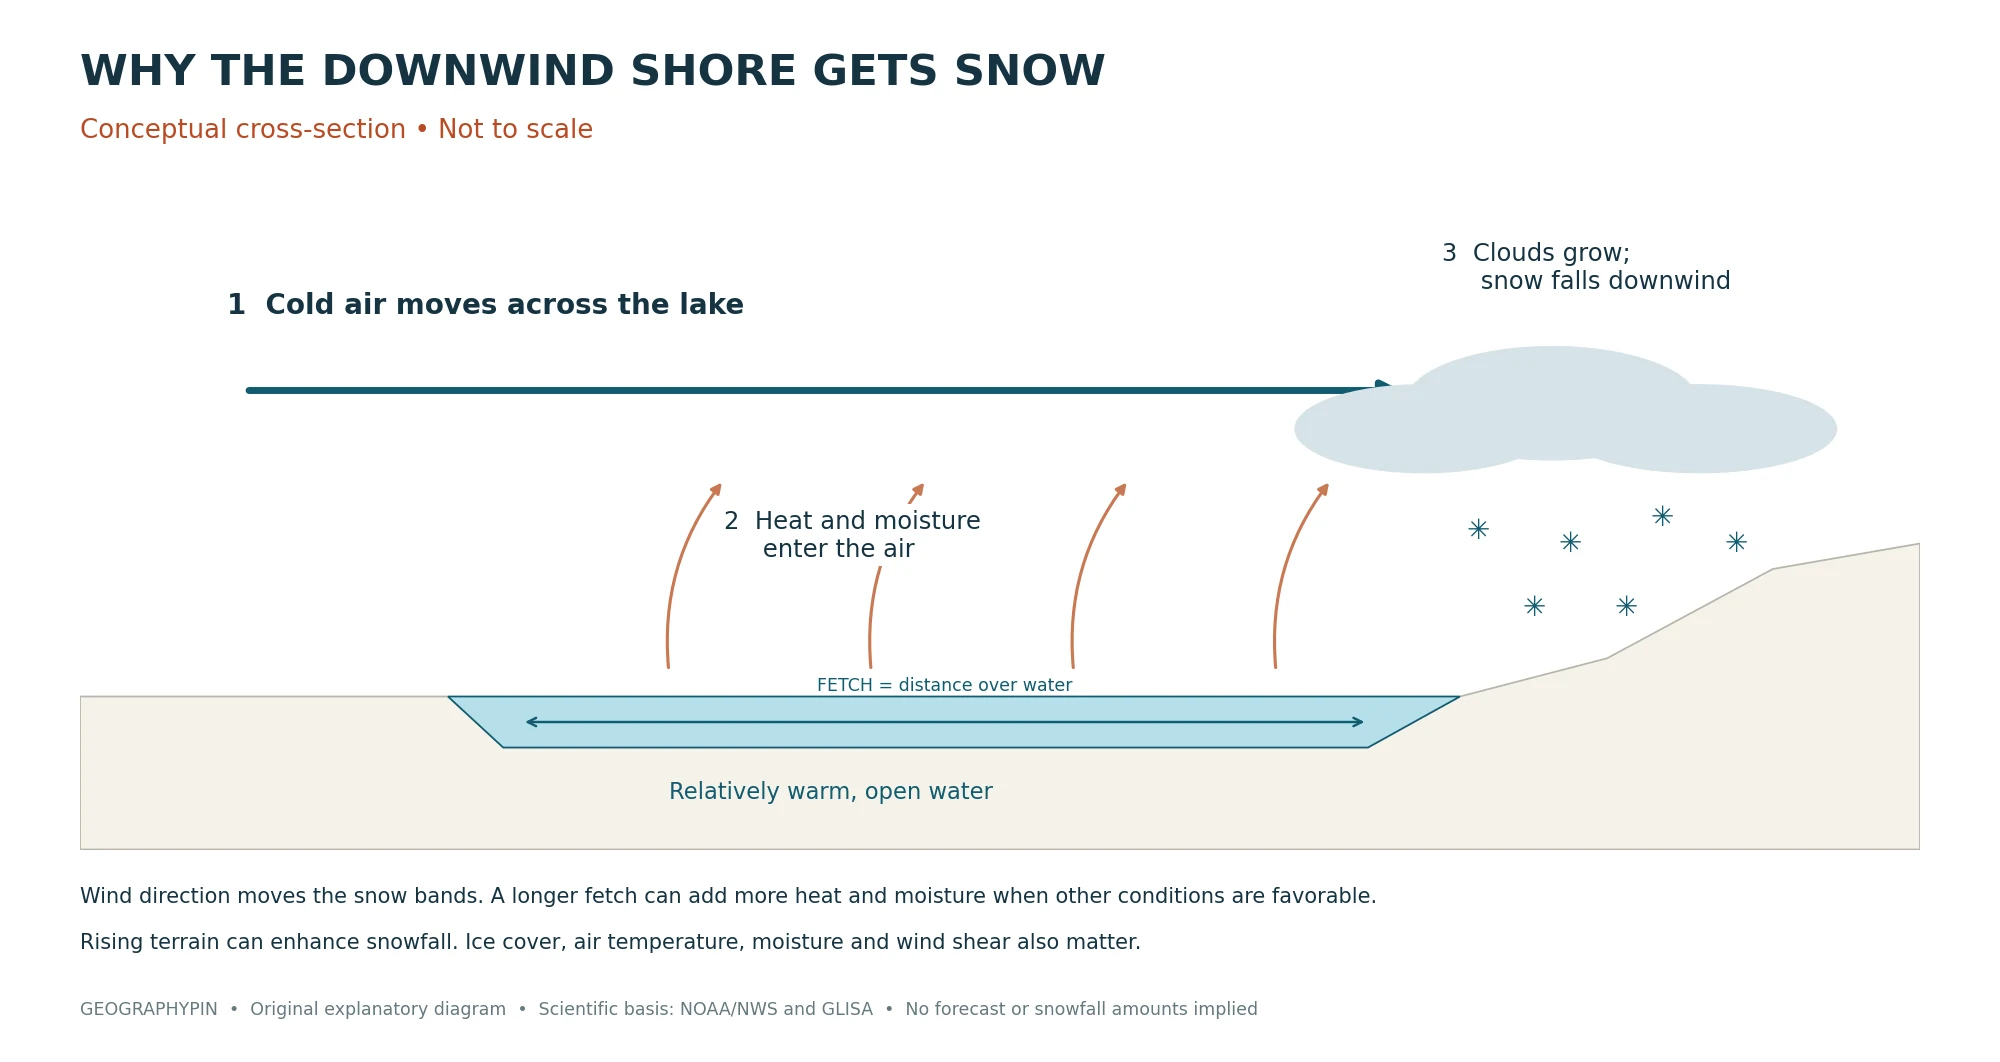
Wind direction and fetch
Fetch is the distance air travels over lake water. A longer open-water path generally gives the air more opportunity to gain heat and moisture, although other atmospheric conditions still matter. The National Weather Service’s Grand Rapids office emphasizes wind direction because it changes both fetch and where the snow reaches land.
Wind names describe where air comes from. A west wind blows toward the east; a north wind blows toward the south. On a map, follow the arrow toward the downwind shore rather than assuming that “west wind” means snow on the western shore.
For example, westerly flow across Lake Michigan can carry lake-effect snow into western Lower Michigan. A more northerly path can favor areas near the southern end of the lake. A shift in direction can move a narrow band away from one community and toward another without changing the underlying regional snowbelt.
Terrain, connected lakes and ice cover
When moist air encounters rising land, it can be lifted further and produce more precipitation. Tug Hill is a well-studied example, but the surrounding weather still determines where an individual band forms and how long it persists. A snowbelt should not be reduced to either “nearest shoreline” or “highest ground.”
Some events also involve more than one lake. The National Weather Service has documented bands connecting Lake Huron and Lake Ontario. Upstream moisture and favorable winds can help extend snow inland, so there is no single distance from the water that defines every snowbelt’s outer limit.
Ice cover restricts the exchange of heat and moisture with the air. Open water can support that exchange, but it does not guarantee heavy snow: sufficiently cold air and a favorable atmospheric setup are also needed. GLISA’s review of Great Lakes snow explains how ice cover and warming affect these processes. A mild, ice-poor winter cannot simply be translated into “more lake-effect snow everywhere.”
4. Snowbelt Maps and Snowfall Totals Answer Different Questions
Choose the map that answers your question
Choose a map according to what it actually measures or represents:
- Schematic snowbelt distribution: the approximate location of recurring lake-effect regions, as shown here.
- Total snowfall: snow accumulated during a stated event, season or averaging period, including lake-effect snow and snow from larger weather systems.
- Snow depth: snow lying on the ground at a particular time. Melting and settling mean it differs from the total that fell.
- Lake-effect contribution: snowfall attributed to lake-effect processes using a defined research method.
- Future climate projection: a modeled outcome under stated assumptions for a future period, not a measurement of present-day snowbelt boundaries.
Research on snowstorm types in central New York illustrates why attribution needs care: contributions vary across places and seasons, and studies must define which events belong to which category. Lake-enhanced snow adds another complication. A lake can strengthen precipitation within an existing weather system, rather than producing a separate, isolated band.
For a long-term comparison between towns, use snowfall records with a consistent observation period and measurement method. For tomorrow’s conditions, use a forecast. The distinction is the same one explained in weather versus climate: a recurring pattern describes what is typical, not precisely what happens on a particular day.
A static snowbelt map is useful for understanding regional geography, but it should never substitute for current local forecasts and warnings when planning travel.
Frequently Asked Questions
Can the western shore of a Great Lake receive lake-effect snow?
Yes. For example, the National Weather Service’s Green Bay office describes lake-effect snow reaching Wisconsin’s Lake Michigan shore with cold east or northeast winds. The usual eastern-shore pattern is a tendency, not a rule excluding other shores.
Does lake-effect snow occur outside the Great Lakes?
Yes. The National Weather Service also identifies Utah’s Great Salt Lake as a setting for lake-effect snow. This map is limited to representative Great Lakes regions, rather than every lake capable of producing the process.
What Did We Learn Today?
Reading a lake-effect snowbelt map starts with the water, then follows the wind toward land. Lake orientation, open-water fetch and rising terrain help explain the recurring regions, while shifting winds explain why individual snow bands do not respect a fixed boundary. The most useful comparison keeps representative snowbelt locations, total snowfall and a particular day’s forecast separate.
For a broader check of the concepts behind these regional patterns, try the climatology quiz.
Sources & Data Notes
The shaded map is an original schematic synthesis of broad regional descriptions, not an official NOAA delineation, measured boundary layer or snowfall-normal dataset. Natural Earth 1:50m data supply the generalized basemap; the snowbelt overlay is an editorial illustration, not Natural Earth data. Shading does not encode snowfall intensity, frequency or a uniform inland distance. The companion map’s eight numbers are a reading key, not a ranking. The ECCC 2022 assessment is used for its description of Ontario’s snowbelt locations, not as evidence of measured snowbelt boundaries or future extents. The November 2014 example is an event-specific total; its inch/centimeter pair follows ECCC’s reported rounded figures. The process diagram remains conceptual and not to scale.
- National Weather Service: lake-effect snow formation; Grand Rapids: wind direction and fetch.
- NWS Duluth: Lake Effect Snow Resources; NWS Green Bay: winter precipitation types; NWS Cleveland: 2023–24 snowfall review.
- GLISA: Lake-effect Snow in the Great Lakes Region, used for regional geography, not a comparable snowfall ranking.
- Environment and Climate Change Canada: Great Lakes coastal wetlands climate vulnerability assessment (2022, printed page 11); December 2014 Great Lakes climate bulletin.
- National Weather Service: Lake Effect Snow, Unifying Winter Weather Preparedness for New Yorkers (regional examples on slides 7–10).
- Veals and Steenburgh (2015): lake-effect precipitation east of Lake Ontario and over Tug Hill; NWS Binghamton: upstream lake-effect snow bands.
- Hartnett (2021): seasonal snowfall contributions of different snowstorm types in central New York; NAV CANADA: lake-enhanced precipitation.
- GLISA: Snow in the Great Lakes: Past, Present, and the Future.
- Companion graphic: original numbered locator map.
- Natural Earth: public-domain map data and terms of use.