Two temperature anomaly charts can place the same year on opposite sides of zero without disagreeing about its temperature. The reference mean determines that zero. Four invented years show how to reconcile the charts and avoid a false cooling signal when switching between them.
Changing the baseline shifts the anomaly numbers for an unchanged annual temperature series, sometimes reversing their signs, while preserving every year-to-year temperature difference. With one fixed reference mean for each chart, subtract the difference between those means from every point. Compare years only after putting them on a common reference.
Start with One Series and Two Reference Means
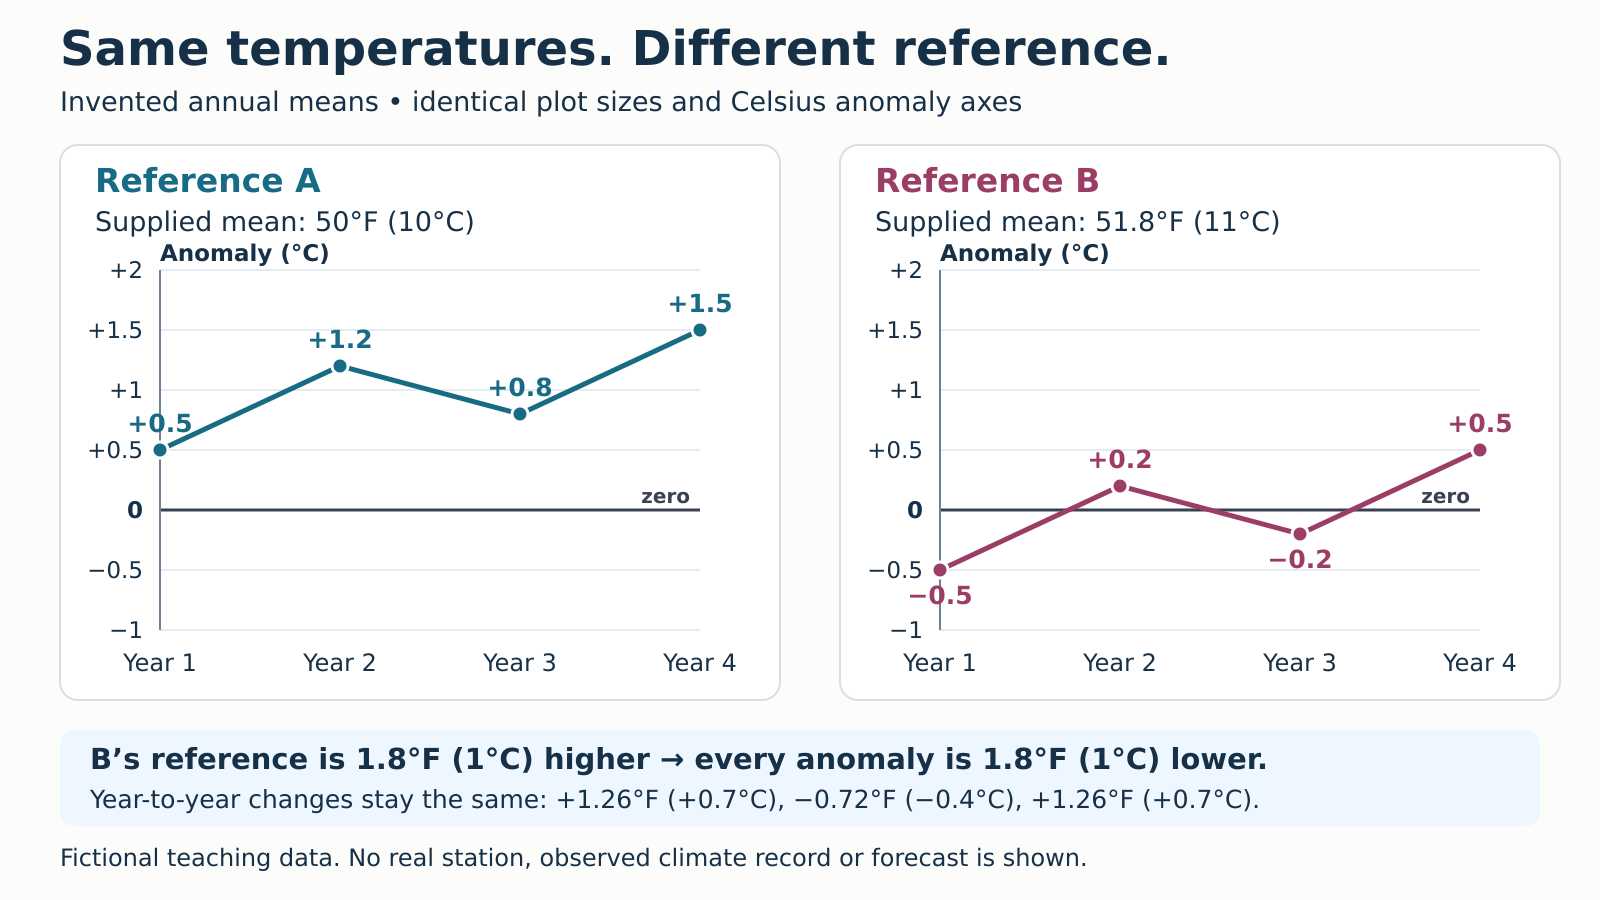
A temperature anomaly is the temperature minus its stated reference mean. Here, the inputs are four invented annual means for one fictional station. The supplied reference-period means are A: 50°F (10°C) and B: 51.8°F (11°C). They are teaching inputs, not official climate normals or averages calculated from the four displayed years.
Keep the annual values fixed and calculate each anomaly twice. For Year 1, subtracting A gives +0.9°F (+0.5°C); subtracting B gives −0.9°F (−0.5°C). Its actual annual mean remains 50.9°F (10.5°C).

| Fictional year | Annual mean, °F (°C) | Anomaly A, °F (°C) | Anomaly B, °F (°C) |
|---|---|---|---|
| Year 1 | 50.9°F (10.5°C) | +0.9°F (+0.5°C) | −0.9°F (−0.5°C) |
| Year 2 | 52.16°F (11.2°C) | +2.16°F (+1.2°C) | +0.36°F (+0.2°C) |
| Year 3 | 51.44°F (10.8°C) | +1.44°F (+0.8°C) | −0.36°F (−0.2°C) |
| Year 4 | 52.7°F (11.5°C) | +2.7°F (+1.5°C) | +0.9°F (+0.5°C) |
The chart retains Celsius axes to show the exact input arithmetic without conversion clutter. U.S. units appear first in the table and prose. For anomalies, multiply Celsius differences by 1.8 to get Fahrenheit differences; do not add 32.
Year 1 sits above zero on A and below zero on B. Its negative anomaly means below B’s reference, not below freezing. Zero anomaly means equality with the reference mean, not an absence of temperature or temperature variation within that year.
Rebase Every Year, Then Check the Changes
Rebasing means expressing the same series relative to a different reference. Use one unit throughout the calculation:
Anomaly B = anomaly A + mean A − mean B.
B’s mean exceeds A’s by 1.8°F (1°C), so subtract 1.8°F (1°C) from every A anomaly. Year 2 moves from +2.16°F (+1.2°C) to +0.36°F (+0.2°C). Year 3 moves from +1.44°F (+0.8°C) to −0.36°F (−0.2°C). Raising the reference lowers all departures by the same amount.
To check the result, compare consecutive years within either panel:
- Year 1 to Year 2: +1.26°F (+0.7°C).
- Year 2 to Year 3: −0.72°F (−0.4°C).
- Year 3 to Year 4: +1.26°F (+0.7°C).
These are also the differences between the actual annual temperatures. The constant reference cancels when one year is subtracted from another. Year 4 remains 1.8°F (1°C) warmer than Year 1 under either reference. NASA’s GISTEMP FAQ explains the same fixed-reference principle: changing the comparison baseline does not alter the temperature change between years.
The line’s vertical position changes, but its rises and falls do not. Both panels deliberately retain the same axis limits and plot dimensions, so a scale change cannot exaggerate or conceal that result. Changing a reference alone cannot erase warming in an unchanged temperature record.
Catch the Mixed-Baseline Splice Error
Suppose a report takes Year 2 from chart A and Year 3 from chart B. Subtracting those displayed anomalies gives:
−0.36°F − (+2.16°F) = −2.52°F, or −0.2°C − (+1.2°C) = −1.4°C.
That appears to be a much larger cooling than the actual change. It combines a real year-to-year fall with an extra downward step caused by switching references.
Put both years on B first. Year 2 becomes +0.36°F (+0.2°C), while Year 3 is −0.36°F (−0.2°C). Their difference is −0.72°F (−0.4°C), matching the annual temperatures. Keeping both years on A gives the same answer.
A practical check is to compare the same overlapping years in both charts. A pure change between two fixed reference means should produce the same offset every time. Varying offsets need further investigation, allowing for published rounding; do not splice the series and treat the join as a temperature event.
Check Whether Real Charts Are Comparable
Before comparing two published anomaly numbers, check six labels:
- Variable: mean air temperature, daily maximum and sea-surface temperature measure different things.
- Place or area: a station, a country and a global estimate have different coverage.
- Averaging interval: match annual with annual, or the same calendar month across years.
- Reference period: identify the comparison years and the appropriate reference mean.
- Units: distinguish an actual temperature from a temperature difference.
- Dataset and version: check observations, processing and coverage, not just the baseline label.
This constant shift applies to a fixed annual series with one fixed scalar mean per reference. Monthly climatologies can change by different amounts in January and July. Use the matching monthly reference; do not assume one offset works across all months. Nor should a series assembled from changing rolling references be interpreted as a fixed-reference record. The broader role of normals is covered in weather versus climate.
Revising observations, coverage, quality control or reconstruction methods can change the series itself. NOAA’s NOAAGlobalTemp documentation describes an upgrade that changes sea-surface inputs as well as the reference period. The HadCRUT5 description distinguishes versions with and without estimates for unobserved areas. Matching baseline years alone does not make products identical.
Real global analyses use spatial methods and area weighting, not a simple average of unequal regions or arbitrary stations. A precisely reported anomaly also cannot supply a precise absolute global temperature when added to an uncertain reference estimate, as NASA’s absolute-temperature explanation shows. Rebasing does not remove uncertainty.
The four invented years establish no climate trend, cause, global record, forecast or conclusion about Paris temperature limits. They demonstrate arithmetic. An anomaly is a temperature departure, not a standardized rarity score or a measure of harm. For the separate evidence behind long-term change, see what climate change means.
What Did We Learn Today?
Read the reference before interpreting zero. Rebase all years consistently, then compare their differences. In the worked example, a sign change comes from a higher reference, while the exaggerated cooling comes from mixing references. Real charts also require matching variables, intervals, coverage and dataset methods before their numbers can be compared safely.
Sources & Data Notes
All four annual temperatures and both reference means are invented exact inputs. Fahrenheit equivalents are exact for these values. The chart changes only the reference mean; it includes no observational dataset. Agency documentation supports the method and its limits, not the fictional numbers.