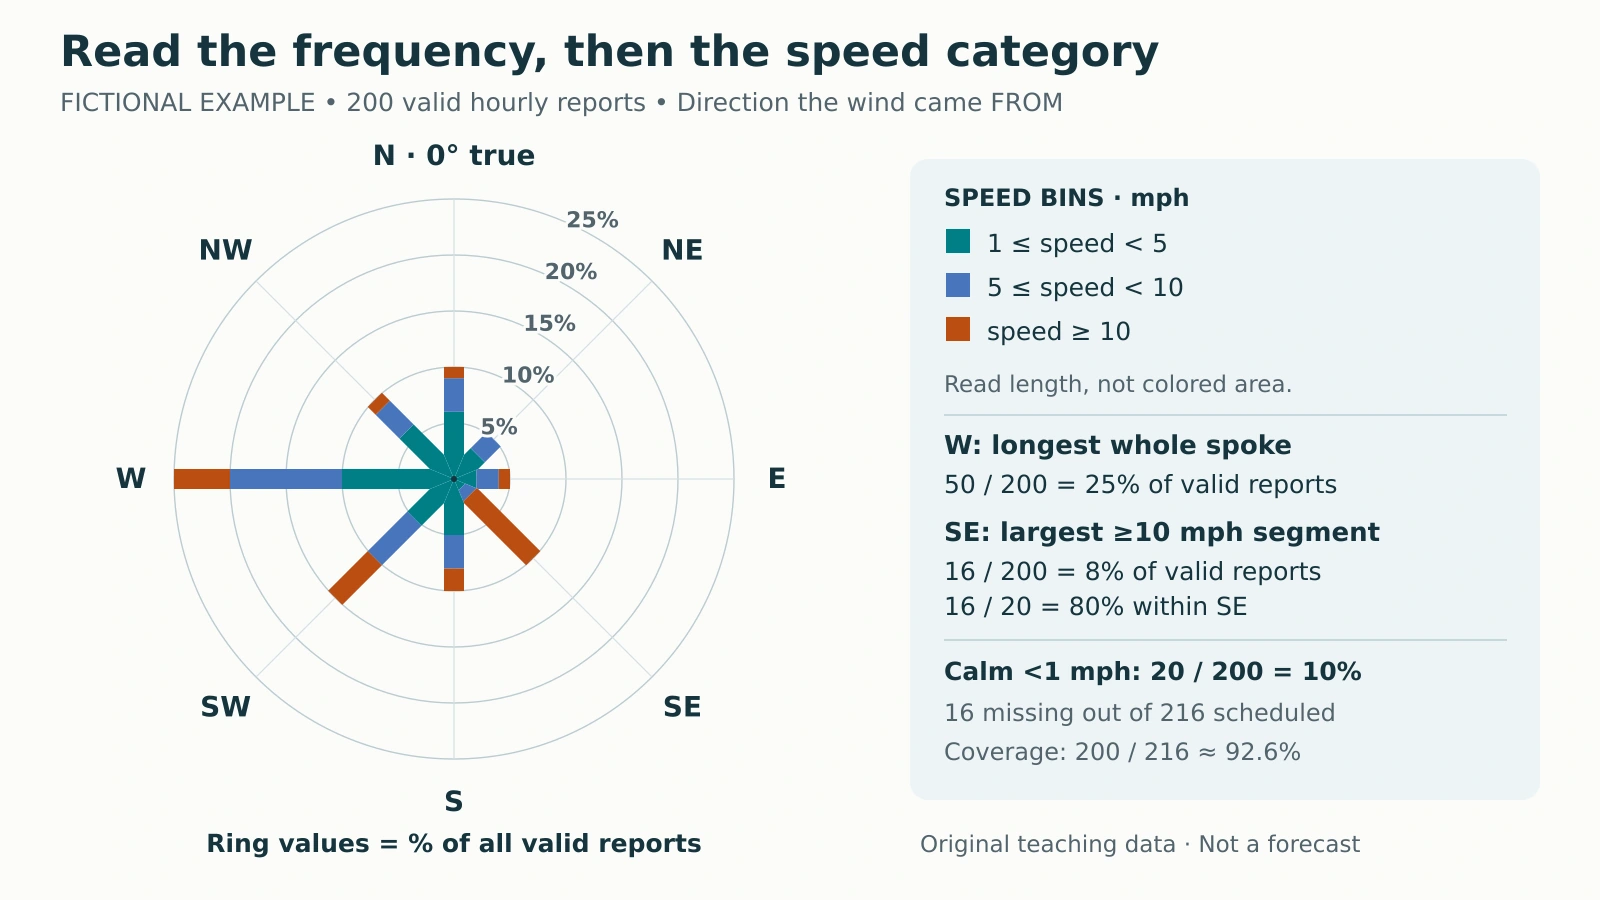
A wind rose can have its longest spoke in one direction and its largest high-speed segment in another. Reading it correctly means separating direction, speed and frequency, then asking which observations the percentages include. The fictional chart below makes those distinctions countable.
To read a wind rose, match each spoke to the direction the wind came from, read its length against the frequency rings, and use the colors to identify speed ranges. Check the observation period and percentage denominator. The longest spoke shows the most frequent direction, not necessarily the direction with the most high-speed reports.
How to use this article: You can inspect the exact counts, compare 8% with 80%, or check what the denominator includes.
Read Direction, Length and Color Separately
A conventional meteorological wind rose groups reports by the direction the wind came from. The west spoke therefore describes winds arriving from the west. It is a frequency bar, not a travel arrow. The EPA’s wind-rose guide distinguishes this direction convention from spoke length and speed colors.
Our chart uses eight 45-degree sectors centered on N, NE, E, SE, S, SW, W and NW. Bearings increase clockwise from true north at 0°. North covers 337.5° through 0° to just below 22.5°; northeast covers 22.5° to just below 67.5°. Every lower boundary is included and every upper boundary excluded.
The rings measure percentage of valid reports. Read a whole spoke’s endpoint for its directional total. Read the length of one colored segment for that direction-and-speed category. Neither the radius nor the colored area measures miles per hour.
Work From the Fictional Reports
Define the sample before reading the chart
This invented nine-day example schedules 216 hourly reports. Of these, 200 are valid, including 20 calm reports; 16 are missing. Each hypothetical report summarizes the preceding ten minutes. The percentages count reports, not uninterrupted hours of identical wind. No actual station, observation date or forecast is involved.

| Direction FROM | 1 ≤ speed < 5 mph | 5 ≤ speed < 10 mph | Speed ≥ 10 mph | Total |
|---|---|---|---|---|
| N | 12 (6%) | 6 (3%) | 2 (1%) | 20 (10%) |
| NE | 6 (3%) | 4 (2%) | 0 (0%) | 10 (5%) |
| E | 4 (2%) | 4 (2%) | 2 (1%) | 10 (5%) |
| SE | 2 (1%) | 2 (1%) | 16 (8%) | 20 (10%) |
| S | 10 (5%) | 6 (3%) | 4 (2%) | 20 (10%) |
| SW | 10 (5%) | 10 (5%) | 10 (5%) | 30 (15%) |
| W | 20 (10%) | 20 (10%) | 10 (5%) | 50 (25%) |
| NW | 12 (6%) | 6 (3%) | 2 (1%) | 20 (10%) |
| Non-calm total | 76 (38%) | 58 (29%) | 46 (23%) | 180 (90%) |
The averaging interval is a dataset choice. The Bureau of Meteorology documents ten-minute average winds; USDA describes different averaging intervals in its historical hourly archive. An hourly timestamp alone does not establish the averaging period.
For this exercise, calm means below 1 mph. Non-calm bins are 1 ≤ speed < 5 mph, 5 ≤ speed < 10 mph, and speed ≥ 10 mph. Exactly 5 mph enters the middle bin; exactly 10 mph enters the highest bin.
The 1, 5 and 10 mph thresholds are approximately 0.45, 2.24 and 4.47 meters per second. These rounded equivalents explain the scale; the exact mph boundaries define classification. The bins are original choices for this fictional dataset, not a conversion of measured source data or a universal calm standard.
Download the fictional counts and percentages as CSV. Calm reports are counted separately and have no direction sector.
Compare Frequent Winds With Higher-Speed Winds
West is the most frequent sector: 50 ÷ 200 × 100 = 25%. Its three segments represent 20, 20 and 10 reports, or 10%, 10% and 5% of all valid reports. The orange segment runs from the 20% ring to the 25% ring, so its own frequency is 5%, not 25%.
Southeast contributes 16 reports to the highest speed bin, compared with west’s 10. Thus southeast has more reports at or above 10 mph, despite having a shorter total spoke. “Most frequent direction” and “largest high-speed count” answer different questions.
Why 8% and 80% can both be correct
Across the whole valid sample, southeast winds at or above 10 mph account for 16 ÷ 200 = 8%. Among southeast reports alone, they account for 16 ÷ 20 = 80%. The first describes a joint category; the second is a conditional percentage using only the southeast row.
The northeast row has zero reports in the highest bin, so its spoke has no orange segment. That zero is an observed-category count within the fictional valid sample, not a missing observation.
Neither calculation identifies the maximum speed. The top category has no upper limit, and these hypothetical ten-minute means are not gust measurements. Even a much longer orange segment would indicate more reports in that category, not a larger maximum gust.
Keep Calm and Missing Reports Separate
The same count can produce a different percentage
The directional counts total 180, which is 90% of the 200 valid reports. Add calm’s 20 reports, or 10%, to reach 100%. Calm is displayed as a separate number, not as a scaled central circle.
If another chart excludes calm from its denominator, west becomes 50 ÷ 180 × 100 ≈ 27.8%. The count is still 50. Comparing that result with our 25% without checking the denominator would create a false difference.
Missing reports belong in neither group. Coverage is 200 ÷ 216 × 100 ≈ 92.6%; the missing share is about 7.4%. Those percentages use scheduled reports, not valid reports. Treating a missing report as calm would change both the calm count and the denominator.
Good coverage does not prove an unbiased sample. If outages cluster during stronger winds or at particular hours, the available reports can misrepresent the scheduled period. The rose alone cannot diagnose why observations are missing.
Recognize What the Rose Leaves Out
Rearrange the same 200 reports into a different order and this rose stays identical. It cannot show whether the westerlies arrived consecutively, which day was windiest, or how long one event lasted. Its 25% west value is not a 25% forecast probability for the next hour.
Before comparing real roses, read the selected dates and hours, sampling interval, instrument height, speed units, calm threshold and direction sectors. USDA’s wind-rose dataset notes illustrate why period and instrument metadata matter. The Midwestern Regional Climate Center also distinguishes conventional FROM roses from inverted TOWARD products, so confirm the convention.
A short sample does not establish a long-term climate pattern; the weather–climate distinction explains the wider context. Nor does frequent wind alone measure sediment movement: wind erosion also depends on surface conditions. Keep the conclusion tied to what the chart actually counts.
What Did We Learn Today?
West supplies the largest share of valid reports, while southeast supplies the most reports in the highest speed bin. The same southeast count is 8% of all valid reports and 80% of southeast reports. Check the denominator, separate calm from missing data, and use a time series when sequence or duration matters.
Sources & Data Notes
All counts and chart geometry are original fictional teaching material. Percentages in the table use 200 valid reports; coverage uses 216 scheduled reports. The non-calm comparison uses 180 reports. Rounded metric thresholds do not redefine the exact mph bins. The downloadable CSV preserves the directional counts and percentages; no observed weather record is claimed.