A weather report can show lower relative humidity in the afternoon even when the air has not lost water vapor. Dew point helps you distinguish that temperature effect from a change in moisture. Read the two numbers together, with air temperature, rather than treating either as a complete weather forecast.
Relative humidity is the percentage ratio of actual water vapor pressure to saturation vapor pressure at the air temperature. Dew point is the temperature at which cooling would bring the air to saturation, with pressure and moisture composition unchanged. Warming can lower relative humidity without lowering dew point or removing water vapor.
How to use this article: You can identify the weather-report fields, follow the worked calculation, compare equal percentages, or check a humidity report.
Two Measurements Answer Different Questions
Distinguish temperature from a percentage
Air temperature describes how warm or cold the air is. Dew point is also a temperature, but it describes a saturation threshold rather than the present warmth. The National Weather Service’s comparison explains why dew point can help interpret atmospheric moisture when relative humidity changes.
Relative humidity, usually abbreviated RH, compares two vapor pressures. Water vapor contributes part of the total pressure of the air; that contribution is its vapor pressure. Saturation vapor pressure is the equilibrium value associated with liquid water at a particular temperature.
The National Physical Laboratory’s definition gives the relationship: RH = actual vapor pressure ÷ saturation vapor pressure × 100. A reading of 50% means the first pressure is half the second. It does not mean that half the air is water, or that there is a 50% chance of rain.
These examples use saturation over liquid water and temperatures above freezing. An ice-based saturation threshold is a frost point, so calculations involving ice need the appropriate convention.
Why Warming Can Lower Relative Humidity
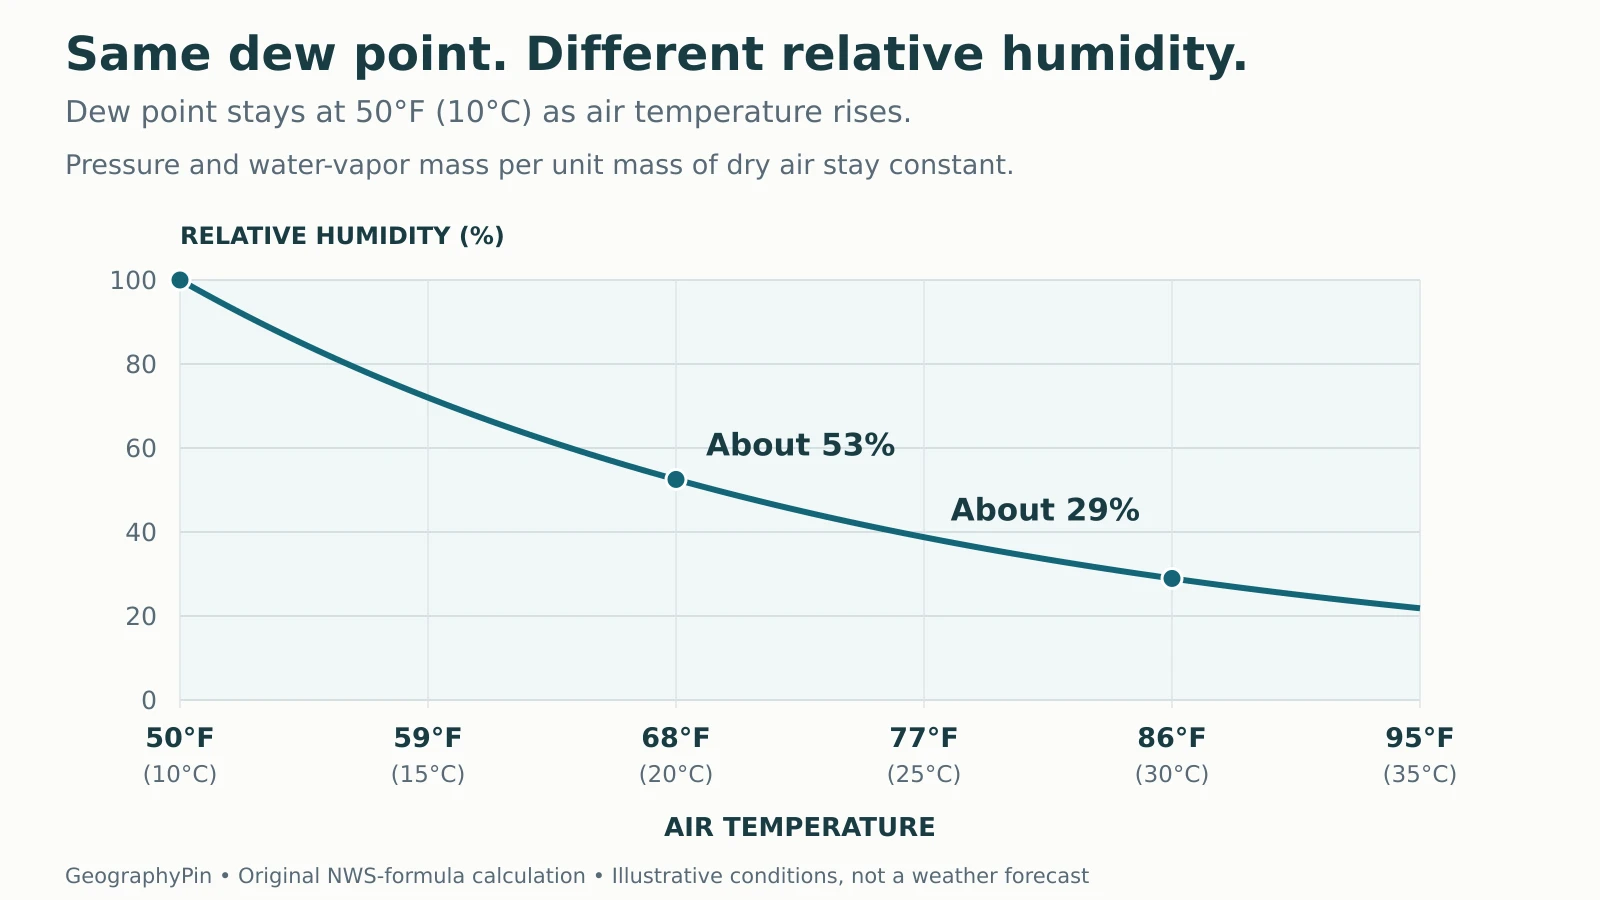
Imagine warming an air parcel while keeping its pressure and its water-vapor mass per unit mass of dry air unchanged. Its vapor pressure stays approximately constant, while saturation vapor pressure rises. The numerator of the RH fraction stays the same and the denominator grows, so the percentage falls.
NASA POWER’s humidity methodology explicitly relates vapor pressure to atmospheric pressure and moisture composition. The fixed-pressure condition matters: this is not a claim that dew point stays unchanged under every process that conserves water vapor.

Cooling reverses this trend until saturation is reached. Real outdoor air can also gain or lose vapor, mix with other air, or change pressure. Consequently, a daily RH cycle need not follow this simple curve exactly.
Work Through One Constant-Dew-Point Example
Calculate the ratio before rounding
The fictional cases below all have a dew point of 50°F (10°C). Using the NWS El Paso vapor-pressure approximation, their actual vapor pressure is about 12.28 hectopascals (hPa). Hectopascals are retained here because they are the formula’s scientific units; using the same pressure units in both parts leaves RH unchanged.
| Air temperature | Saturation vapor pressure | Calculated RH |
|---|---|---|
| 50°F (10°C) | 12.28 hPa | 100% |
| 68°F (20°C) | 23.39 hPa | About 53% |
| 86°F (30°C) | 42.44 hPa | About 29% |
For the middle row, 100 × 12.2833 ÷ 23.3894 gives approximately 52.5%, which rounds to 53%. For the warmest row, the same numerator divided by 42.4416 gives about 28.9%. No vapor removal is needed to explain this difference.
To reproduce the table, calculate saturation pressure as 6.11 × 10(7.5t ÷ (237.3 + t)), with t in Celsius. Insert air temperature for the denominator and dew point for the numerator, then multiply their ratio by 100. Keep unrounded intermediate values; these are approximate calculations, not precision instrument readings.
Equal Relative Humidity Does Not Mean Equal Moisture
Keep temperature in the comparison
Now compare two fictional reports that both show 50% RH. At 68°F (20°C), the same approximation gives a dew point of about 48.7°F (9.3°C). At 86°F (30°C), it gives about 65.2°F (18.4°C). Their identical percentages describe different vapor pressures.
The warmer case has about 21.22 hPa of actual vapor pressure, compared with 11.69 hPa in the cooler case. At equal total pressure, that higher vapor pressure also corresponds to more water vapor per unit mass of dry air. This is why comparing percentages alone can reverse your impression of which report represents more moisture.
Conversely, equal dew points indicate approximately equal vapor pressures. They do not necessarily mean equal grams of vapor per cubic meter: warming at constant pressure changes air density. Dew point, vapor pressure, moisture per mass and moisture per volume are related quantities, not interchangeable units.
Keep this distinction separate from climate classification. A single humid afternoon is a weather observation; Weather vs. Climate explains why describing a place’s long-term climate requires a broader record.
Condensation Is Local, and Saturation Is Not a Rain Forecast
A cold drinking glass can collect droplets while the room’s reported RH is below 100%. Air immediately next to a surface below the adjacent air’s dew point cools enough for condensation there. The NOAA cold-glass demonstration explains that this water comes from surrounding air, not from water leaking through the glass.
The surface temperature and nearby air matter. A weather station’s temperature and humidity do not prove that every window, leaf or road has the same conditions. Dew point is useful for understanding a threshold, but it does not promise a particular amount of dew.
Penn State’s meteorology lesson distinguishes saturation from rainfall: surface RH can be near 100% without rain, and rain can fall through air whose RH is lower. Cloud formation and precipitation involve conditions beyond a single surface reading.
Thus, neither “100% means rain” nor “less than 100% means no rain” is a reliable rule. For the broader movement and phase changes of water, see The Water Cycle Explained.
Use a Short Checklist When Reading a Report
Compare matching observations
Before interpreting a percentage or comparing two places, check what the numbers actually describe:
- Read all three fields: air temperature, dew point and RH should tell a consistent story.
- Match time and place: avoid combining an airport’s current temperature with another station’s daily minimum humidity.
- Check units: temperature and dew point may be displayed in Fahrenheit or Celsius; the formula above requires Celsius.
- Separate observations from forecasts: a current reading is not a prediction of the afternoon or the night.
- Identify the changed quantity: falling RH may reflect warming, reduced vapor pressure, or both. The percentage alone cannot settle which.
For a quick numerical check, a dew point equal to the air temperature should produce approximately 100% RH in the same saturation convention. Do not calculate RH by dividing dew-point temperature by air temperature: temperature scales have different zero points, and saturation pressure changes nonlinearly.
If you want to test the underlying ideas rather than memorize weather-app labels, try the Climatology and Meteorology Quiz.
What Did We Learn Today?
Relative humidity is a ratio tied to the air temperature; dew point expresses a saturation threshold. With pressure and moisture composition unchanged, warming can lower RH while dew point stays steady. Compare matching temperature, dew-point and humidity observations, and keep surface condensation separate from rainfall prediction.
Sources & Data Notes
All numerical cases and the graph are original teaching calculations, not observed weather. They use the NWS El Paso liquid-water approximation with Celsius inputs and unrounded intermediate values. Other validated formulas can differ slightly. The fixed-dew-point curve assumes unchanged pressure and water-vapor mass per unit mass of dry air; condensation beyond saturation is outside its scope.
- National Weather Service: Dew Point vs Humidity
- National Physical Laboratory: Dew point and relative humidity
- NASA POWER: Meteorological Derived Parameters
- National Weather Service El Paso: Vapor Pressure formula
- NOAA JetStream: Cold-glass condensation lesson
- Penn State: How to Relate to Relative Humidity