A weather station model packs several observations around one small circle. Here, “model” means a plotting convention, not a computer model predicting future weather. The challenge is recognizing which position or symbol carries each piece of information.
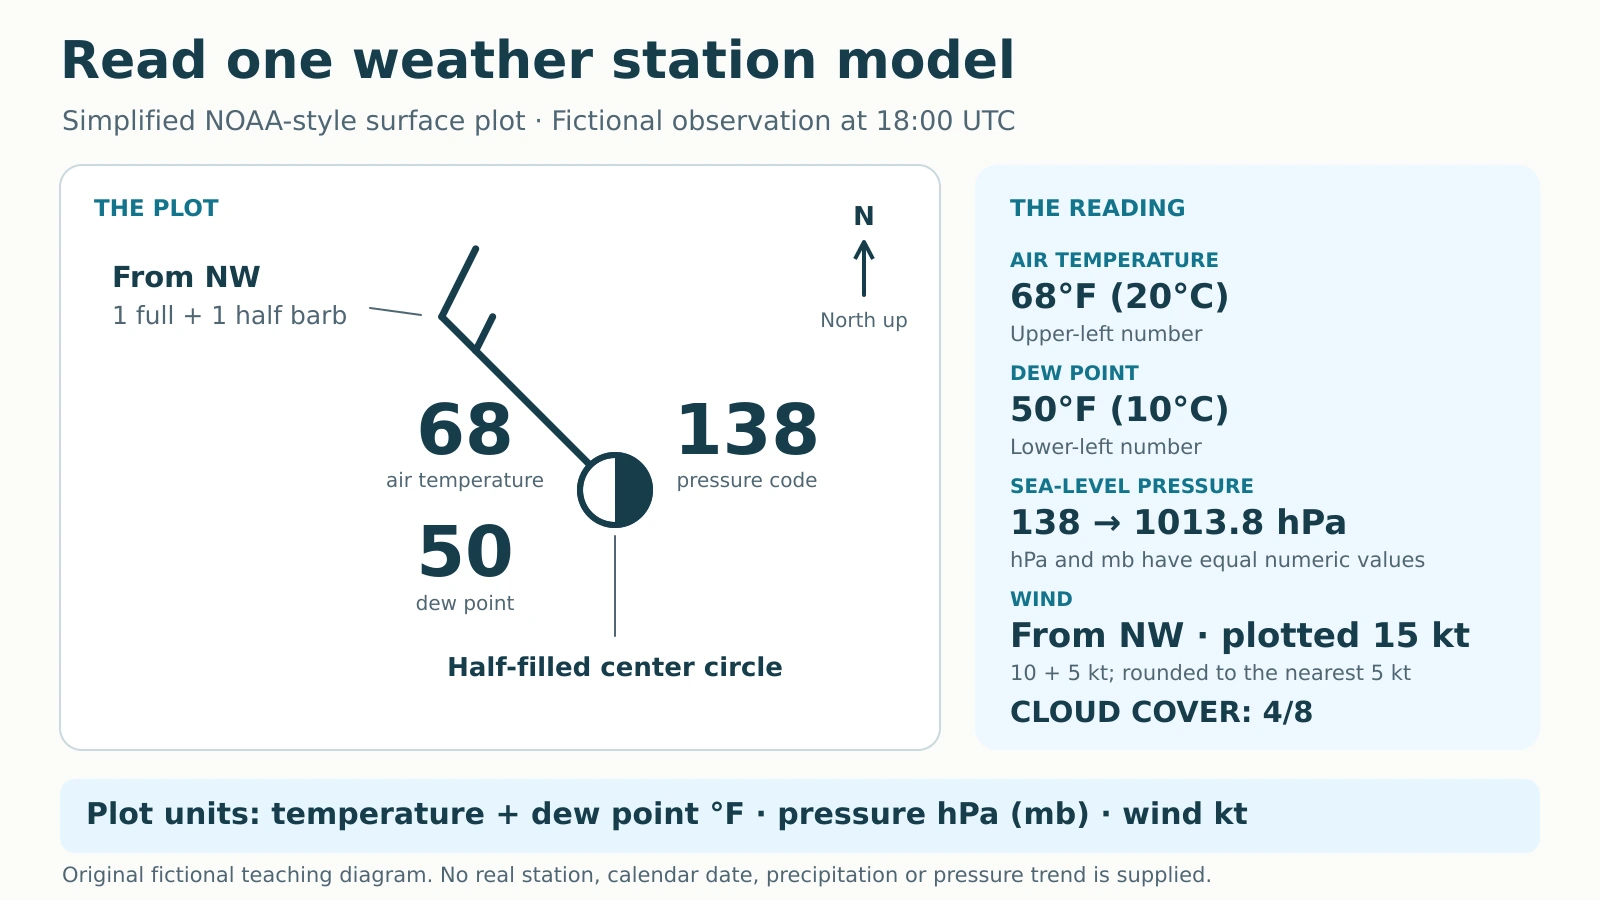
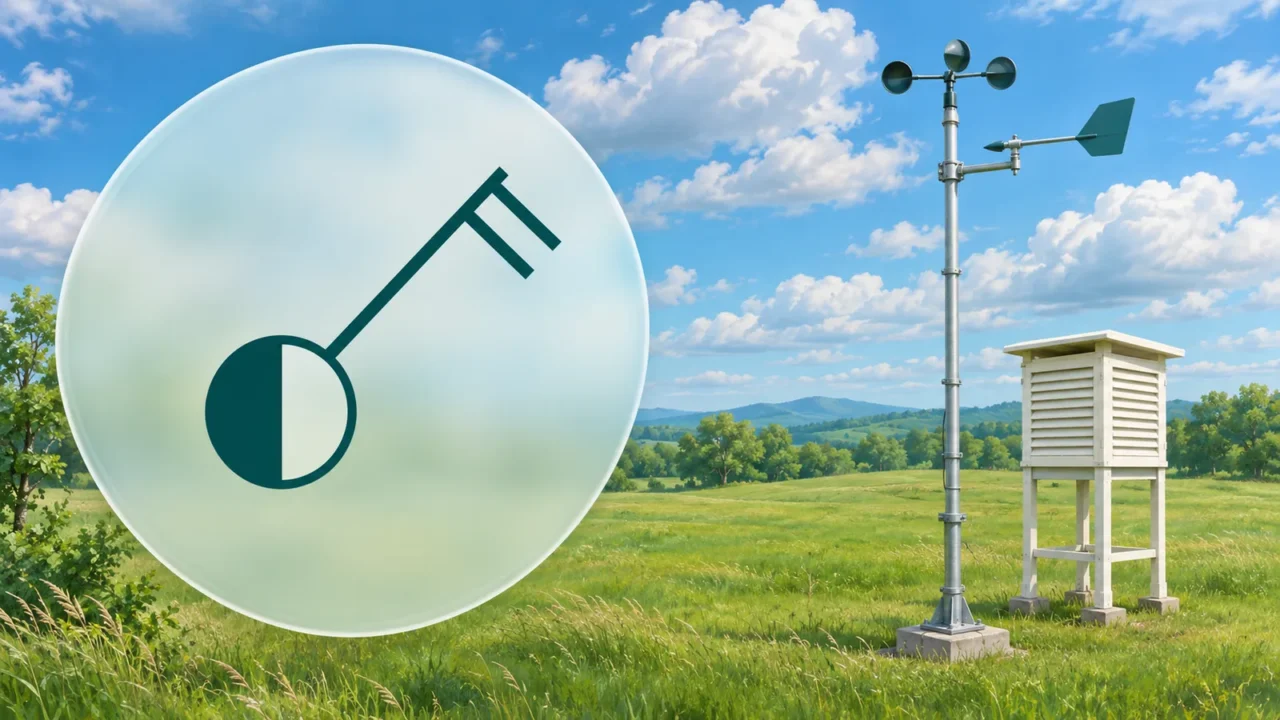
To read a weather station model, check the time, units and legend, then decode the numbers around the station circle and the wind shaft attached to it. In this simplified NOAA-style surface plot, temperature is upper left, dew point lower left and coded sea-level pressure upper right. Circle fill shows cloud cover; the shaft and barbs show wind direction and rounded speed.
How to use this article: You can restore the pressure code, read the wind barbs, or check two practice answers.
1. Start With the Plot’s Convention
This original example represents a fictional observation at 18:00 UTC, with north at the top. No real station or calendar date is assigned. It uses the basic positions in NOAA’s surface-weather plotting lesson, with extra fields deliberately left out.
Air temperature and dew point are in degrees Fahrenheit. Wind uses knots, abbreviated kt; pressure uses hectopascals, abbreviated hPa, numerically equal to millibars, or mb. Keep these scientific units while decoding because the symbols depend on them.

Other weather products can use different units or layouts. Read their own key before applying this example. The same legend-first habit underpins reading a map’s symbols and direction.
2. Read the Three Numbers
The upper-left 68 is air temperature: 68°F (20°C). The lower-left 50 is dew point: 50°F (10°C), the temperature to which this air would need to cool to become saturated. The lower number is not a daily minimum temperature.
Restore the pressure prefix and decimal
The upper-right 138 represents mean-sea-level pressure. This is pressure adjusted to a sea-level reference, rather than necessarily the raw pressure measured at the station’s elevation.
NOAA’s convention removes the leading 9 or 10 and the decimal point. Put the decimal before the last digit, then choose the prefix giving a value closest to 1000 hPa: 913.8 or 1013.8? Choose 1013.8 hPa. This is also 1013.8 mb.
That shortcut decodes this stated convention and ordinary teaching examples. It is not a universal test for extreme pressures or every weather product. Do not read 138 as 138 hPa or 13.8 hPa.
3. Decode Wind and Cloud Cover
Follow the shaft toward the wind’s origin
The long shaft extends from the circle toward the northwest. Wind direction names where the air comes from, so this is a northwest wind, moving toward the southeast. The shaft is not a travel arrow pointing downwind.
Add the marks at its outer end: a full barb contributes 10 kt, a half barb 5 kt, and a triangular pennant 50 kt. Our full and half barbs total 15 kt, about 17 mph (28 km/h).
NOAA’s plot rounds speed to the nearest 5 kt. Its 15-kt category includes reported whole-knot speeds of 13–17 kt. Write “plotted 15 kt,” rather than claiming the instrument measured exactly 15. The shaft’s length does not encode speed.
The central circle is half filled, indicating 4/8 cloud cover: half the sky covered by clouds. An empty central circle indicates no cloud cover; a fully filled circle indicates 8/8, or overcast. An obscured-sky symbol means the sky cannot be assessed through an obstruction, not another cloud fraction.
4. Turn the Plot Into a Report
Read the diagram without adding information. This table is its full text equivalent, including the position and symbol cues.
| Field and plotted cue | Decoded observation |
|---|---|
| Air temperature: 68, upper left | 68°F (20°C) |
| Dew point: 50, lower left | 50°F (10°C) |
| Sea-level pressure: 138, upper right | 1013.8 hPa (1013.8 mb) |
| Wind: northwest shaft; one full + one half barb | From northwest; plotted 15 kt |
| Cloud cover: half-filled central circle | 4/8 of the sky covered by clouds |
A complete reading is: At the fictional 18:00 UTC observation, air temperature is 68°F, dew point 50°F, sea-level pressure 1013.8 hPa, wind from the northwest at a plotted 15 kt, and cloud cover 4/8. This reports the supplied fields without inventing a forecast.
5. Check Two More Codes
Keep the exercises separate from the main plot
Pressure exercise: A different fictional plot shows 924 in the pressure position. Which restored value is closer to 1000 hPa?
Answer: Compare 992.4 with 1092.4. Their distances from 1000 are 7.6 and 92.4 hPa, respectively, so 924 → 992.4 hPa.
Wind exercise: A different shaft carries one pennant, one full barb and one half barb. What speed is plotted?
Answer: 50 + 10 + 5 = 65 kt. Count the symbols, not just the two line-shaped barbs. This speed belongs only to the separate exercise; the main station still shows 15 kt.
6. Keep Calm, Missing and Omitted Data Separate
In NOAA’s symbol key, calm uses a larger outer ring around the sky-cover circle. Its calm category covers 0–2 kt, so it does not certify an exact zero measurement. The central cloud circle alone says nothing about calm.
Variable wind direction is also different from calm. Use the product’s legend for variable or missing wind information; do not assume one universal glyph. Likewise, an unavailable cloud report is not evidence of clear sky.
This simplified drawing omits present weather and pressure tendency. Their absence does not mean “no precipitation” or “pressure unchanged.” Cloud amount alone cannot establish rain, and these five fields do not supply gust speed, future weather or a storm-hazard assessment.
One observation also cannot describe a place’s climate. The distinction between a snapshot and longer-term patterns belongs to weather versus climate.
What Did We Learn Today?
A reliable reading keeps each number attached to its position and units, restores the pressure code, and separates wind direction from speed. Preserve the observation time and the plot’s rounding. Finish with the information actually shown, leaving omitted fields unknown instead of turning the diagram into a forecast.
Sources & Data Notes
All example values and the diagram are original fictional teaching material. This simplified NOAA-style surface plot omits several fields; it is not a complete station report or a universal product key. Wind values are plotted categories rounded to 5 kt. No source illustration was copied.