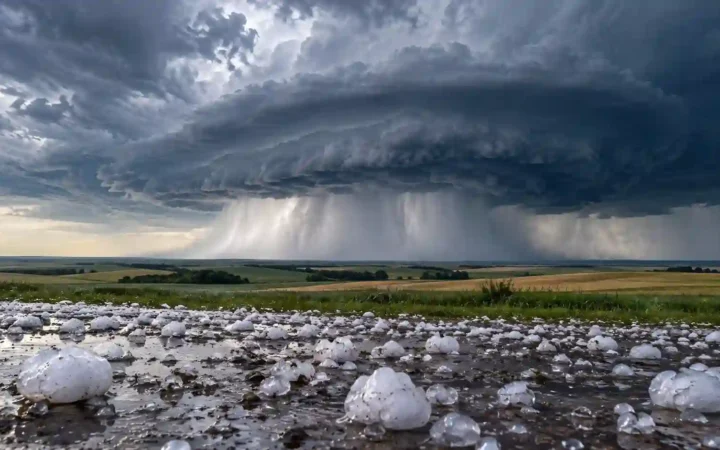
A wet slope beside a dry valley may suggest a rain shadow, but the contrast alone does not establish its cause. Test that explanation by matching the terrain to moisture-bearing winds and long-term precipitation, then try three fictional evidence sets with different strengths.
A rain-shadow explanation is supported when mountains intercept moisture-bearing winds and comparable long-term records show a wetter windward side and drier leeward side. Windward means facing the incoming flow; leeward means downwind. Check the relevant season and competing influences before attributing the contrast to mountains. One rainy afternoon cannot establish a climate pattern.
How to use this article: You can check the required evidence, compare your diagnosis, or test a seasonal reversal.
Start With Three Linked Pieces of Evidence
Match the barrier, the airflow and the record
A rain shadow is a relatively dry area downwind of mountains. NOAA’s weather glossary defines it by the contrast with the windward side. To investigate a proposed example, check three linked observations:
- Relief: does a ridge stand across the incoming airflow between the compared sites? Locate crests, slopes and gaps.
- Moisture-bearing wind: which direction brings precipitation during the season being studied? The most frequent wind overall may not supply most moisture.
- Comparable precipitation: do records for the same months and years show a persistent wet–dry contrast? Compare the same variable and check site elevation, gauge exposure and missing observations.
A contour map supplies the first layer, not all three. GeographyPin’s map-reading guide explains terrain interpretation. For climate comparisons, NOAA’s U.S. Climate Normals use a uniform 30-year period; an isolated storm answers a different question.
Compare Three Fictional Evidence Sets
All places, records and numbers below are invented teaching inputs, not real stations or observations. Each Northern Hemisphere case has a north–south ridge separating a western site from an eastern site. Within each pair, assume similar elevation, comparable gauge exposure and identical measurement methods.
For A and B, values are mean November–March precipitation totals across the same 30 fictional winters, labeled Years 1–30, with complete records. They include rain and melted snow, not snow depth, and are means per season rather than 30-year sums. Case C covers only one simultaneous afternoon.
| Case | Terrain evidence | Moist-wind evidence | Precipitation at the paired sites |
|---|---|---|---|
| A | Ridge between west and east sites | Moist westerly flow repeatedly crosses the ridge during November–March | 30-winter seasonal means: west 40 inches (1,016 mm); east 10 inches (254 mm) |
| B | Ridge between west and east sites | No wind or moisture-source information supplied | 30-winter seasonal means: west 30 inches (762 mm); east 10 inches (254 mm) |
| C | Ridge between west and east sites | Moist westerly flow observed that afternoon only | That afternoon: west 0.5 inch (12.7 mm); east 0 inches (0 mm) |
Decide which case supports a long-term rain-shadow interpretation, which needs wind evidence, and which cannot establish a climate pattern. Identify the missing observation before reading the answers.
Work Through the Evidence and the Answer
A supports the explanation; B and C leave gaps
Case A supports a winter rain-shadow interpretation. The ridge crosses the supplied moist-wind path, making the west side windward and the east side leeward for that flow. Matched long-term seasonal means show the expected contrast. The eastern mean is 30 inches (762 mm) lower: 40 minus 10. That difference describes the supplied data; it does not measure how much precipitation the mountain alone prevented.
Case B establishes a wet–dry contrast, but leaves its cause unresolved. Terrain and matched long-term totals are present. Without the moisture-bearing wind direction, neither side can be assigned the relevant windward or leeward role. Obtain seasonal wind and moisture-source evidence rather than assuming the wetter site faces the incoming flow.
Case C is insufficient for a climate inference. Its terrain, wind and showers fit a possible rain-shadow effect during that event. A single afternoon cannot show whether that arrangement recurs or dominates the seasonal climate. Add comparable long-term precipitation and seasonal airflow evidence. The distinction follows weather versus climate.
Missing evidence does not prove that no rain shadow exists. It limits the conclusion you can defend from the supplied information.
Check Seasons and Competing Explanations
West and east are not permanent airflow labels
If moist winds arrive from the east in another season, the eastern slope becomes windward for that flow. Case A’s winter evidence cannot establish the summer pattern. Compare that season’s winds and precipitation separately; an annual average can conceal different seasonal relationships.
Even Case A is consistency evidence, not proof excluding other causes. Distance from the coast and regional circulation may contribute to the contrast. In real records, differing elevations, gauge exposure, observation methods or missing data can distort a comparison. Similar sites and matched periods reduce these problems without isolating the mountain’s contribution.
Vegetation can support an interpretation, but cannot independently establish the mechanism. Irrigation, soils, fire and land use also affect plant cover. Likewise, ridge height alone cannot predict a rainfall total: moisture supply, airflow and storm structure matter.
Use the Physical Process to Interpret the Pattern
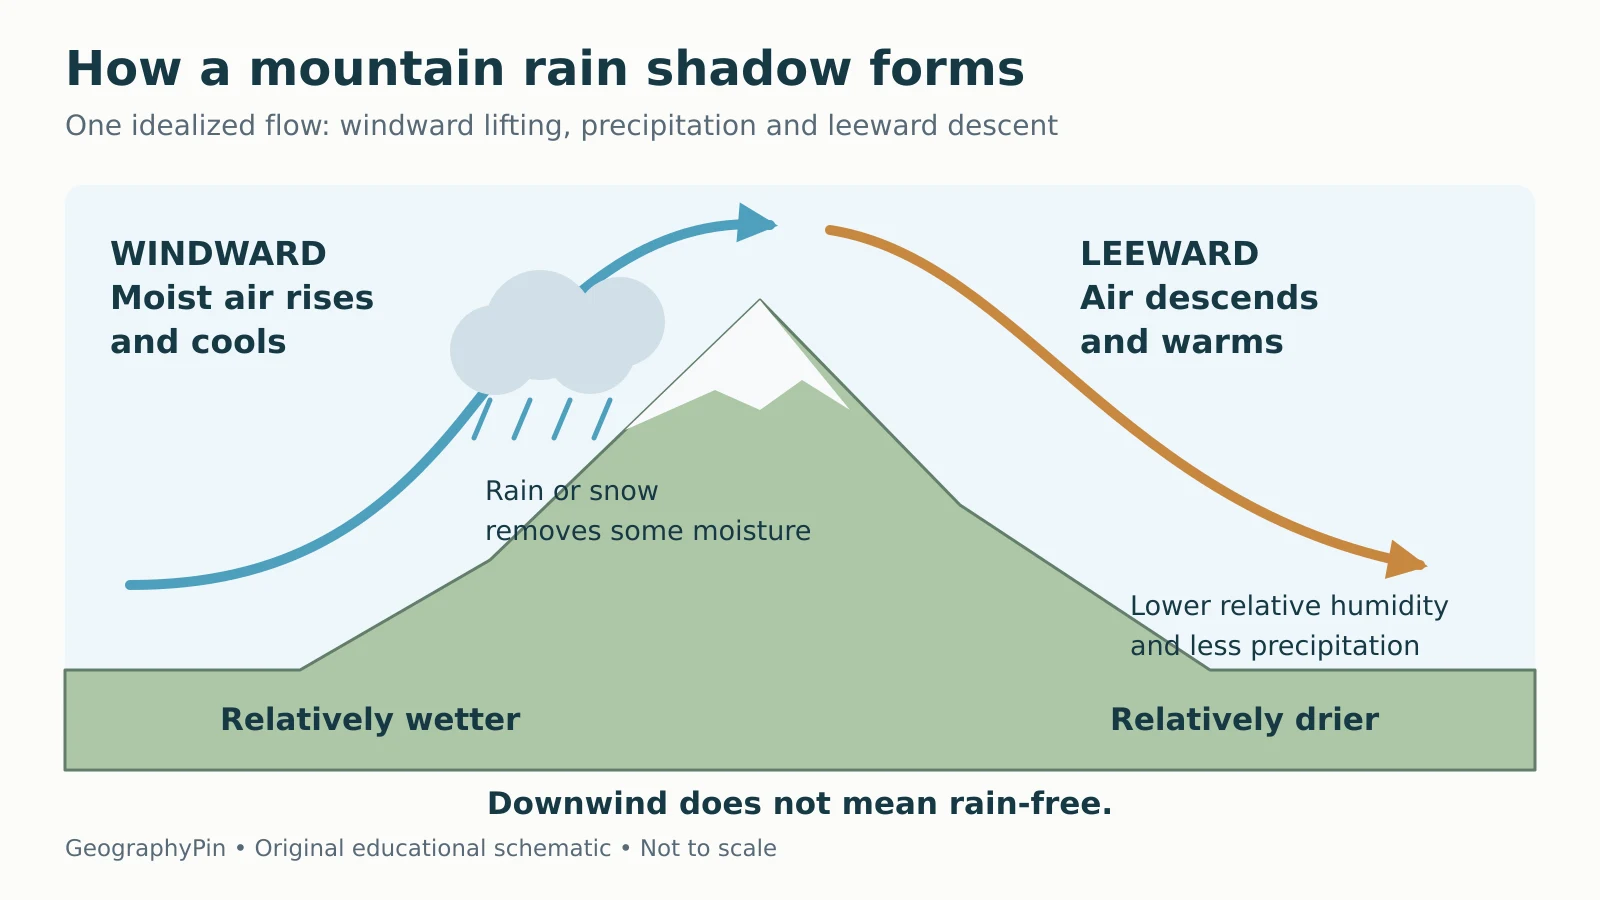
The process explains why Case A’s evidence fits. Air forced upward expands and cools as pressure decreases. If it reaches saturation, clouds can form; particles must grow sufficiently before precipitation falls. NOAA’s precipitation explanation distinguishes lifting from that growth step.
Precipitation removes some moisture upstream. Descending air compresses and warms, reducing relative humidity unless moisture is added. This helps explain a drier lee side, not an entirely rain-free one.

The National Park Service’s Olympic weather brochure illustrates the real-world pattern: moist Pacific systems encounter the mountains, while the northeastern peninsula is much drier. It is a familiar illustration of the mechanism, not evidence for the invented case totals. For a new location, return to the three checks and state what remains unverified.
What Did We Learn Today?
A defensible diagnosis connects the barrier, the moisture-bearing wind and matched long-term precipitation. Case A supplies that combination for winter; B lacks airflow evidence; C lacks climate evidence. Keep the conclusion within the season and record provided, and investigate competing explanations before assigning the whole contrast to the mountains.
Sources & Data Notes
NOAA and National Park Service pages support the physical process, climate-comparison timescale and brief Olympic illustration. Cases A–C are original fictional teaching scenarios, not measured station data or official climate normals. Conversions use exactly 25.4 millimeters per inch. The schematic does not predict precipitation or map an actual boundary.