A red forest in a satellite image is not necessarily burning, and a dark patch is not automatically water. The first task is to find out which measurements were turned into the colors on your screen.
To read satellite images, identify the location, acquisition date, sensor and band combination, then compare color with shape, texture and context. True color approximates visible light; false color assigns other measurements to display colors. A striking color alone cannot establish pollution, damage, water depth or vegetation health.
How to use this article: Compare the matched Florida views, decode band recipes, check image metadata, or test your reading with the exercise answers.
1. Start with the same place, not the same color
The three views below show the same part of southeastern Florida and the northern Everglades. They are a matched teaching set published by NASA Earth Observatory, not a before-and-after sequence. The coastline, fields and wetlands stay in place; the selected wavelengths change.
Read the landscape first: the Atlantic Ocean is on the right, the pale developed coastal strip runs roughly north–south beside it, rectangular agricultural fields occupy the upper part of the scene, and wetlands spread across the center and left. Compare those same shapes in every panel. A feature does not become a different land cover just because its displayed color changes.
View A: true color
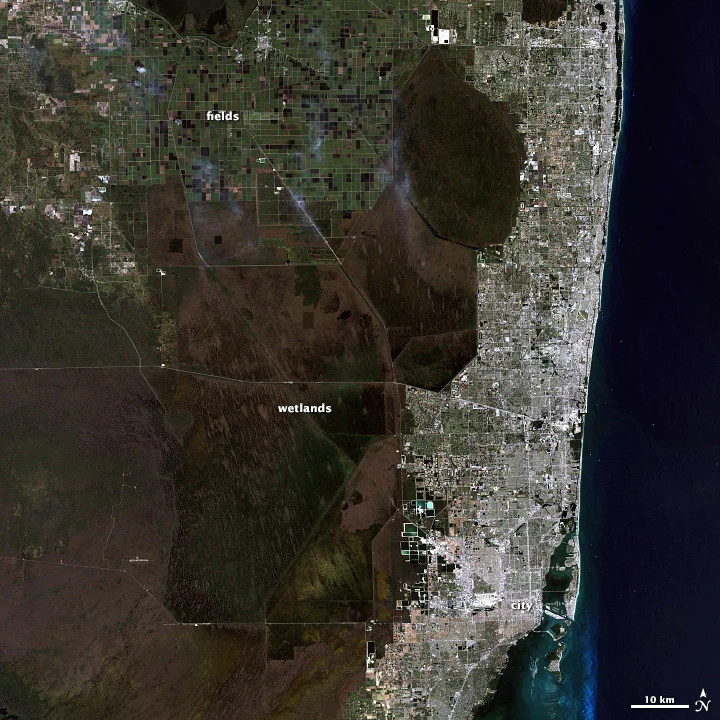
View B: near-infrared false color
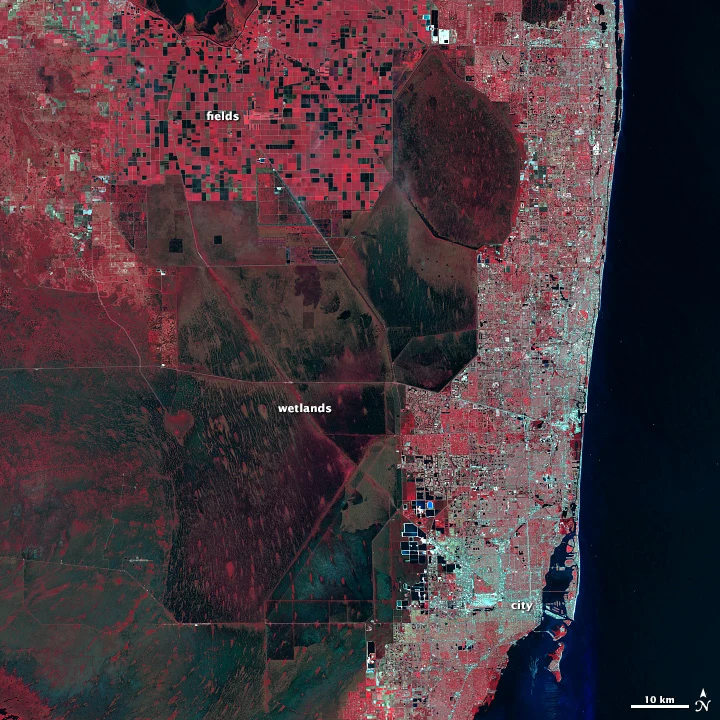
View C: shortwave-infrared false color
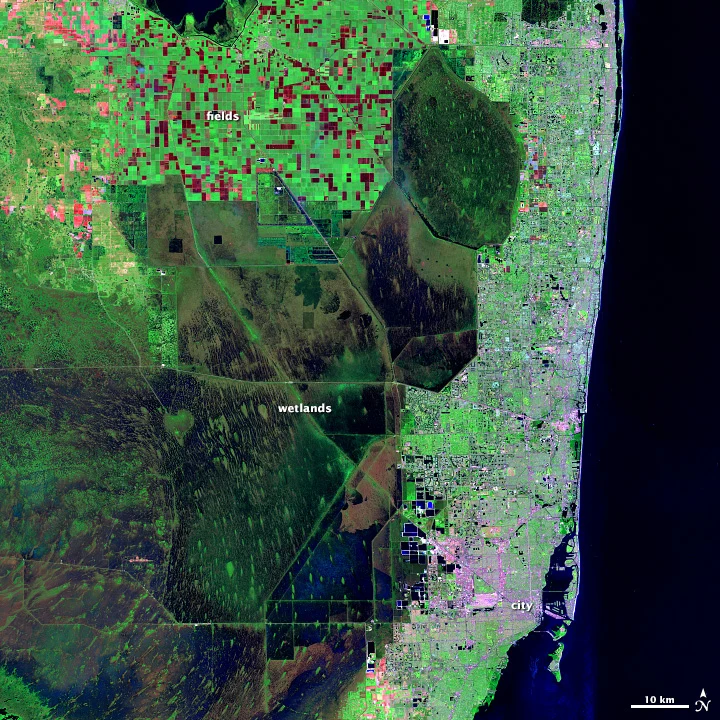
These reproductions retain NASA’s original labels, north arrow and scale. The large captions carry the essential reading cues on a phone; enlarge a panel to inspect its smaller original labels. None of these panels is a temperature map.
2. What bands and false color actually mean
A band is a range of wavelengths measured by a sensor. For the broader distinction between active and passive observations, see how remote sensing works. A displayed color image assigns measurements from selected bands to the screen’s red, green and blue channels. The band being measured and the color used to display it are two different things.
In a true-color composite, measured red light goes to the red display channel, green to green, and blue to blue. This approximates familiar human vision. It is still a processed image: contrast adjustments, atmospheric effects and the instrument’s response affect its appearance.
False color changes that assignment, often bringing invisible infrared wavelengths into view. It does not mean fake imagery. The measurements can be real even when vegetation looks red. Conversely, familiar-looking natural color is not proof that an image is current, unprocessed or suitable for measuring an environmental change.
Read the recipe in display order
When a caption lists a composite as “near infrared, red, green,” it usually means those bands are assigned to the display’s red, green and blue channels, respectively. Confirm the stated convention rather than guessing from an unlabeled string of numbers.
Band numbers are sensor-specific. The same number need not describe the same wavelength on different satellite instruments. For example, USGS lists true-color red/green/blue as bands 3/2/1 for Landsat 4–5 TM, but 4/3/2 for Landsat 8–9 OLI. Use the sensor’s documentation to translate a numbered recipe; use wavelength names when comparing products from different missions.
Near-infrared reflected light and thermal infrared are not interchangeable. The red vegetation in View B reflects near-infrared sunlight strongly. It is not red because the image is showing that vegetation as hot.
3. Use color together with shape, texture and context
Color supplies a clue, not a complete identification. A useful reading combines the composite recipe with a feature’s shape, texture, position and relationship to nearby features. The same material may look different under different illumination or image processing.
- Vegetation: commonly green in true color, red in the near-infrared/red/green recipe, and bright green in the shortwave-infrared/near-infrared/green recipe. Compare the repeating field shapes as well as their colors. Do not diagnose plant health from redness alone.
- Water: often dark in infrared composites because water absorbs much of that radiation. Sediment, shallow bottoms, reflections and mixed pixels can change its appearance. A dark patch may also be a shadow; follow its outline and surroundings.
- Exposed ground: may be brown or tan in natural color and pinkish in some shortwave-infrared composites. Soil moisture, minerals and the chosen stretch affect it. Bare ground and built surfaces can share similar tones.
- Built areas: roads, blocks and a connected street pattern can be more diagnostic than a silver or purple color. In the Florida set, the coast-hugging developed strip keeps its recognizable shape across all three views.
- Clouds: often look bright in visible imagery and may have darker shadows nearby. Snow and pale ground can also look bright. Infrared combinations can help separate them, but the meaning of a blue or white cloud depends on the bands selected.
Small objects may be blended within a single pixel. The raster data model explains why image cells differ from vector outlines. A field edge, narrow canal or shoreline pixel can mix vegetation, soil and water. Treat a broad color patch as evidence at the image’s scale, not as a precise inventory of every object inside it.
4. Check date, resolution and processing before comparing images
The metadata checklist
Before interpreting a scene, find its location, acquisition date, sensor, band combination, spatial resolution and processing description. The acquisition date is when the measurement was made, not when a web page was published or last updated. A mosaic can combine observations from multiple dates.
The Florida panels are used here as a historical interpretation exercise. NASA’s source identifies them as a matched scene; this page does not assign a new acquisition date or treat them as a current assessment of Florida. A filename is not a substitute for checked scene metadata.
Spatial resolution describes the ground detail represented by the observations. Enlarging a web image makes its pixels easier to see; it does not recover detail the sensor never recorded. Nor does the pixel size of a downloaded illustration necessarily equal the native resolution of its satellite data.
When two images look different, ask whether they use the same bands, comparable processing and similar viewing conditions. An automatic contrast stretch redistributes display brightness; two scenes with different stretches can look dramatically different without an equally dramatic physical change.
Distinguish seasonal differences from damage
A leafy summer landscape and a dormant winter landscape are not a controlled before-and-after comparison. Crop harvests, rainfall, changing water levels, snow cover and sun angle can alter what an image shows. Compare similar seasons where possible and check cloud and shadow contamination.
For a defensible change claim, identify a specific feature, use suitable dates and comparable products, and look for corroboration. One unusually colored patch cannot establish pollution, drought damage, deforestation or a burn. Those interpretations may need additional bands, time series, field observations or an authoritative analysis.
5. Try a three-step interpretation exercise
Use Views A–C above. Keep the coastline in the same position as you compare them; do not compare unrelated red and green patches.
- Find the agricultural fields. Locate the rectangular grid toward the top of View A. Find the same grid in B and C. What changed: the field geometry, or the colors used to represent it?
- Follow the developed coast. Trace the pale urban strip in A, then follow its same outline in B and C. Which clue would still help if you did not know the color recipe?
- Inspect the wetlands. Compare the dark interior and its smaller vegetation patches. Which composite helps you distinguish vegetated patches from their wetter surroundings? What can you not conclude from that contrast alone?
Answers and limits
1. The grid remains recognizable. Differences between these panels mainly demonstrate the chosen spectral combinations, not a sequence of crop changes. Individual fields need not all share the same color because their surfaces differ.
2. Position and shape remain useful. The connected coastal development is recognizable even when its tone changes. A color-only classification would be less reliable than one that also uses its pattern and location.
3. View C emphasizes the contrast between bright vegetation and darker wetland areas; NASA describes tree islands becoming more evident in this combination. That does not provide a measured water depth, a pollution diagnosis or a date-to-date change estimate. Those are different questions requiring additional evidence.
The strongest short interpretation separates observation from inference: “Rectangular patches appear red in a near-infrared composite” is an observation. “All those crops are healthy” is a much stronger claim that this picture alone does not establish.
6. A practical reading routine you can reuse
- Locate the scene. Establish north, scale and a recognizable coastline, river or settlement.
- Read the caption. Identify the sensor, observation date and band-to-color recipe before decoding colors.
- Describe what is visible. Note shapes, textures and repeated patterns, then add color clues.
- Check competing explanations. Could shadow, cloud, wet soil, season or display processing explain the appearance?
- State a bounded conclusion. Say what the image supports and what requires another date, dataset or expert analysis.
When working with a screenshot, preserve the source and caption alongside it. A cropped image without its band combination or date may be visually striking but difficult to interpret responsibly. Start with a source that exposes those details rather than trying to reverse-engineer an unlabeled picture from its colors. For broader practice after this exercise, try the remote sensing quiz.
Frequently Asked Questions
Can a false-color image show whether water is safe to drink?
No. An image can reveal patterns worth investigating, but drinking-water safety requires appropriate measurements and testing. Water color alone does not identify a contaminant or establish a safe concentration.
Can I read an optical image underneath a thick cloud?
Not by enlarging it. A thick cloud can obscure the surface in optical imagery. Use another suitably clear observation or a different data source appropriate to the question; do not interpret cloud-covered pixels as observed ground.
Is a single grayscale band less real than a color image?
No. Grayscale can show the measured signal in one band. A color composite is a display assembled from multiple channels, not automatically a more direct view of reality.
What Did We Learn Today?
The same landscape can look very different when different satellite bands are assigned to screen colors. Read the recipe, locate stable shapes, and check metadata before interpreting a scene. Comparing like with like and separating an observation from a diagnosis makes the image useful without asking it to prove more than it can.
Sources & Data Notes
The matched Florida panels reproduce NASA Earth Observatory’s published true-color and two false-color examples, credited to Matt Radcliff with USGS Landsat data. They are historical teaching images, not a newly acquired survey. They retain the original geometry, labels and scale; conversion to a smaller web file does not increase their resolution. Interpretations are tied to these stated band combinations, not a universal color key.