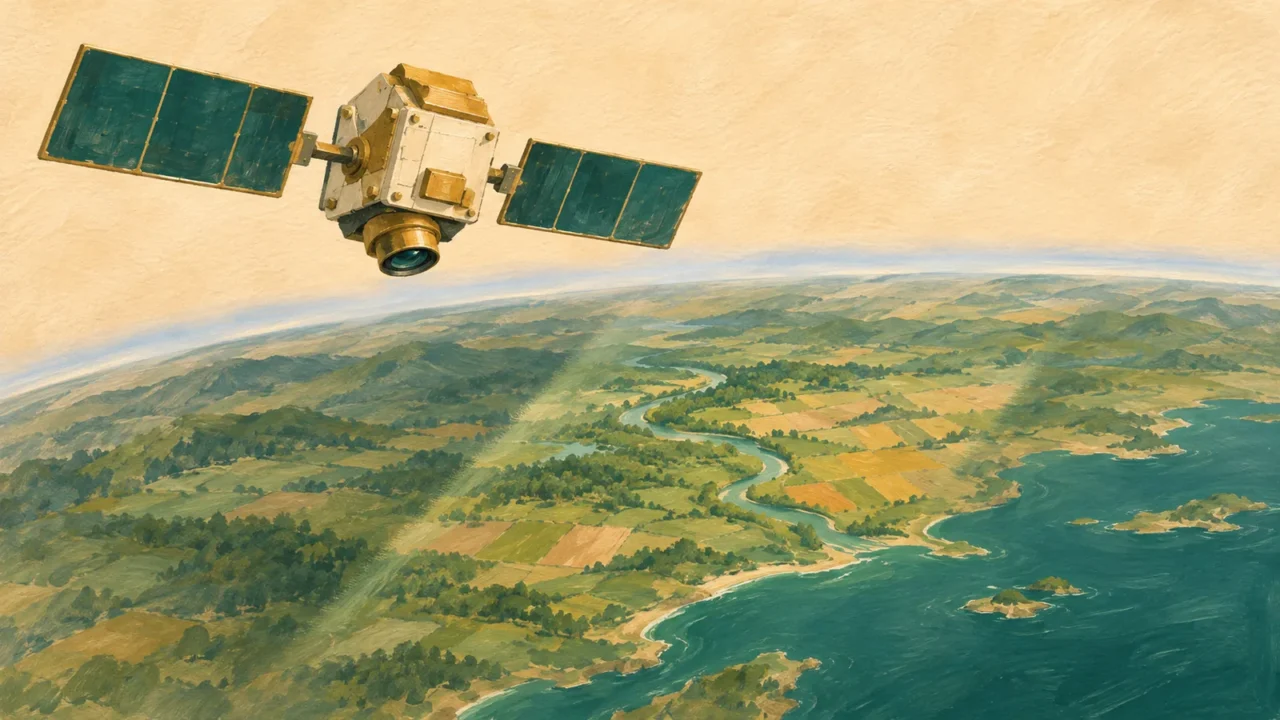
Take this remote sensing quiz to test how observations become evidence about Earth. Work through 20 questions on sensors, image resolution and interpretation, with an explanation after every answer and a final score out of 20.
Remote sensing observes without direct contact; Earth observation applies it to our planet. This round focuses on how satellites, aircraft and other platforms acquire and interpret signals. It connects to GIS, but concentrates on sensing rather than spatial-analysis tools.
Read the signals behind the satellite image.
20 questions · No timer · One point per correct answer
Easy, Medium and Hard are relative editorial difficulty levels for general geography learners, not standardized ratings. Every correct answer earns one point.
Choose an answer, then open “Show answer” to check it yourself. Interactive scoring appears when JavaScript is available.
Choose one answer, select Check answer, then continue to the next question.
Your Remote sensing and Earth observation quiz result
Easy
Show answer
Correct answer: A is passive; B is active.
Passive sensing records naturally available radiation, including reflected sunlight. An active sensor provides its own illumination and measures the response. Both instruments need electrical power, but that is not what active and passive mean in remote sensing.
Medium
Show answer
Correct answer: It detects thermal radiation emitted naturally by the surface.
Passive sensors can detect naturally emitted radiation as well as reflected sunlight. A thermal infrared instrument can therefore operate at night. A clear view matters: this does not mean a thermal camera can see the ground through thick clouds.
Easy
Show answer
Correct answer: About 40% of the incident radiation in that band is reflected.
Reflectance expresses reflected radiation relative to incoming radiation for the band and observation conditions. It is not directly a vegetation-cover percentage or a temperature. A file’s stored digital number may need scaling before it represents a reflectance value.
Easy
Show answer
Correct answer: Use smaller ground pixels from a finer-resolution sensor.
Spatial resolution concerns the ground detail represented in the image. Smaller native ground pixels generally provide more samples across a rooftop. Revisits, spectral bands and brightness levels describe other kinds of resolution; smaller pixels alone still do not guarantee accurate identification.
Medium
Show answer
Correct answer: Record narrower wavelength bands around that feature.
Higher spectral resolution separates finer wavelength intervals. Narrow bands can capture an absorption feature that is averaged together with neighboring wavelengths in a broad band. Success still depends on signal quality and the feature being within the sensor’s measured range.
Medium
Show answer
Correct answer: Higher temporal resolution reduces the chance of missing the event.
Temporal resolution describes how frequently a place can be observed. More frequent acquisitions improve the chance of capturing a short-lived flood. That advantage does not change the pixel size or automatically give flood depth, and clouds can still reduce the useful observations.
Hard
Show answer
Correct answer: 4,096 levels.
An encoding with b bits has 2 to the power b possible values. Twelve bits provide 4,096 levels, compared with 256 for eight bits. Finer quantization is a radiometric advantage, but bit depth by itself does not prove greater measurement accuracy.
Medium
Show answer
Correct answer: Its measured signal combines contributions from different cover types.
This is a mixed pixel. Its signal can reflect more than one surface type, so assigning a single land-cover label can hide the mixture. Finer observations may reduce this problem, but the original pixel does not reveal the precise shoreline within it.
Easy
Show answer
Correct answer: Strong near-infrared reflection is being displayed as red.
The displayed color follows the chosen band assignment. Vegetation often reflects near infrared strongly, and this composite displays that signal in red. False color is a way of showing information, not fabricated measurements; another band combination can give the same vegetation a different color.
Medium
Show answer
Correct answer: Reflected radiation just beyond the visible range.
Near infrared lies beyond the wavelengths visible to our eyes. Measuring its reflected signal adds information about surface properties, including vegetation, that ordinary RGB imagery lacks. Reflected near infrared and emitted thermal infrared are different measurements and should not be treated as interchangeable.
Medium
Show answer
Correct answer: 0.50.
The difference is 0.60 − 0.20 = 0.40, and the sum is 0.80. Dividing gives NDVI = 0.50. This is a dimensionless vegetation index, not a statement that vegetation covers exactly 50% of the pixel or that the pixel contains 50 plants.
Hard
Show answer
Correct answer: They share this index value, but crop species and biomass may differ.
NDVI compresses red and near-infrared measurements into one ratio. Different surfaces can share the ratio. It can also saturate in dense vegetation and respond to soil background, so matching values do not uniquely identify a species, biomass or crop yield.
Medium
Show answer
Correct answer: A gap in usable surface observations despite the nominal revisits.
Revisit frequency describes observation opportunities, not guaranteed clear views of the surface. Thick clouds can block the optical surface signal. Cloudy pixels should be screened or flagged; a missing usable observation is not evidence that land cover disappeared.
Medium
Show answer
Correct answer: It supplies its own microwave signal, with performance still dependent on conditions.
SAR sends microwave pulses and measures their return, so it does not need sunlight and can often observe through clouds. This is not immunity to every atmospheric effect: intense rain can degrade some shorter-wavelength radar signals. Select a suitable system and assess data quality.
Medium
Show answer
Correct answer: The round-trip travel time of the light pulse.
LiDAR, short for light detection and ranging, measures the delay between sending a laser pulse and receiving its reflection to calculate range. Combined with instrument position and orientation, ranges support three-dimensional mapping. Returns can come from vegetation, buildings or ground; a bare-earth model requires appropriate processing.
Hard
Show answer
Correct answer: Use suitable atmospheric correction and screen contaminated pixels.
The atmosphere can scatter and absorb radiation between the surface and sensor. Surface-reflectance processing accounts for atmospheric effects, improving comparisons. It does not magically recover ground hidden by opaque clouds, and product-specific scaling and quality flags still matter.
Medium
Show answer
Correct answer: Supervised land-cover classification.
Supervised classification learns from examples associated with predefined classes. It assigns labels using measured features; the land-cover label is an interpretation rather than a quantity the sensor directly reads. Unsupervised methods first group similar observations and still need those groups to be interpreted.
Hard
Show answer
Correct answer: Test it against independent, well-distributed reference observations.
Training performance can be overly optimistic. Independent reference observations provide a stronger check, especially when sampling represents the area’s different conditions. Reference labels also need suitable dates and reliable locations; “ground truth” is useful evidence, not a promise that every reference is error-free.
Medium
Show answer
Correct answer: Compare seasonally matched, aligned observations and investigate other differences.
Seasonal vegetation changes can create large differences without permanent forest loss. Change detection needs comparable timing, geometric alignment and attention to clouds, illumination and processing. A sustained change across suitable observations is stronger evidence than one unmatched before-and-after pair.
Hard
Show answer
Correct answer: Accuracy is 90% for these samples, but errors may be concentrated in one class.
The observed overall accuracy is 90 ÷ 100 = 90%. That single number does not reveal which classes were confused. A confusion matrix and class-specific measures provide more detail, while the sampling design and reference quality affect what can be inferred about the wider map.
Choose the observation for the question
Each correct answer earns one point, with no penalty for a wrong answer. At the end, select Review answers to see every question and explanation, or Try again to replay the same set. The quiz does not save your score between visits.
- Name the resolution. Ground detail, wavelength detail, observation frequency and signal levels answer different questions. “Higher resolution” is incomplete without saying which one.
- Know what creates the signal. Reflected sunlight, emitted thermal energy, radar pulses and laser returns need different interpretations. Platforms also trade local flexibility against broad coverage.
- Separate measurements from labels. False-color displays reveal selected bands, while indices and land-cover classes are derived interpretations. Neither substitutes for checking the evidence.
- Compare like with like. Clouds, seasons, atmosphere, alignment and reference quality can change the conclusion. Independent validation matters as much as a sharp-looking image.
For a broader, configurable mix of places and geography topics, try the world geography quiz.
What Did We Learn Today?
Remote sensing turns measured radiation into evidence about Earth. Active and passive instruments differ in their energy source, and spatial, spectral, temporal and radiometric resolution describe different capabilities. Band combinations, NDVI and classifications help interpret observations, but clouds, mixed pixels and processing can complicate the result. Reliable change detection and independent validation keep useful signals separate from unsupported conclusions.
Sources & Data Notes
All numerical examples and observation scenarios are hypothetical, not measurements extracted from an image. NDVI uses already scaled reflectance values; the bit-depth example assumes ideal encoding over the same range. Nominal revisit frequency is not a guarantee of clear observations, radar is not immune to every atmospheric effect, and an index is not a unique species identifier. Reference observations and classifications both have uncertainty. Easy, Medium and Hard are relative editorial labels, not standardized ratings.
- NASA: Remotely Sensing Our Planet; Time is of the Essence When Monitoring Dryland Floods; Why is that Forest Red and that Cloud Blue? How to Interpret a False-Color Satellite Image; Reflected Near-Infrared Waves.
- U.S. Geological Survey: Landsat Surface Reflectance; Landsat Normalized Difference Vegetation Index; NDVI, the Foundation for Remote Sensing Phenology; What is Lidar data and where can I download it?.
- Belgian Science Policy Office: III.2.2 Spatial resolution; III.2.1 Spectral resolution; III.2.3 Temporal resolution; III.2.4 Radiometric resolution; IV.4.4 Classification; V.2 Accuracy of data; IV.4.5 Multi-temporal analysis and change detection.
- European Space Agency: Newcomers Earth Observation Guide.
- Humboldt University of Berlin: 9. Accuracy assessment.