A climate map labeled Cfb or BWh is using a compact classification, not a forecast. Once you know what the letters summarize, the colors become easier to read and their limitations become easier to spot.
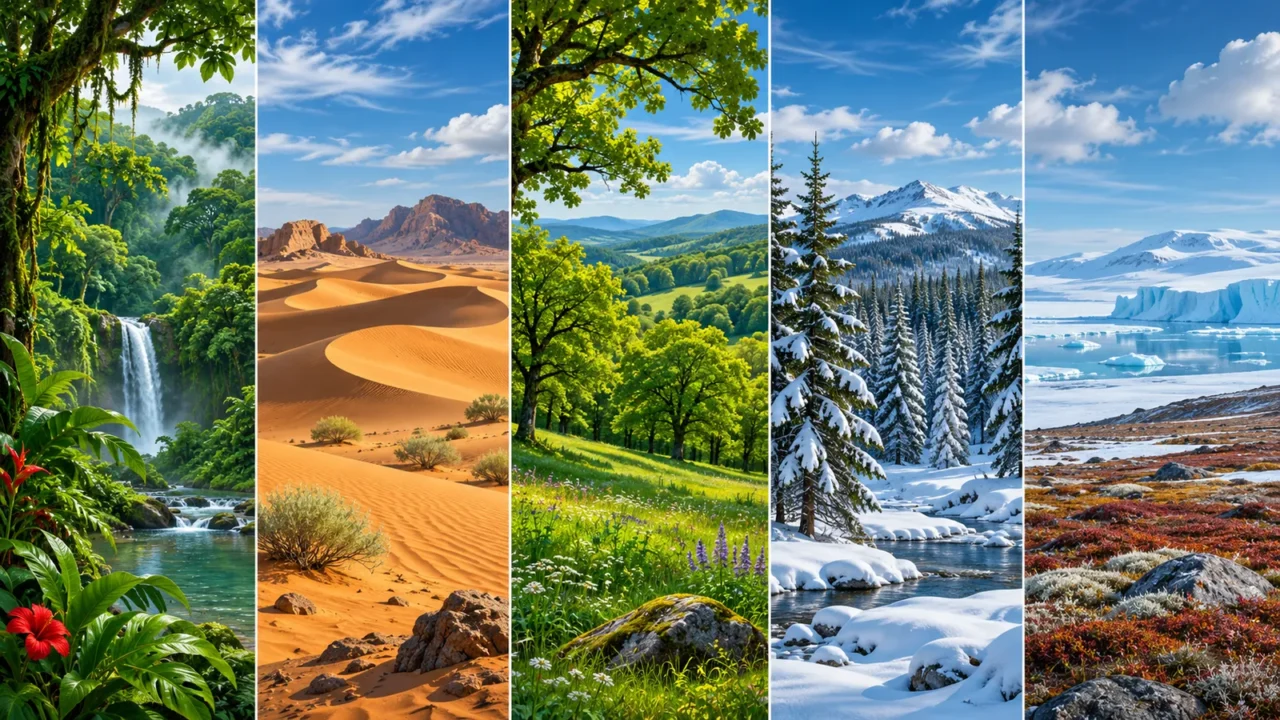
The Köppen climate classification groups places by long-term temperature and precipitation patterns. Its five main groups are tropical, dry, temperate, continental or cold, and polar. Additional letters describe seasonal moisture or temperature conditions. The code summarizes a climate pattern; it does not describe every day’s weather, every local habitat or every version of the classification.
How to use this article: You can identify the main groups, decode a complete example, or check a climate map.
What the Classification Measures
Köppen classification uses monthly temperature and precipitation statistics to summarize a place’s climate. Seasonal timing matters: two places with similar annual rainfall can fall into different classes if one has a pronounced dry summer and the other receives precipitation throughout the year.
The system grew from connections between climate and vegetation. It is useful for broad comparison, but it is not a direct inventory of the plants growing at a site. Land use, soils, disturbances and local conditions also matter.
Long-term monthly averages reduce the influence of individual unusual seasons. Standard climate normals use 30-year periods, with 1991–2020 the current standard period, as explained by NOAA’s climate-normal guide. A particular classification map may use a different period, so read its methods.
For the underlying time-scale distinction, start with weather versus climate. A single unusually cold winter does not, by itself, reclassify a place’s long-term climate.
The Five Main Köppen Climate Groups
Start with the capital letter
The Met Office’s climate-zone guide uses five main groups. Their names vary slightly between sources, especially D, which is described as continental, cold or snow climate.
| Code | Group | Main distinction |
|---|---|---|
| A | Tropical | Warm throughout the year; monthly means at least 64.4°F (18°C), after the dry-climate test |
| B | Dry or arid | Precipitation is below a temperature- and season-dependent threshold |
| C | Temperate | Relatively mild coldest month and a sufficiently warm season |
| D | Continental or cold | A colder winter than C, while retaining a sufficiently warm season |
| E | Polar | A very cool warmest month, below about 50°F (10°C) |
These are not simply five latitude belts. Elevation, continental position and atmospheric circulation affect climate. High mountains can meet cold-climate criteria far from the poles.
Nor is B just another temperature band. Peel, Finlayson and McMahon’s classification identifies dry climates first, using annual precipitation, annual temperature and rainfall seasonality. A hot place is not automatically A, and a desert need not be hot.
How the Extra Letters Add Detail
Read the code as a whole. The same position does not carry exactly the same kind of information in every group.
| Code | How to read it |
|---|---|
| Af | A tropical; f rainforest, without a qualifying dry month |
| BWh | B dry; W desert; h hot |
| BSk | B dry; S steppe or semiarid; k cold |
| Csa | C temperate; s dry summer; a hot summer |
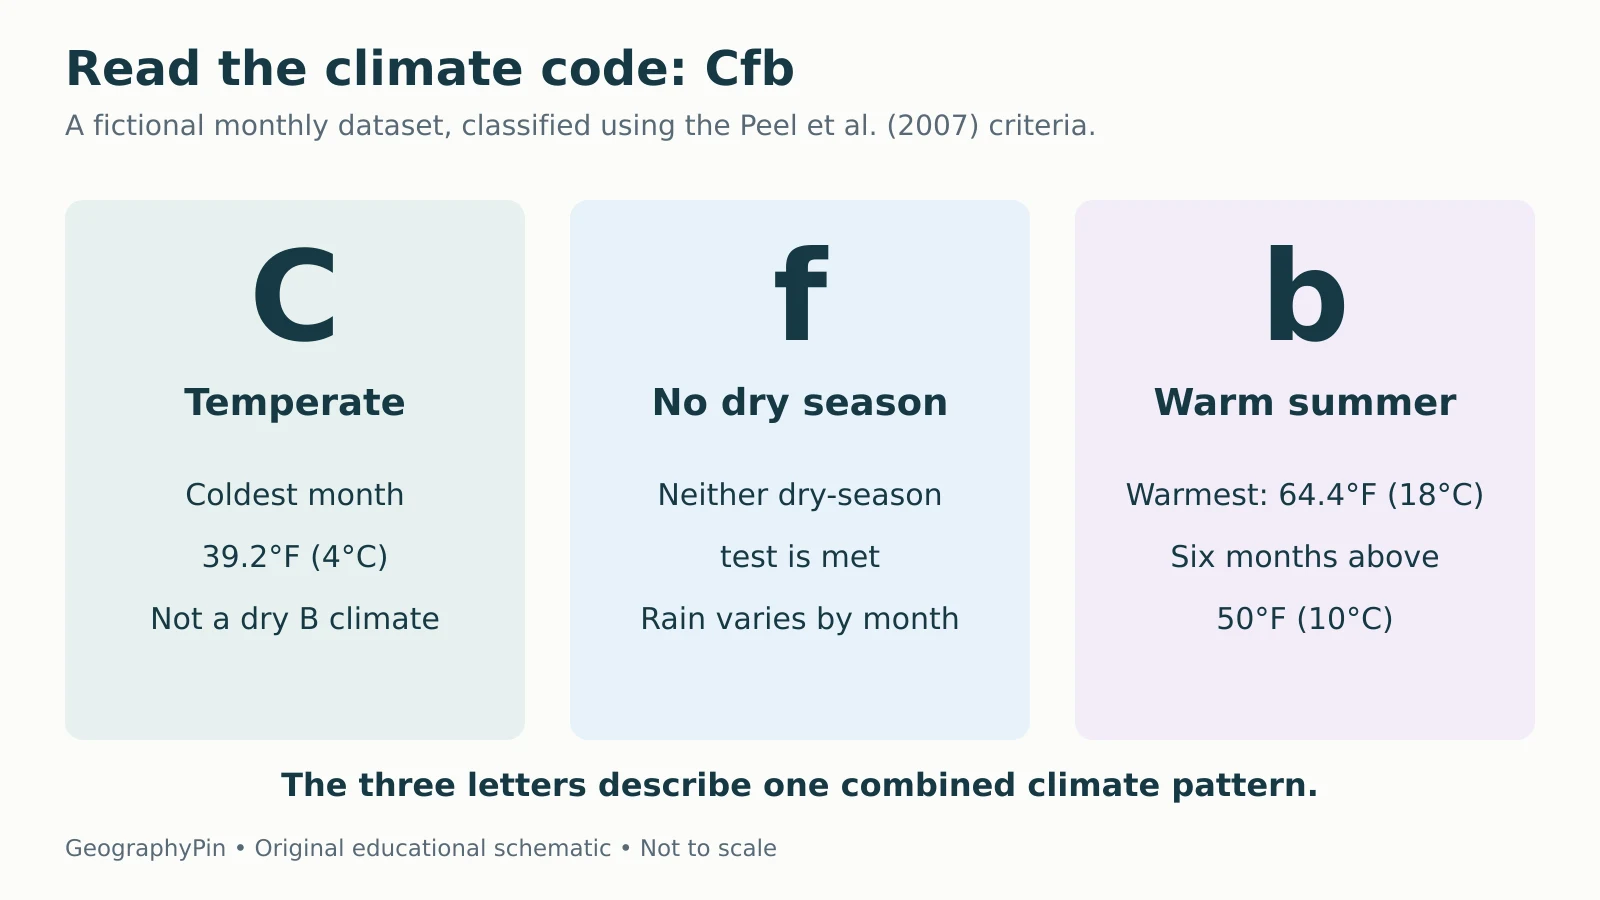
| Cfb | C temperate; f no dry season; b warm summer |
| Dfb | D cold; f no dry season; b warm summer |
| ET | E polar; T tundra |
| EF | E polar; F ice cap or frost |
For C and D, s marks dry summer, w dry winter and f no qualifying dry season. “No dry season” does not mean rain every day or equal rainfall every month. It means the monthly values do not satisfy that version’s dry-season tests.
The letters a, b and c separate summer-temperature patterns; some D classes also use d for very cold winters. B uses h and k for annual-temperature differences instead. A and E commonly have only two letters.
A Worked Example: Why This Fictional Place Is Cfb
Check the data before assigning the letters
Consider a fictional Northern Hemisphere location with a long-term monthly dataset. Its coldest month averages 39.2°F (4°C), its warmest 64.4°F (18°C), and six months average above 50°F (10°C). Its annual precipitation is about 28.54 inches (725 mm).
Applying the Peel et al. criteria to the supplied monthly data gives a dry-climate threshold of about 13.98 inches (355 mm), so this example is not B. Its coldest month places it in C rather than A or D under that version.
The driest summer month has about 1.77 inches (45 mm), so it does not pass the dry-summer test. The winter precipitation pattern does not pass the dry-winter test either. That gives f. The warmest month is below 71.6°F (22°C), with at least four months above 50°F (10°C), giving b.

| Month | Mean temperature, °F (°C) | Precipitation, inches (mm) |
|---|---|---|
| Jan | 39.2 (4) | 2.56 (65) |
| Feb | 41.0 (5) | 1.97 (50) |
| Mar | 44.6 (7) | 2.17 (55) |
| Apr | 50.0 (10) | 1.77 (45) |
| May | 55.4 (13) | 2.17 (55) |
| Jun | 60.8 (16) | 2.36 (60) |
| Jul | 64.4 (18) | 2.56 (65) |
| Aug | 64.4 (18) | 2.36 (60) |
| Sep | 59.0 (15) | 2.17 (55) |
| Oct | 51.8 (11) | 2.76 (70) |
| Nov | 44.6 (7) | 2.95 (75) |
| Dec | 41.0 (5) | 2.76 (70) |
The result is Cfb. The Met Office identifies much of the United Kingdom with this code, but that real-world example does not make every British location or every map cell identical.
Why Two Climate Maps Can Disagree
First check the rules. Köppen-Geiger classifications have multiple published implementations. For example, Peel et al. use 32°F (0°C) as the coldest-month boundary between C and D, while the Chen and Chen implementation uses 26.6°F (−3°C). A place near that boundary can receive different labels without either map being randomly colored.
Next check the period and data. A map derived from one set of station records may differ from a newer gridded dataset. Grid size, elevation representation and interpolation can affect boundaries, especially in mountains and transition zones.
Beck and colleagues’ 2023 dataset distinguishes historical observation-based classifications from future classifications based on climate-model scenarios. A future map is conditional on its scenario and methods; it is not a precise prediction of every local outcome.
A climate class can also stay unchanged while temperatures or precipitation shift within its thresholds. Conversely, a modest change near a threshold can change the label. Classification is one summary of climate, not the whole record of climate change.
Read a Climate-Zone Map in Five Steps
Check the legend before the colors
- Identify the system and version. A map with an added highland category is not necessarily using the same categories as a five-group Köppen-Geiger dataset.
- Read the reference period. Separate historical averages from future scenarios.
- Decode the whole label. Distinguish a dry summer from a hot summer, and a dry climate from a tropical one.
- Check spatial detail. A regional map cannot resolve every slope, valley or urban microclimate.
- Use the underlying data for decisions. A climate code alone does not provide flood probabilities, frost dates, daily forecasts or crop suitability.
For a boundary location, inspect nearby cells and the source’s uncertainty information rather than treating one pixel as an exact natural dividing line. The useful question is what the classification summarizes at that scale and date.
What Did We Learn Today?
Köppen codes condense long-term temperature and precipitation patterns into a main group and seasonal detail. Decode the complete label, check which rules and reference period produced it, and keep map resolution in mind. A classification helps compare climates, but it does not replace local observations, weather forecasts or a fuller assessment of changing conditions.
Sources & Data Notes
The worked Cfb example uses original fictional monthly data and the Peel et al. (2007) criteria. Other implementations differ, including the C/D boundary. Fahrenheit and inch equivalents are rounded; the classification calculations use Celsius and millimeters. This overview is a reading guide, not a complete classification algorithm or a new world climate map.