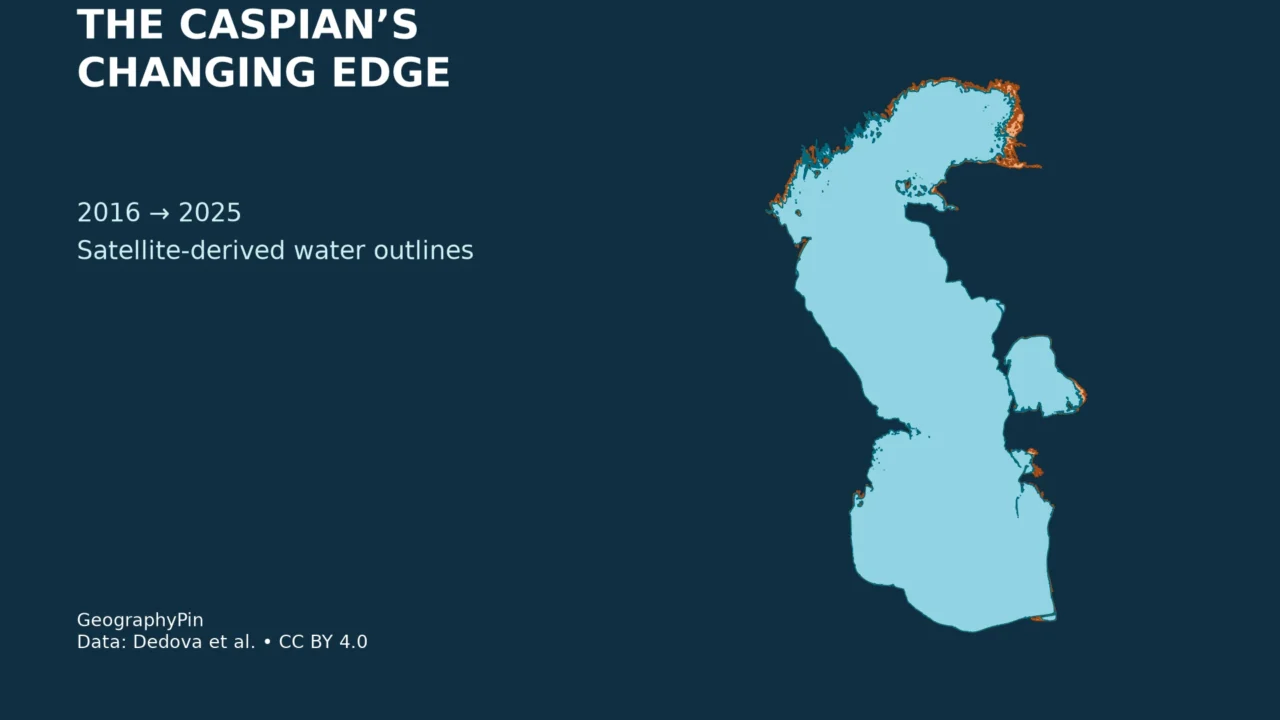
The Caspian’s outline is changing, but not by the same distance everywhere. Broad, shallow coastal zones can lose extensive mapped water while another shore moves only a short distance. Comparing dated outlines is more useful than treating every orange patch on a map as the same kind of change.
The Caspian Sea’s mapped water extent contracted between 2016 and 2025 in a published satellite-derived dataset. Our maps compare those annual outlines and measure five selected east–west water-edge shifts. They show local differences, not a uniform retreat rate. The observations are historical composites, not a live coastline or a forecast.
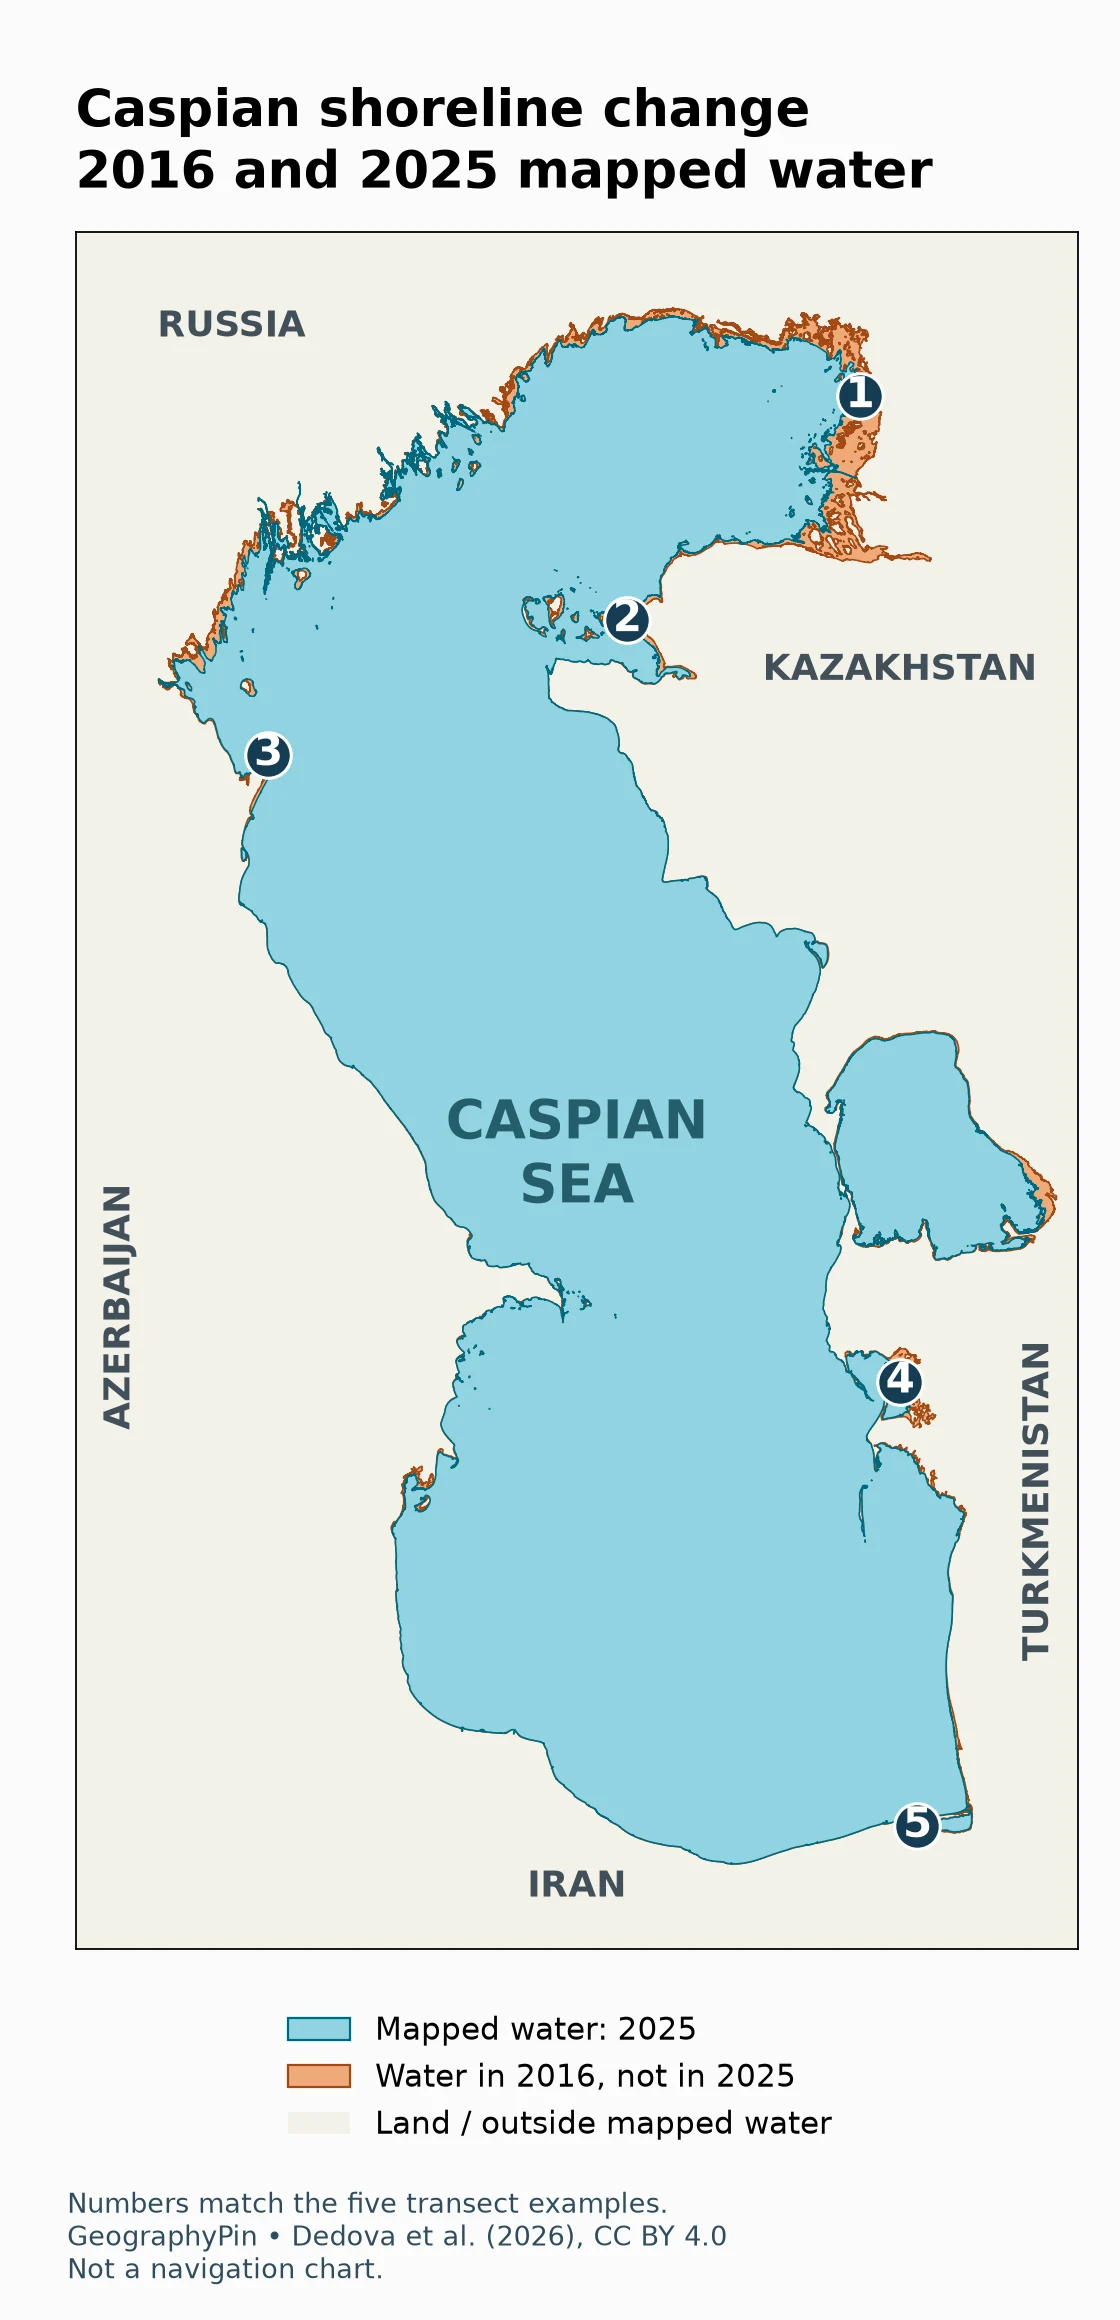
1. The dated comparison map
These outlines come from Dedova and colleagues’ 2026 study and its openly licensed geospatial supplement. The source created annual water masks using Harmonized Landsat–Sentinel and supplemental Sentinel-2 imagery around the annual maximum water level. The associated peak dates are July 30, 2016 and June 5, 2025; each outline represents a multi-image composite around its peak, not a photograph taken on that date alone.
| Map | Location | Water-edge shift | Direction |
|---|---|---|---|
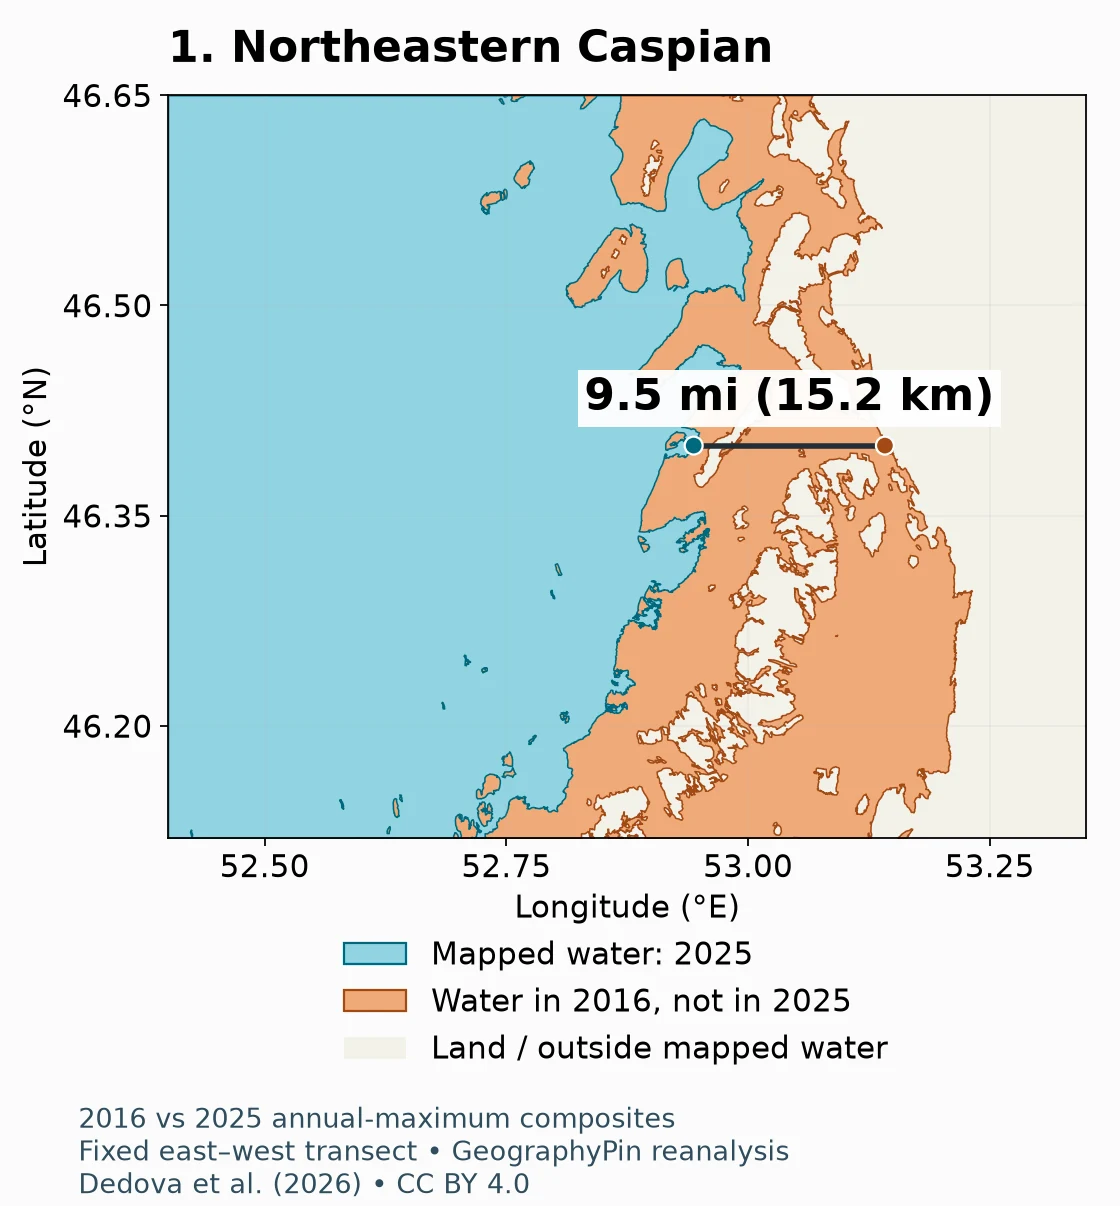
| 1 | Northeastern Caspian | About 9.5 mi (15.2 km) | West |
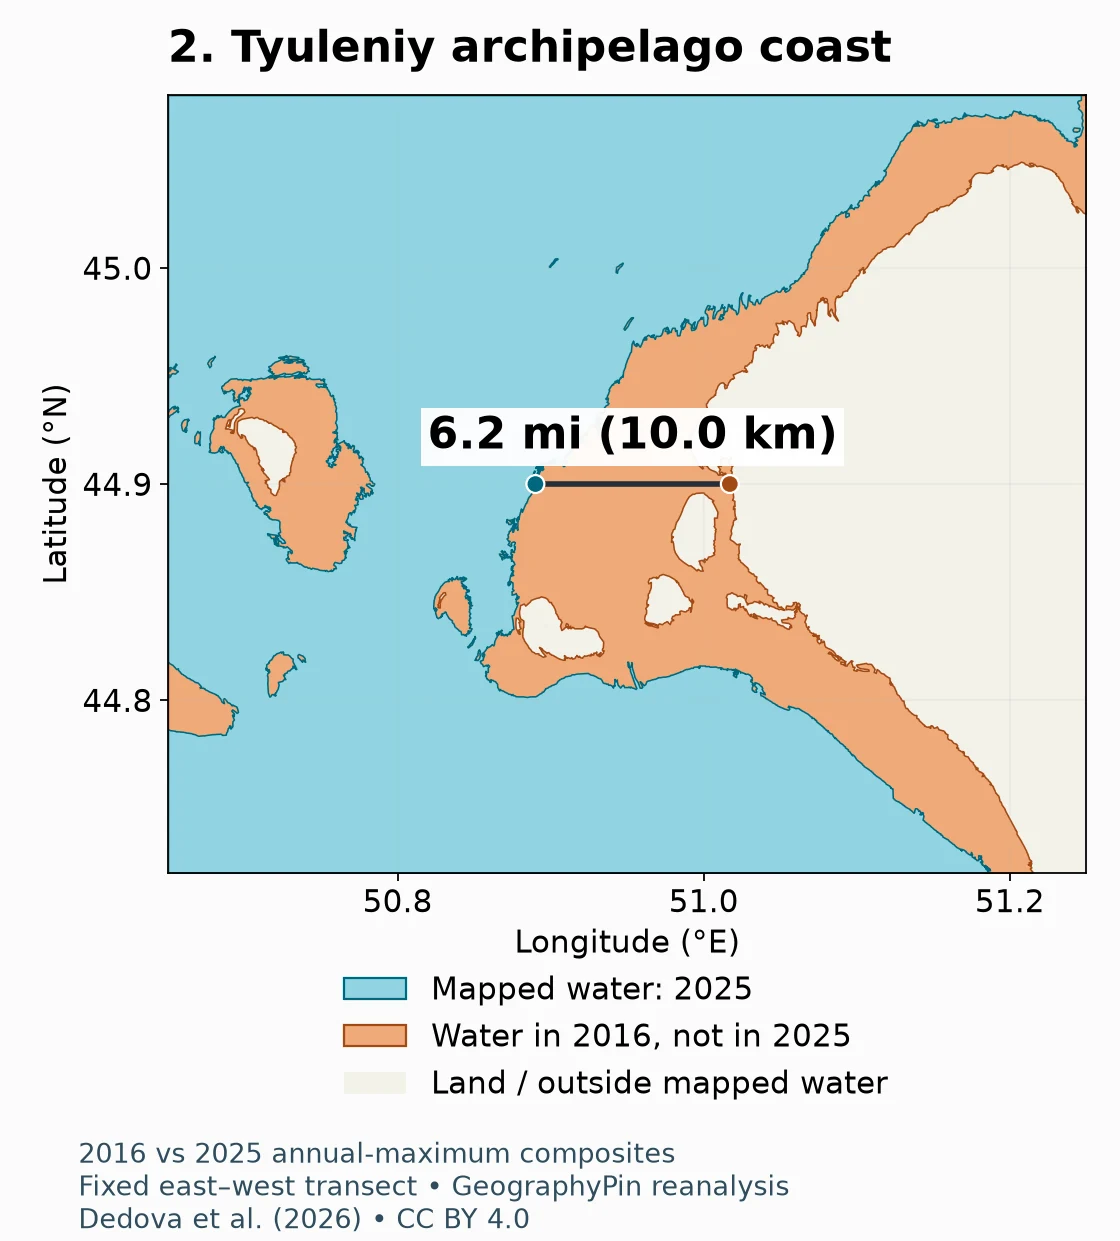
| 2 | Tyuleniy archipelago coast | About 6.2 mi (10.0 km) | West |
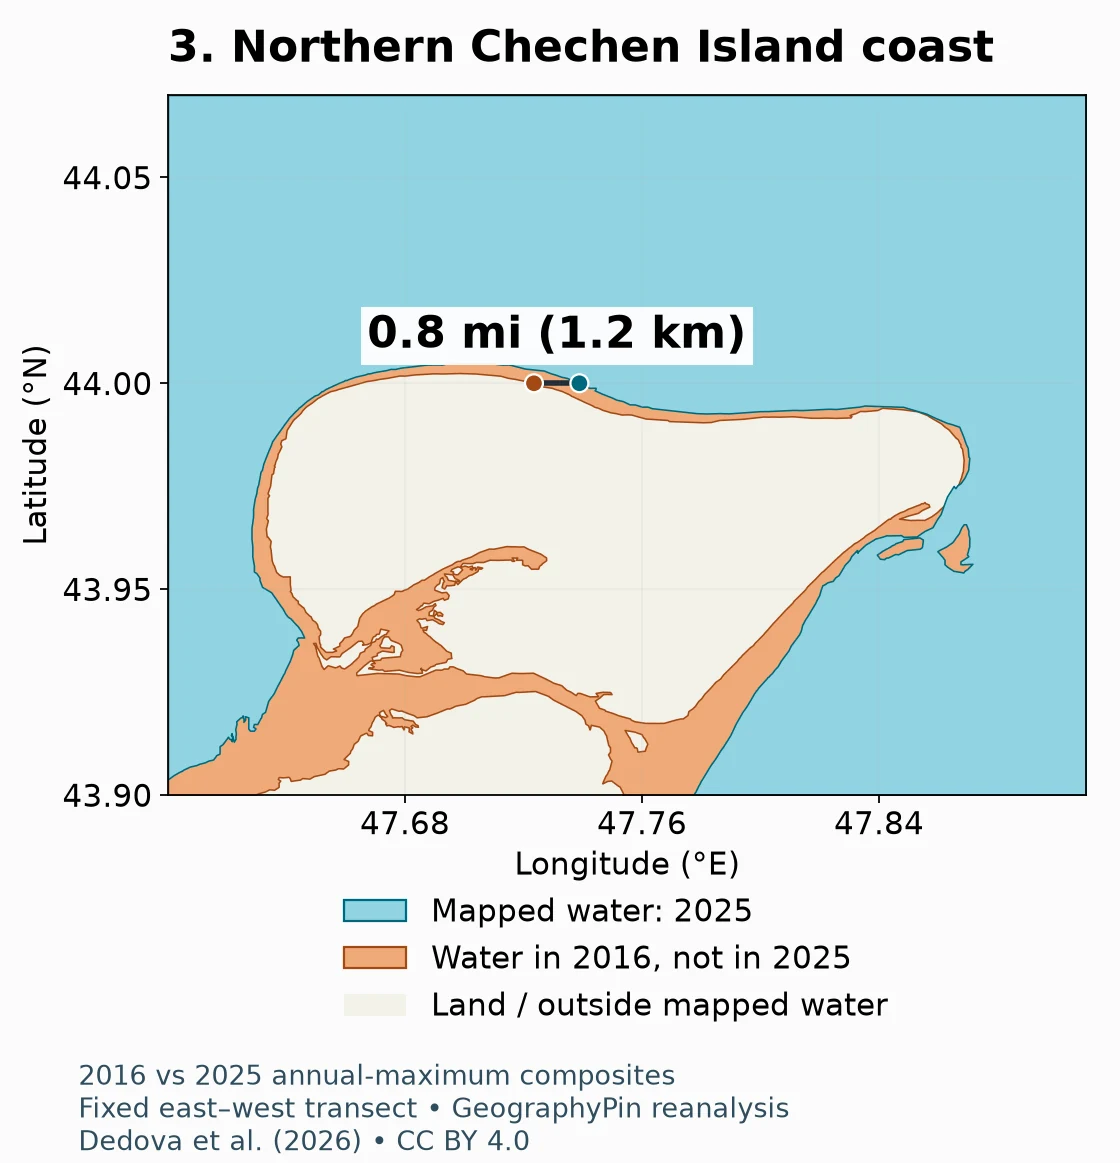
| 3 | Northern Chechen Island coast | About 0.8 mi (1.2 km) | East |
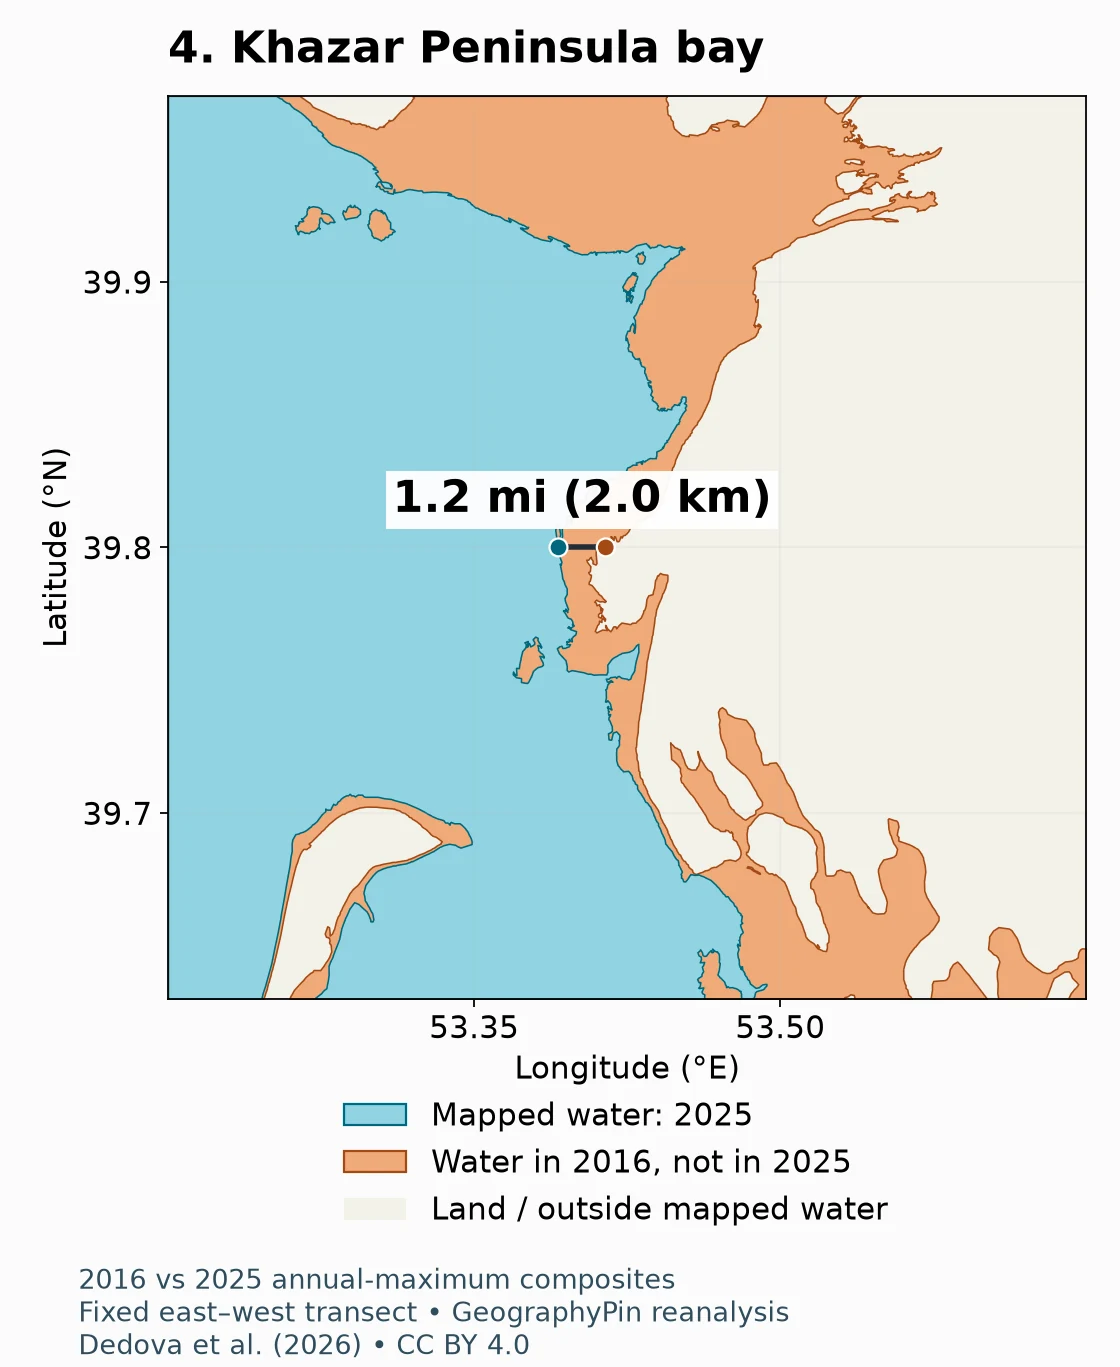
| 4 | Khazar Peninsula bay | About 1.2 mi (2.0 km) | West |
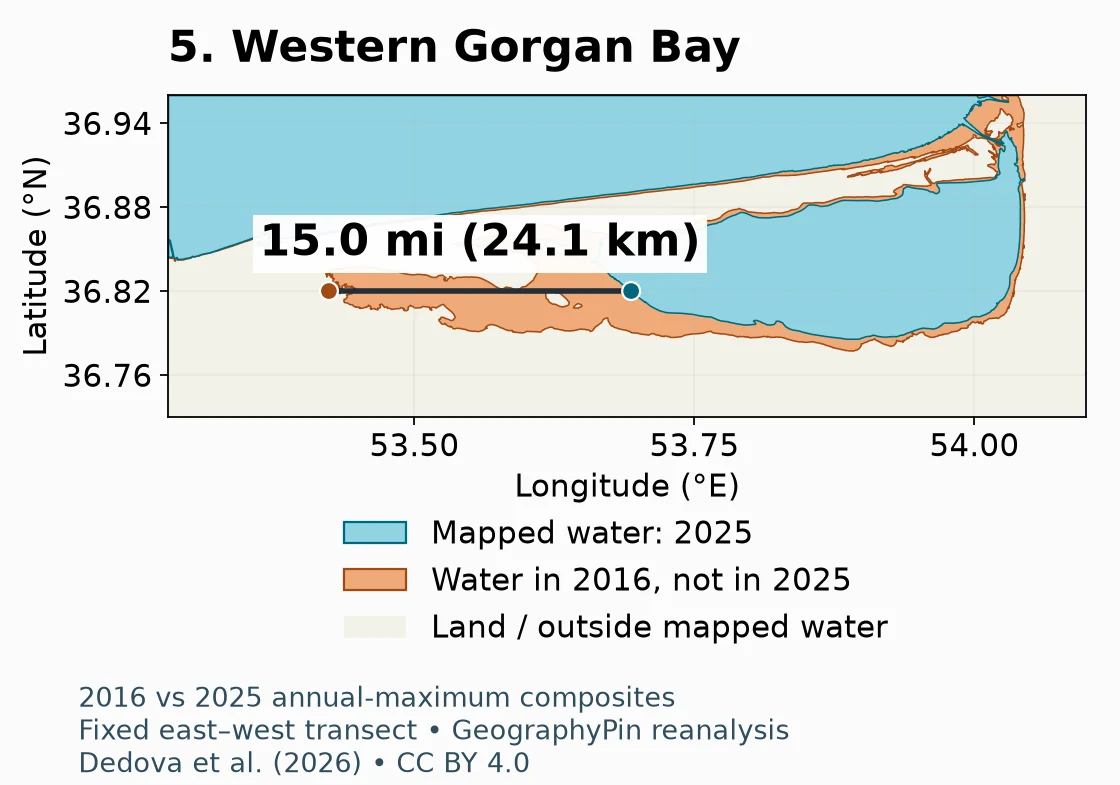
| 5 | Western Gorgan Bay | About 15.0 mi (24.1 km) | East |
The direction is the movement of the selected intersection along its fixed latitude, not a direction applying to every shore in that region. The line is not necessarily perpendicular to the coast. These examples were chosen to illustrate contrasting coastal settings; they are not a statistically representative sample of the entire Caspian.
2. Five local shoreline examples
1. A broad northeastern change
The northeastern example lies on Kazakhstan’s shallow Caspian margin. At 46.4°N, the selected easternmost mapped water edge moved west by about 9.5 miles (15.2 km). Numerous small channels and patches interrupt the former water area. The measurement joins two selected outer intersections; it does not mean that every point along the connecting line was continuously open water in 2016.
2. The coast near the Tyuleniy archipelago
At 44.9°N, the selected mainland-side edge near the Tyuleniy archipelago moved west by about 6.2 miles (10.0 km). This is the Kazakh archipelago region, not the separate Tyuleny Island off Russia. The panel shows changing channels and island connections, but the transect itself measures one water-edge position rather than the total change in island area.
3. Northern Chechen Island coast
At 44.0°N on the northern side of Chechen Island, the selected eastern intersection moved about 0.8 miles (1.2 km) east. This small horizontal shift contrasts with the larger changes above. It is not a measurement perpendicular to the northern beach. The source study also discusses changing connections between the island and mainland; a dated water mask is not a guarantee that a crossing is safe or accessible.
4. A bay along the Khazar Peninsula
At 39.8°N, the selected eastern water edge in a bay by Turkmenistan’s Khazar Peninsula moved roughly 1.2 miles (2.0 km) west. The pattern includes narrow embayments and small remnants of mapped water. A local bay can respond differently from an exposed outer coast, so this value should not be described as the retreat distance of the entire peninsula.
5. Western Gorgan Bay
The selected westernmost mapped water intersection at 36.82°N moved about 15.0 miles (24.1 km) east. This is an outer-edge comparison in western Gorgan Bay, Iran, including fragmented water near the older edge. It is not a continuous 15-mile stretch of former navigable water, nor an average retreat for Iran’s Caspian coast. Small changes in transect placement can produce substantially different distances in a shallow, irregular bay.
3. How the measurements were made
GeographyPin did not independently classify raw satellite images. We reanalysed the authors’ published water polygons, supplied in a GeoPackage with ten annual records from 2016 through 2025. That distinction matters: the maps are original visualizations and calculations based on an existing extraction, not a second independent satellite survey.
The source used a harmonized optical-imagery workflow at 98-foot (30 m) pixel spacing, drawing on Sentinel-2 and Landsat products, selecting imagery around annual water-level maxima and applying water identification and correction procedures. Its supplement includes the extraction code and annual water polygons. Choosing annual maxima helps define a consistent hydrological comparison, but does not make June and July identical seasons or remove wind, weather and compositing effects.
- Read the 2016 and 2025 polygons and transform their projected coordinates to WGS84 longitude and latitude.
- Define five fixed-latitude lines with recorded longitude limits.
- Intersect each line with each annual polygon boundary. Select the easternmost intersection for sites 1–4 and the westernmost for site 5 within those limits.
- Calculate the WGS84 geodesic distance between the two selected points.
- Inspect each overlay and retain the full selection rule, coordinates and unrounded calculation in the supporting CSV.
Download the five-transect measurements (CSV). The latitude, longitude span and edge-selection rule are part of the result: changing them can change the answer. Extra decimal places in the downloadable coordinates support reproduction, not a claim of matching positional accuracy.
What the measurements cannot tell us
A 98-foot (30 m) source pixel is not a ±98-foot accuracy guarantee. Wet mud, shallow water, vegetation, waves, mixed pixels, composite timing and manual mask corrections can affect the mapped edge. The study compares selected northeastern validation areas with higher-resolution imagery, but that is not a complete error estimate for every point used here. We have not established a total positional confidence interval for these five measurements.
The displayed distances are rounded to one decimal place for consistency, not because each is accurate to that decimal. In fragmented coasts, the outermost boundary may belong to a small water patch rather than a continuous main-water edge. For this reason, use the figures as dated, method-specific comparisons and do not convert them into annual rates, property boundaries, navigation advice or port-access assessments.
4. Why shoreline responses differ
Water-level change and shoreline movement are different quantities. On a gently sloping coastal surface, a modest vertical fall can expose a wide strip of land. On a steeper shore, the same vertical change may move the water edge much less. Islands, spits, channels and shallow bays complicate the response further.
The shallow northern Caspian is therefore especially important in shoreline-change mapping. Yet a simple north-versus-south division is insufficient: the Gorgan Bay example shows that a shallow southern embayment can also experience a large horizontal change. Local topography and the chosen measurement line matter more than latitude alone.
These two annual outlines cannot reveal everything that happened between their dates. A temporarily flooded patch, a storm-driven water excursion or a seasonal channel may not appear in the comparison. Orange means “mapped as water in 2016 but not in 2025,” not automatically permanent dry land.
5. Causes and consequences
A water balance, not one isolated cause
The Caspian has no natural outlet to the world ocean. Its level reflects the balance of river inflow, precipitation and other inputs against evaporation and other losses. Warming can increase evaporative demand, while changes in runoff and water use across the drainage basin can alter the inflow reaching the sea. The Kura River is one of the rivers supplying the Caspian; the much larger Volga is central to its basin-wide water budget.
Recent research by Duku and colleagues specifically cautions against explaining the observed decline through increased evaporation alone. Their water-budget analysis considers multiple contributing changes and uncertainties. A shoreline overlay does not measure those causal contributions: it records a change in mapped water extent, while attribution requires additional hydrological evidence.
For readers needing the wider setting, our Caspian Sea profile explains the inland sea’s geography. Here the focus is the dated change in its coastal outline.
Why coastal communities and ecosystems care
UNEP describes risks to coastal economies and ecosystems as water retreats. Ports and coastal infrastructure may face a changing relationship with the water; wetlands, shallow habitats and island connections can also change. These are practical reasons to monitor the coast rather than treating the shrinking outline as only a cartographic curiosity.
However, a map of surface water cannot establish water depth, channel maintenance requirements, economic losses or the condition of a particular wildlife population. Those questions need local surveys and ecological or operational data. None of the five transect values should be used to declare a named port closed or a wetland completely lost.
6. Observed change versus future scenarios
The latest outline in this comparison is 2025, even though the study was published in 2026. Publication year and observation year are not interchangeable. The map does not establish the shoreline on the day you read this article.
Future Caspian water levels depend on climate and hydrological conditions that cannot be reduced to extending one horizontal distance at a fixed annual rate. A projection based on a climate scenario is a different product from an observed satellite-derived outline. We therefore show no speculative future coastline and do not extrapolate the five local measurements to 2050 or 2100.
A useful future update would repeat the same transects against a comparable, validated annual dataset, keeping the original dates and calculations available. Mixing an annual-maximum composite with an arbitrary dry-season image could produce an eye-catching but misleading comparison.
Frequently Asked Questions
Is the Caspian Sea shrinking everywhere by the same amount?
No. The published outlines show varied coastal responses. Shallow slopes, islands, channels and bays can produce very different horizontal shifts for a changing water level.
Are these before-and-after satellite photographs?
No. They are maps of water polygons extracted by the source researchers from satellite composites. GeographyPin redraws those polygons and calculates selected transect distances; the panels are not raw photographs.
Why is the Gorgan Bay distance so large?
The comparison uses the westernmost mapped water edge along one fixed latitude in a shallow, irregular bay. The older edge includes fragmented water. It is not a regional average or a continuous former shipping channel.
Does shrinking water area prove that evaporation is the only cause?
No. Evaporation, river inflow and the wider basin water balance must be studied together. The shoreline maps alone cannot attribute the decline to individual drivers.
Can I use these maps for navigation?
No. They contain no current depth soundings, channel surveys or navigation warnings. They are educational comparisons of historical mapped water extent.
What Did We Learn Today?
The Caspian’s changing coastline is not one uniform retreat. Comparing 2016 and 2025 satellite-derived water outlines reveals contrasting local responses, from short shifts near Chechen Island to much wider changes in shallow margins and bays. Every quoted distance depends on its dates, line placement and boundary-selection method; none substitutes for a live survey or explains the entire water balance.
Sources & Data Notes
- Dedova et al. (2026), Multi-source remote sensing approach for monitoring the Caspian Sea shoreline dynamics: source imagery, extraction procedure, annual composites and geographic interpretation.
- Open geospatial supplement: 2016–2025 water polygons and extraction code, CC BY 4.0. GeographyPin transformed the geometry, selected the transects, calculated distances and designed these maps. These adaptations are not endorsed by the source authors.
- Duku et al. (2026), Earth’s Future: water-budget research and the limitations of an evaporation-only explanation.
- UNEP, The race to save the vanishing Caspian Sea: regional environmental and community context.
- Creative Commons Attribution 4.0: underlying polygon-data license. No third-party satellite photograph has been reproduced.
Method: fixed-latitude boundary intersections and WGS84 geodesic distances. The supporting CSV records both selected endpoints, line limits and direction. Distances are rounded comparisons, not a quantified positional accuracy claim. The maps use the source’s annual-maximum composites, not matched individual acquisition dates. No future coastline is drawn.