The colored lines on a weather map describe boundaries in the atmosphere. Their triangles and semicircles tell you more than “bad weather here.” They identify different kinds of fronts, and their placement helps you understand what is moving.
A weather front is a transition zone between air masses with contrasting properties, especially temperature. Cold and warm fronts describe one air mass replacing another at the surface. A stationary front moves little, while an occluded front forms as warm air is lifted away from the surface. Each has a distinct weather-map symbol.
How to use this article: You can understand the boundary, decode the four symbols, separate fronts from rainfall, or practice reading a map.
A Front Is a Boundary With Vertical Structure
Air masses differ, but cold is relative
An air mass is a large volume of air with broadly similar temperature and moisture characteristics. It develops over a source region and can change as it travels. NOAA’s air-mass guide explains how these properties help distinguish neighboring air masses.
At a front, those properties change across a transition zone. A line on a surface map simplifies that zone into a boundary at ground level. The front also extends upward through the atmosphere, often as a sloping surface. It is not a vertical fence.
The names are relative. A cold front can bring air that is still warm by everyday standards if it replaces even warmer air. Conversely, a warm front does not promise beach weather. Identify the change between the air masses rather than relying on the season or your preferred temperature.
This is a short-term atmospheric feature. The weather-versus-climate guide explains why following a front today is different from describing a region’s long-term climate.
Cold and Warm Fronts Describe Replacement
With a cold front, colder air advances into an area occupied by warmer air. The denser advancing air can undercut the warmer air, helping lift it. With a warm front, warmer air advances as colder surface air retreats; warm air also rises over the cooler air ahead.
The Met Office’s front guide connects these processes with the familiar blue and red symbols. Think about which air replaces which at the surface. Warm air rising over cold air is part of the structure, not a claim that the advancing warm air tunnels beneath it.
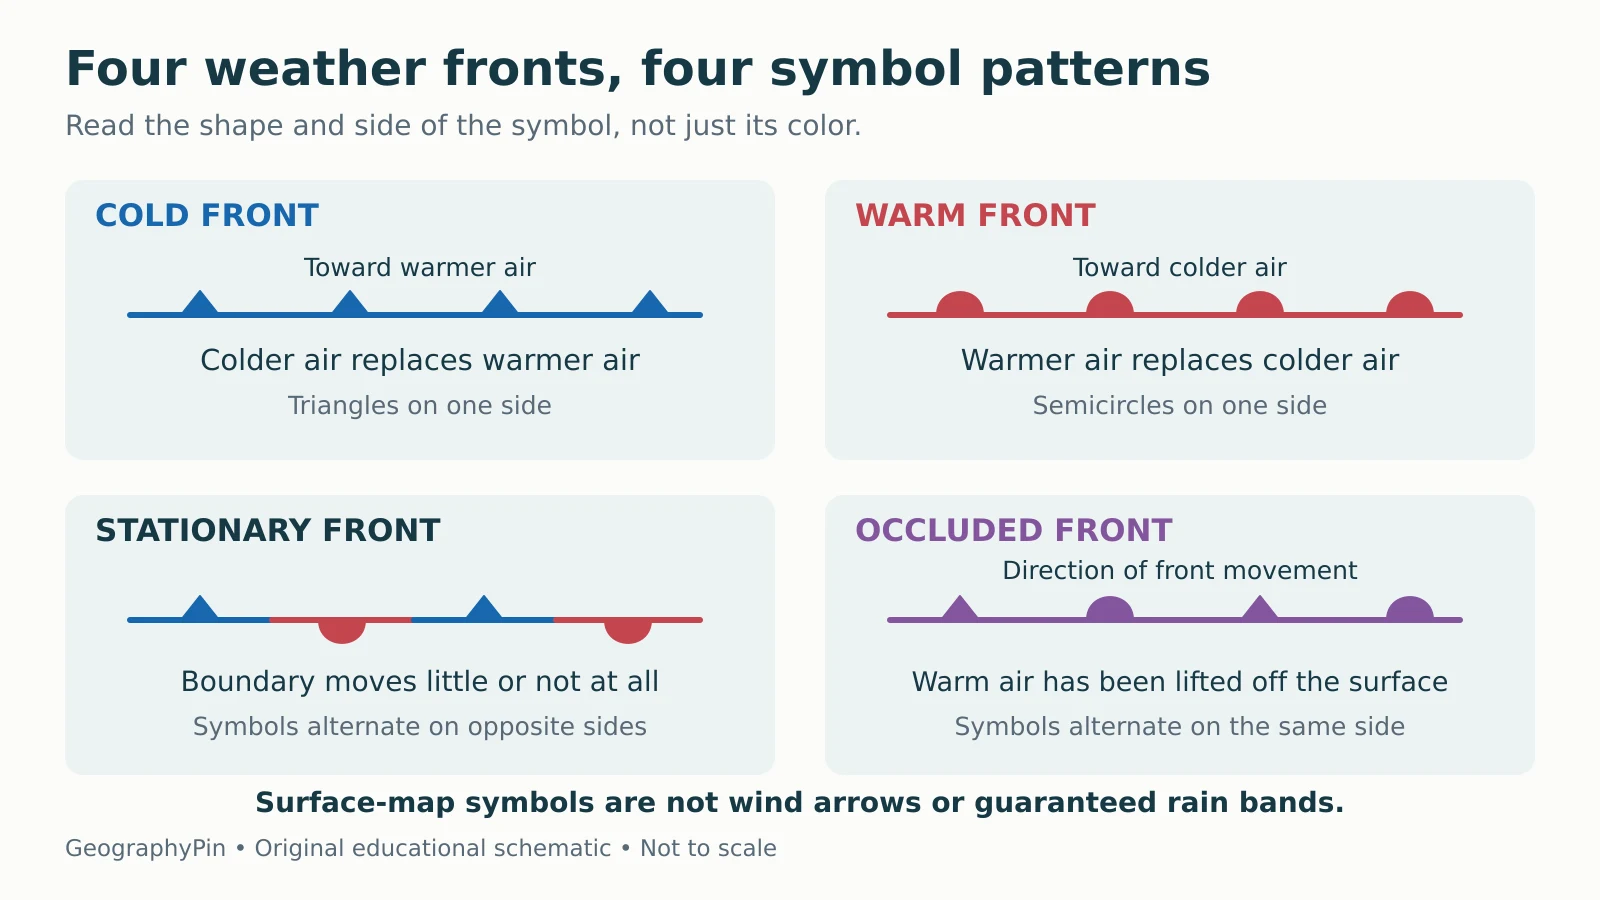
| Type | What the boundary represents | Standard surface-map symbol |
|---|---|---|
| Cold | Colder air replacing warmer air | Blue line and triangles on one side |
| Warm | Warmer air replacing colder air | Red line and semicircles on one side |
| Stationary | Little or no boundary movement | Alternating blue triangles and red semicircles on opposite sides |
| Occluded | Warm air lifted away from the surface as fronts join | Purple line with alternating triangles and semicircles on the same side |
Cold fronts often have a steeper structure than warm fronts. That helps explain a common contrast between a narrower band of showers at a cold front and broader layered clouds ahead of a warm front. These are tendencies, not a complete forecast.
Stationary and Occluded Fronts Need Different Questions
For a stationary front, ask whether the boundary is moving across the map. It can remain nearly in place while air continues to flow on either side. Stationary does not mean windless, and it does not mean dry.
If conditions change, the boundary can begin advancing as a cold or warm front. It can also weaken. A stationary symbol describes the analyzed situation, not a promise that the front will remain there for several days.
In the classic development of an occluded front, a cold front catches up with a warm front and the intervening warm air is lifted from the surface. The UCAR explanation shows why an occlusion combines features of the two fronts.
The air behind the former cold front is not necessarily colder than the air ahead of the warm front. NOAA distinguishes cold and warm occlusions according to that relationship. Both use the same purple symbol. The symbol alone therefore cannot supply the complete vertical temperature structure.
Read the Shapes and Their Side of the Line
The symbols identify a boundary, not the wind
For a cold front, triangles point toward the warmer air being displaced. For a warm front, semicircles sit on the side toward which the front advances. Occluded-front triangles and semicircles alternate on the same side, indicating movement of that boundary.
A stationary front puts the two shapes on opposite sides. Do not read them as two simultaneous travel arrows. The alternating pattern identifies a boundary with little or no movement.

A front symbol is not a wind-direction arrow. Winds can approach, cross or blow along a boundary, and the wind experienced at one location need not match the direction the front advances. Use the chart’s wind observations or forecast layer for that separate question.
A Front Does Not Guarantee Rain or Thunderstorms
Moisture, lift and instability matter
Frontal lifting can cool rising air enough for clouds to form. Whether precipitation develops also depends on available moisture and the atmosphere’s structure. The National Weather Service’s illustrated explanation makes these conditions explicit: sufficient moisture can support rain, while instability can allow thunderstorms.
Consequently, a front can pass with a temperature or wind change and little rain. A warm front can sometimes support thunderstorms, and a cold front does not always produce them. Precipitation may occur ahead of the surface line because the frontal structure extends above the ground.
Do not infer the rain’s exact timing, intensity or location from the line alone. Check the current local forecast, radar and official warnings for decisions about travel or outdoor plans. An educational symbol key has no information about today’s hazards.
Practice: What Can the Map Actually Tell You?
Keep the conclusion within the evidence
Imagine a fictional map with a blue front west of a town and triangles pointing east. The town is ahead of an eastward-moving cold front. It is reasonable to look for colder air replacing the warmer air when the front passes.
It is not reasonable to say, from that symbol alone, that the front will arrive at 4 p.m., produce a thunderstorm or lower the temperature by a particular amount. You would need the map’s valid time, later observations or forecasts, and more atmospheric information.
Now replace the blue line with a stationary-front pattern. The correct reading becomes “the boundary is moving little,” not “nothing is happening.” Replace it with a purple occlusion, and the pattern identifies an occluded boundary without telling you which cool air mass is colder.
Before using any real chart, check its legend, valid date and time, geographic coverage, and whether it is an analysis or forecast. A forecast chart represents expected conditions at its valid time; an older analysis is not a live map. Comparing the correct charts is more useful than treating one symbol as a complete prediction.
What Did We Learn Today?
Weather fronts mark transitions between contrasting air masses. Cold and warm fronts describe surface replacement, stationary fronts move little, and occlusions lift warm air away from the surface. Read symbol shape and placement alongside the map’s time and purpose. A front is not a wind arrow, a rain boundary or a complete local forecast.
Sources & Data Notes
This guide explains standard surface-map conventions. Its original diagram is a symbolic key, not a current weather map or a vertical cross section. The town example is fictional. Weather descriptions are conditional tendencies; local forecasts and official warnings remain necessary for practical decisions.