Imagine palm-like forests and crocodile relatives living far closer to the poles than today—and seas warm enough to reshape currents worldwide. That’s the Eocene: a long stretch of deep time when Earth ran hot, shorelines sat differently, and many “modern-style” ecosystems were taking shape.
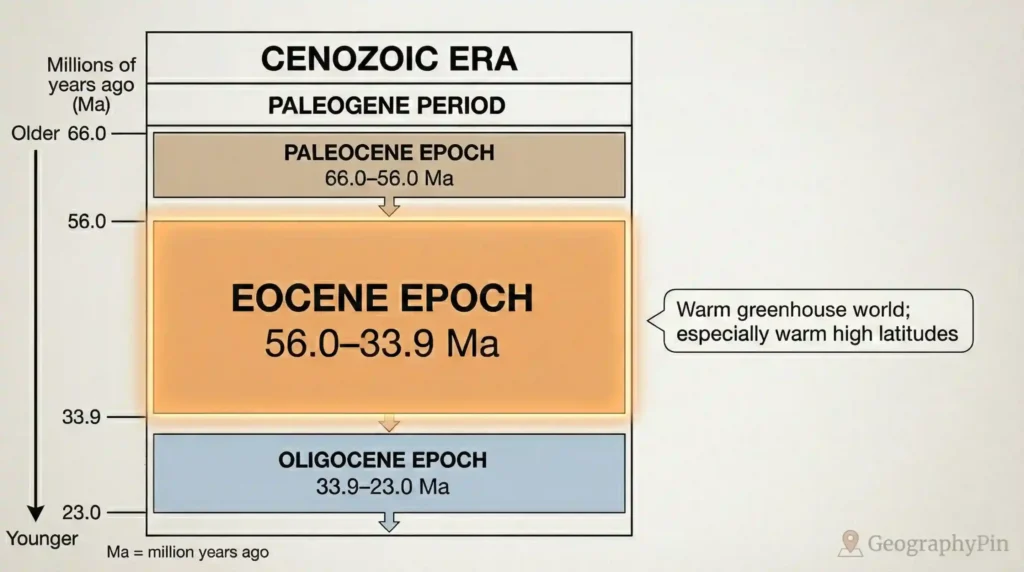
The Eocene (56.0 to 33.9 million years ago) was a warm “greenhouse” epoch early in the Age of Mammals. For much of it—especially the early Eocene—polar ice was limited, high latitudes were far warmer than today, and forests reached places that are tundra now. The epoch ends with a major cooling step and Antarctic ice growth.
How to use this article: If you want a fast definition, jump to the 15-second check. If you want the official dates and stage names, go to the Eocene timeline. If you came for the “why,” start at why Earth was a greenhouse world. If you’re here for the big shift, jump to how the Eocene ended.
- When: 56.0–33.9 million years ago (Ma).
- What it’s known for: an early peak of extreme warmth, warm high latitudes, and minimal long-lived polar ice for much of the epoch.
- How it ends: a cooling threshold is crossed near 33.9 Ma, and Antarctic ice expands (Eocene–Oligocene transition).
What the Eocene Was (and Where It Fits in Geologic Time)
The Eocene is an epoch inside the Paleogene Period (Cenozoic Era—the broad “Age of Mammals”). It begins at 56.0 Ma and ends at 33.9 Ma. Those are not random numbers: they’re part of the standardized geologic time scale used worldwide.
If the Eocene feels like a single “hot era,” it helps to remember it lasts about 22 million years. Climate doesn’t stay fixed for that long. The early Eocene includes some of the warmest conditions of the entire Cenozoic; the late Eocene cools and becomes more seasonal, setting up the threshold jump into the Oligocene.
Eocene Timeline (Official Stages + The Big Climate Beats)
Geologists subdivide the Eocene into four official stages. These names show up in museum labels, papers, and fossil site descriptions—so knowing them makes reading about the Eocene much easier.
| Stage | Approx. age range | Plain-English cue |
|---|---|---|
| Ypresian | 56.0–48.07 Ma | Early Eocene warmth ramps up; classic “hot Earth” mood. |
| Lutetian | 48.07–41.03 Ma | Still warm overall; climate begins a longer cooling slide. |
| Bartonian | 41.03–37.71 Ma | Cooling continues; seasonality becomes more noticeable. |
| Priabonian | 37.71–33.9 Ma | Late Eocene; the runway into Antarctic glaciation. |
Timeline at a Glance (what most people mean by “the Eocene”)
The Eocene’s headline story isn’t just “warm.” It’s warm early, then cooling over time, and finally a threshold shift near the end that allows a major Antarctic ice sheet to grow.
| Time slice | What’s happening |
|---|---|
| ~56 Ma (start) | The planet enters the Eocene; a major carbon-cycle warming event at the boundary (PETM) is often discussed alongside the “start-of-Eocene heat story.” |
| ~53.3–49.1 Ma | Early Eocene Climatic Optimum (EECO): one of the warmest sustained intervals of the Cenozoic. |
| Middle → late Eocene | Long cooling trend and rising seasonality; ocean gateways and circulation keep evolving. |
| 33.9 Ma (end) | Eocene–Oligocene transition: a major cooling step and Antarctic ice expansion shift Earth toward an “icehouse” mode. |
Why Earth Was a Greenhouse World in the Eocene
The Eocene’s warmth wasn’t a magic switch. It’s what you get when greenhouse gases are higher, the oceans store enormous heat, and feedbacks push the system toward a stable warm state. The physics is simple: more greenhouse gases trap more outgoing heat. The interesting part is the chain reaction—warmer air holds more water vapor, warm oceans change circulation, and limited polar ice reduces cooling from bright, reflective surfaces.
Think “carbon balance,” not one single cause
Over millions of years, atmospheric CO₂ is shaped by a tug-of-war: sources (like volcanic outgassing and carbon released from sediments) versus sinks (like chemical weathering and the burial of organic carbon). If sources win for long enough, the baseline climate warms. If sinks win for long enough, the baseline cools.
The Eocene is especially famous for showing both: a warm baseline plus sharp “punches” of extra carbon that cause rapid warming events.
The PETM: the famous early heat spike
One of the best-known events near the start of the Eocene is the Paleocene–Eocene Thermal Maximum (PETM). Multiple lines of evidence point to rapid warming alongside a large carbon-cycle disruption, with global temperature increase commonly estimated around ~5–8°C (~9–14°F) (exact values depend on the proxy and region).
The EECO: sustained peak warmth
The Early Eocene Climatic Optimum (EECO) is often treated as the “peak sustained warmth” chapter. One synthesis of global mean surface temperature reconstructions reports EECO warmth on the order of ~10–16°C (~18–29°F) above pre-industrial estimates (method-dependent, with wide uncertainty bands).
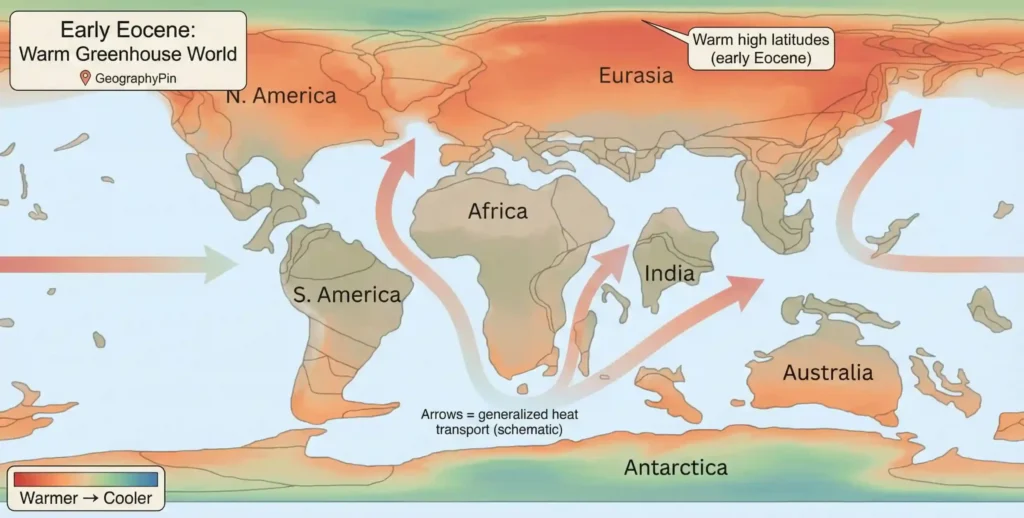
That number can sound abstract, so here’s the practical meaning: warm conditions reach far into high latitudes, and the planet’s temperature contrast between equator and pole becomes less extreme than today.
What a Warmer Eocene Planet Looked Like (Poles, Seas, and Oceans)
“Greenhouse world” doesn’t mean the whole planet becomes one uniform sauna. It means Earth’s baseline is warmer, and the biggest differences show up where modern climate is most constrained: the poles, ice, and coastlines.
Greenhouse vs. icehouse (quick comparison)
| Feature | Eocene-style greenhouse | Modern icehouse (today) |
|---|---|---|
| Polar ice | Limited for much of the epoch; big Antarctic ice arrives near the end. | Large Antarctic ice sheet + Greenland ice; seasonal sea ice in both polar oceans. |
| High latitudes | Much warmer; forests and diverse ecosystems expand poleward. | Cold-limited; tundra/ice dominate near poles. |
| Sea level | Generally higher when big ice is absent; coastlines sit differently. | Lower than many greenhouse intervals because large ice stores water on land. |
| Big “threshold” moments | Cooling reaches a point where Antarctic ice can persist and grow. | Ice sheets respond strongly to warming/cooling, affecting sea level and albedo. |
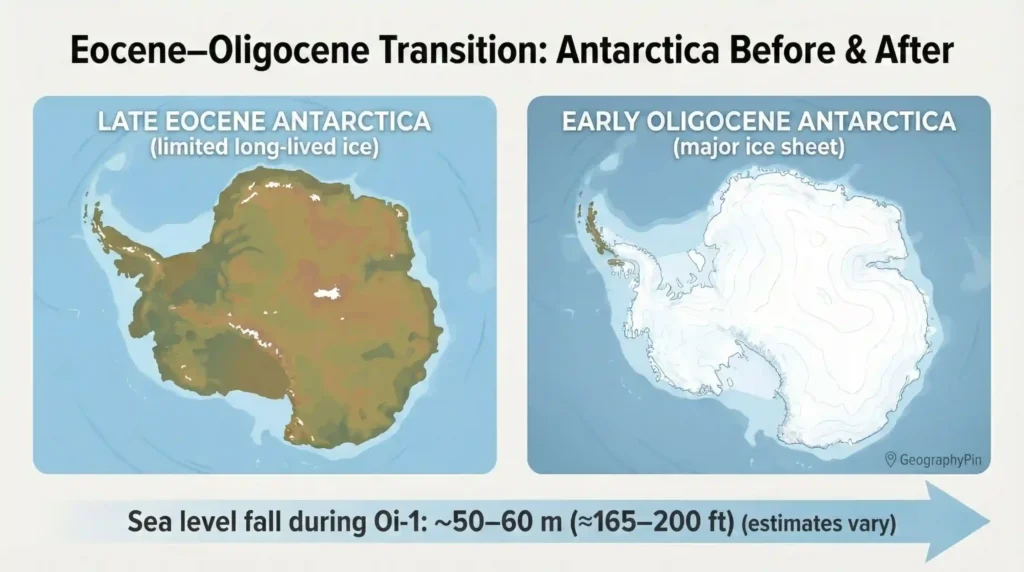
Sea level: why coastlines looked different
Without large ice sheets, less water is locked on land, so global sea level tends to be higher. By contrast, when ice sheets expand, sea level can drop quickly in geologic terms. Across the Eocene–Oligocene transition, studies often infer a major sea-level fall on the order of ~50–60 meters (about ~165–200 feet) during the main Oi-1 step.
Warm oceans: not just “hot water,” but different circulation
Ocean temperature affects density, layering, oxygen, and how efficiently nutrients move. In warmer climates, some regions become more stratified (warm surface water floats on top), which can reduce deep mixing. That can reshape food webs—boosting productivity in some places while stressing ecosystems in others if oxygen drops or chemistry shifts too quickly.
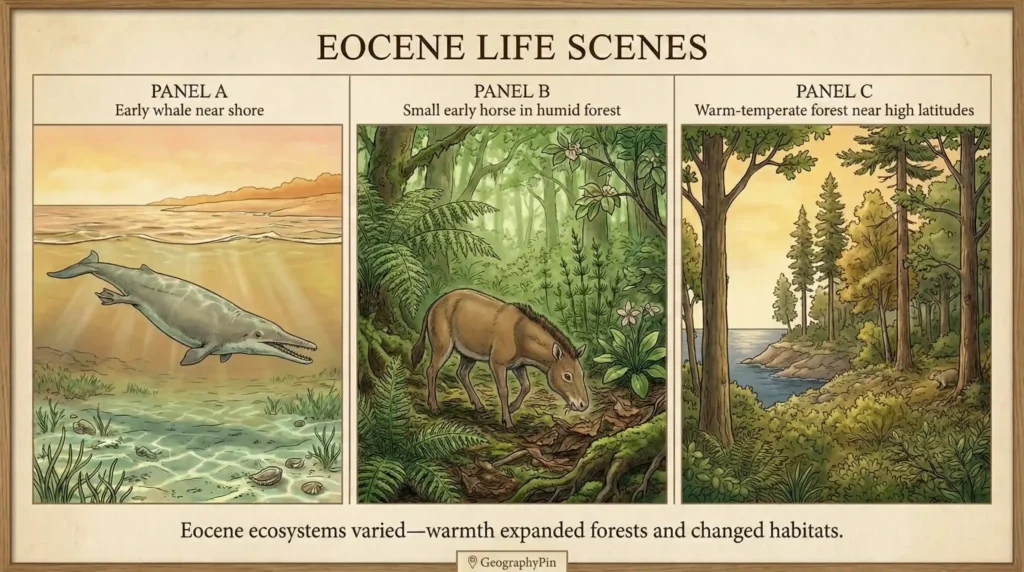
Life and Ecosystems in the Eocene: Forest Worlds and Early Modern Animals
The Eocene matters for life because it’s a time when many groups that feel “modern” are expanding, diversifying, or taking on new roles. Warm climates support large forest belts and shift biome boundaries. Places you’d expect tundra today could support wooded habitats—especially during early Eocene peak warmth.
On land: mammals diversify in a warm world
The Cenozoic “mammal story” is well underway: early horses (small, forest-adapted forms), primate relatives, and many other lineages appear across Eocene fossil sites. Warmth doesn’t just expand ranges—it can reshape habitats, growing seasons, and migration constraints.
In the sea: key steps in whale evolution
The Eocene includes major transitions in whale evolution, from land-associated ancestors to fully marine whales. It’s one of the classic “textbook” examples of how quickly major lifestyles can shift in evolutionary terms when ecological opportunity opens.
Warm oceans changed food webs
Warm oceans affect oxygen levels, nutrient cycling, and how currents mix water between the surface and the deep sea. During warm intervals, some marine ecosystems expand into regions that are too cool today, while other regions experience stress if heat and chemistry shift faster than organisms can adapt.
How the Eocene Ended: Cooling, CO₂ Drawdown, and Antarctic Ice
The Eocene ends with one of the most important climate shifts of the last 100 million years: Earth moves from a mostly ice-limited greenhouse world toward conditions where large ice can persist at the poles. The late Eocene trends cooler, and then near 33.9 Ma the climate takes a sharper step at the Eocene–Oligocene transition.
Why does Antarctica matter so much? Once a large ice sheet forms, it changes sea level and strengthens cooling feedbacks: ice reflects sunlight, and cold polar conditions can become self-reinforcing. Sea level falls as water gets stored on land as ice—often inferred at ~50–60 m (~165–200 ft) for the main Oi-1 step in sea-level reconstructions.
What pushed the cooling?
Researchers discuss several reinforcing drivers, with long-term CO₂ decline often near the center. Over geologic time, CO₂ can fall as weathering and carbon burial remove it from the atmosphere–ocean system. At the same time, tectonics rearrange continents and seaways, which can alter ocean circulation and heat transport.
The key idea for readers: Earth systems can drift toward a threshold slowly—and then flip faster once that threshold is crossed. The Eocene–Oligocene transition is a classic example of a “slow build, sharp step.”
How We Know What the Eocene Was Like (and Why Estimates Differ)
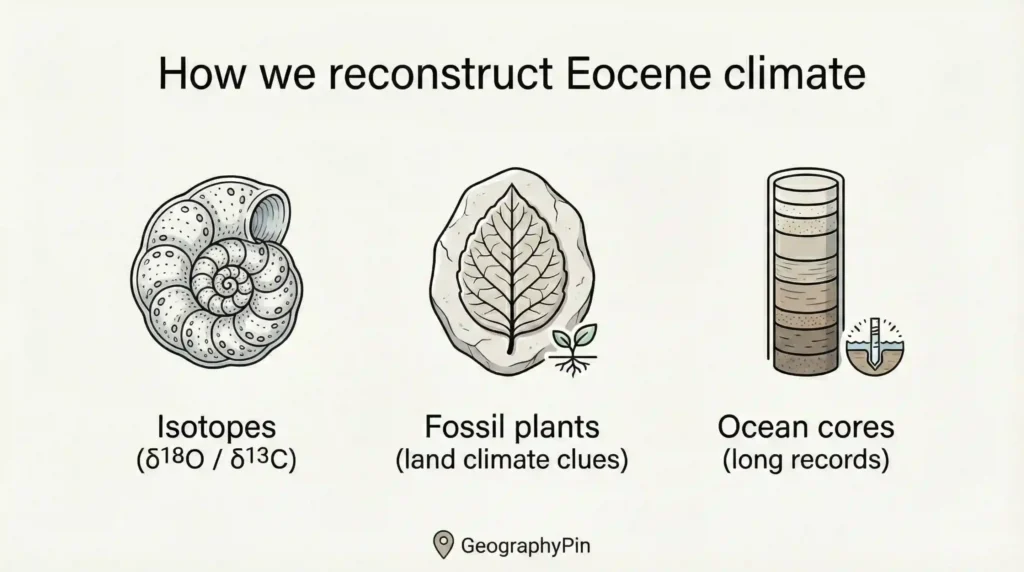
No one measured Eocene weather with a thermometer. Instead, scientists reconstruct past climate using proxies—natural recorders that respond to temperature, rainfall, ice volume, or ocean chemistry. A huge amount of what we know comes from deep-sea drilling cores and the chemistry of tiny marine fossils, supported by plant fossils, sediments, and animal distributions.
This is also why you’ll see ranges rather than a single perfect number. Different proxies track different parts of the system (surface vs deep ocean; regional vs global), and each method has calibration uncertainty. Add in the fact that the Eocene itself changes over time (early extreme warmth → late cooling), and honest science looks like: “we know the direction and broad scale very well, and we represent the exact magnitude as a range.”
A quick proxy cheat sheet
- Marine oxygen isotopes (δ18O): reflect deep-ocean temperature and global ice volume; a backbone record for Cenozoic climate change.
- Carbon isotopes (δ13C): highlight major carbon-cycle disruptions (like PETM “carbon injection” signatures).
- Fossil plants: leaf traits and distributions give clues about temperature, rainfall, and seasonality on land.
- Sediments + microfossils: record ocean circulation, chemistry, and ecosystem shifts across time.
FAQ
Was the Eocene hotter than today everywhere?
Not uniformly. The planet was warmer overall, but the biggest difference shows up at the poles. High latitudes warmed dramatically compared with today, so the equator-to-pole contrast was smaller than modern conditions.
Did the Eocene have ice caps?
For much of the early and middle Eocene, Earth likely lacked large, long-lived polar ice sheets like modern Antarctica and Greenland. Near the end of the Eocene, Antarctic ice expanded as the climate crossed a cooling threshold at the Eocene–Oligocene transition.
What is the PETM and why do people connect it to the Eocene?
The Paleocene–Eocene Thermal Maximum (PETM) is a rapid warming and carbon-cycle disruption near the Paleocene–Eocene boundary (~56 Ma). It’s famous because it shows how quickly climate and ecosystems can respond when large amounts of carbon enter the ocean–atmosphere system.
What animals lived in the Eocene?
Many groups we recognize were developing early forms: small early horses on land, primate relatives in forest ecosystems, and major stages of whale evolution from land-associated ancestors to fully marine whales. Warm climates also widened ranges for many temperature-sensitive groups.
Why did the Eocene end with cooling?
The late Eocene shows long-term cooling likely linked to declining CO₂ over millions of years, plus changes in ocean circulation and geography. Around 33.9 Ma, the system crossed a threshold where large Antarctic ice could grow and persist—reinforcing global cooling and contributing to major sea-level fall.
Could Earth return to “Eocene-like” conditions?
The Eocene happened under different continental layouts and long-term carbon-cycle conditions, so it’s not a perfect template. But it does show a real-world example of a warmer planet with limited polar ice and altered coastlines—useful for understanding climate sensitivity and polar feedbacks.
What Did We Learn Today?
- The Eocene lasted from 56.0 to 33.9 million years ago and sits between the Paleocene and Oligocene.
- It’s called a “greenhouse world” because high latitudes were much warmer and long-lived polar ice was limited for much of the epoch.
- The early Eocene includes extreme warmth (including the EECO), with reconstructions suggesting very large temperature differences versus pre-industrial.
- Warmth reshaped ecosystems—forests spread poleward, and many modern animal lineages diversified.
- The Eocene ended with a major cooling step and Antarctic ice expansion, along with large sea-level fall during Oi-1 estimates.
The Eocene is a reminder that Earth can operate in very different climate modes—and that carbon balance and polar feedbacks strongly influence where coastlines, forests, and oceans end up over time.
Sources & Data Notes
Why numbers vary: Eocene temperature, CO₂, and sea-level values are usually presented as ranges because different proxies capture different parts of the climate system and require calibrations. The Eocene itself also changes over time (early extreme warmth → late cooling), so a single “Eocene temperature” is always a simplification.
- Official time scale: International Commission on Stratigraphy (International Chronostratigraphic Chart; Eocene boundaries and stage ages).
- EECO warmth synthesis: Inglis et al. (2020), Climate of the Past (GMST estimates and uncertainty ranges for early Eocene intervals).
- PETM warming overview: McInerney & Wing (2011), Annual Review of Earth and Planetary Sciences (PETM magnitude and proxy context).
- Eocene–Oligocene sea level/ice context: Miller et al. (2008), Geological Society of America Bulletin (ice-volume and sea-level discussions; Oi-1 magnitude context).
- Big-picture Cenozoic climate framework: Zachos et al. (2001), Science (oxygen isotope-based trends and major transitions).