No Caribbean island is hurricane-proof. In a consistent 1980–2025 comparison of hurricane-center passages within 100 km (62 mi), Trinidad and the ABC islands sit at the lower-exposure end, while much of the northern Caribbean records more recurrent passages. January through April has the lowest Atlantic hurricane activity, but history cannot forecast an individual trip.
How to use this article: Start with the counting method, compare the lower-exposure results, scan the month-by-month pattern, or go directly to the trip-planning checklist.
How This Comparison Measures Historical Exposure
What counts—and what does not
“Strike” has a specific National Hurricane Center definition. An NHC-defined strike occurs when an island or other location enters an asymmetric strike circle 125 nautical miles (144 mi; 232 km) in diameter, centered 12.5 nautical miles to the right of the hurricane center along its direction of motion. That gives a nominal reach of 75 nautical miles on the right side and 50 nautical miles on the left.
- Landfall: the cyclone’s surface center crosses a coastline. Damaging winds can reach land even when the center does not.
- NHC-defined strike: the location intersects the official asymmetric strike circle while the system is a hurricane.
- Nearby passage: the center passes within a declared distance. The table below uses 100 km (62 mi).
- Direct hit: a separate NHC term tied to the radius of maximum wind; it is not interchangeable with landfall or strike.
- Actual impacts: observed wind, rain, surge, flooding, landslides or disruption. Track geometry alone does not measure them.
Because this analysis uses a fixed 100-km threshold rather than the NHC’s asymmetric circle, every data label says hurricane-center passage within 100 km (62 mi), never “strike,” “direct hit” or “landfall.”
What This Map Measures
The map compares recorded hurricane-strength center-track exposure within 100 km (62 mi) of the stated island geometry during 1980–2025. It is not a forecast for the current season, a prediction for an individual trip, a measure of hotel or building safety, or proof that every island inside a mapped storm area experienced hurricane-force winds.
Data window and calculation
The comparison uses the latest published Atlantic HURDAT2 best-track file available on September 4, 2026, containing completed-season records through 2025. The provisional 2026 season was excluded because it was not final in HURDAT2 on the analysis date. NCEI’s IBTrACS service uses 1980 as one modern-era subset, although routine satellite monitoring began earlier; here, 1980 is a conservative comparison cutoff that reduces—but does not eliminate—observing-system differences.
For each storm, HURDAT2 best-track positions—including six-hourly synoptic fixes and additional special entries—were interpolated geodesically on WGS84 at intervals no greater than 5 km (3.1 mi). A segment was eligible where interpolated wind reached at least 64 knots and at least one adjoining fix had HU status; a non-HU endpoint itself was excluded. Distance was then measured to GSHHG 2.3.7 full-resolution land polygons in a unit-centered azimuthal-equidistant projection. A storm counts once per analysis unit if its eligible center track comes within 100 km. A locally major encounter requires at least 96 knots while inside that zone, not the highest category the storm reached elsewhere. The month is the month of closest qualifying approach.
The relative descriptions are bins across the 39 displayed units: lower recorded exposure for 0–4 passages, variable or transition-zone exposure for 5–10, recurrent exposure for 11–12 and higher recorded track density above 12. These labels are comparative history, not a safest-to-most-dangerous ranking.
The wider 1851–2025 file represents known recorded historical tracks, not a complete census of every cyclone. Earlier Atlantic records are less complete, and both positions and intensities carry greater uncertainty. They are not mixed into the modern-period table.
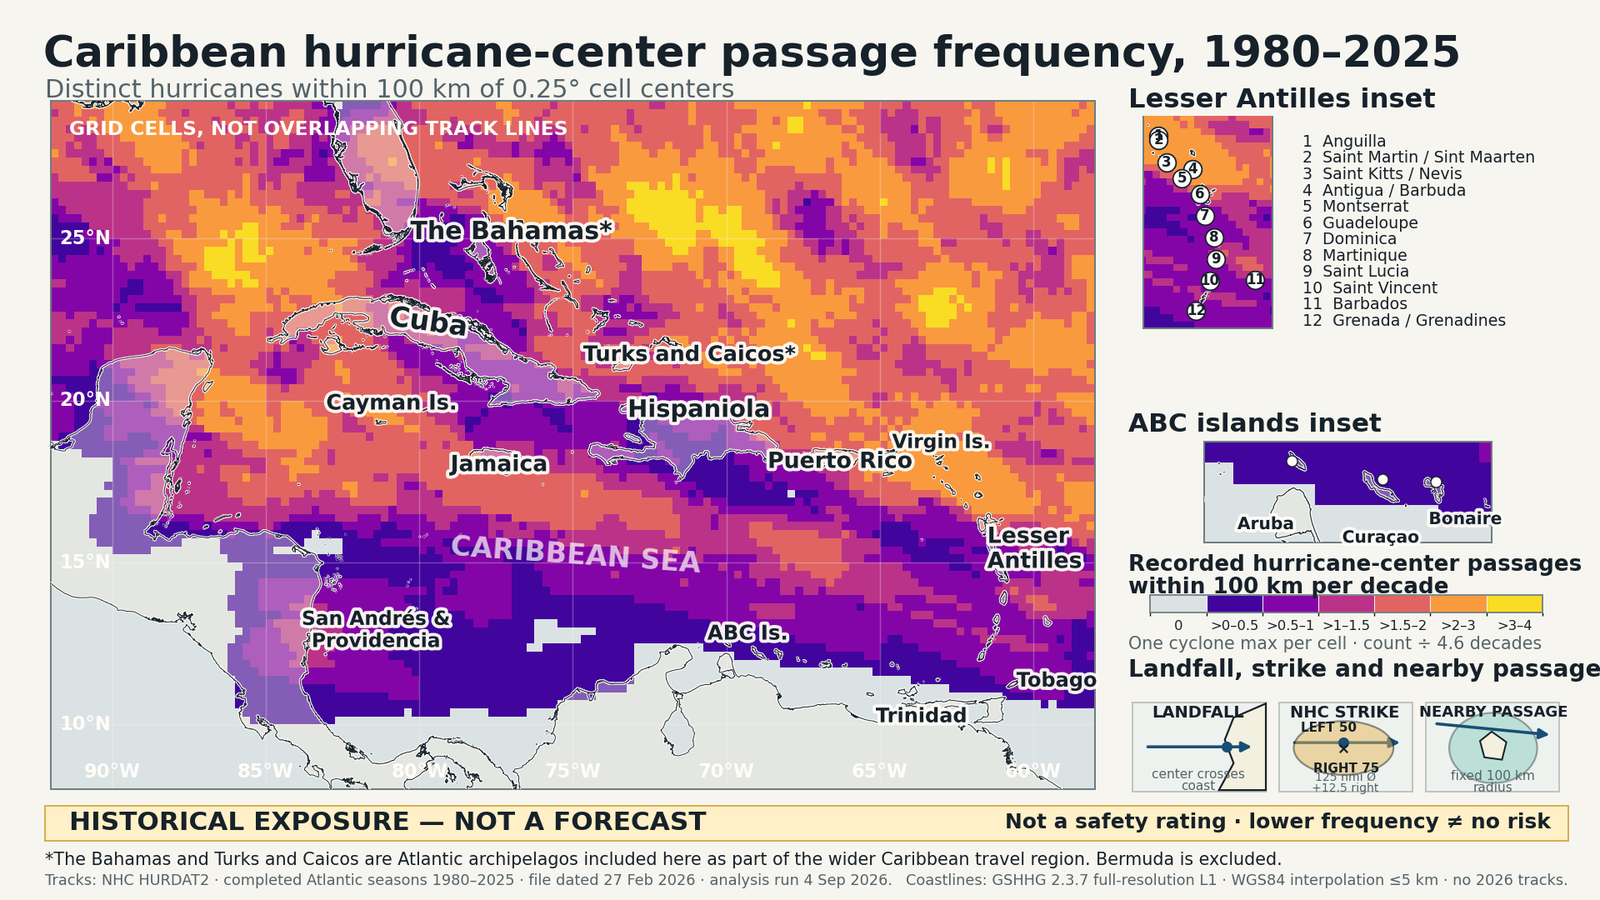
Download the data: Caribbean hurricane-center passages by island, 1980–2025 (CSV). The file contains the 39 comparison units, passage and locally major counts, latest qualifying event, exposure grouping and monthly totals.
Island-by-Island Comparison, 1980–2025
The table compares the same track threshold across every unit. “Selected official center crossing” lists examples checked against the five linked NHC tropical cyclone reports; it is deliberately not a complete crossing or landfall inventory, and the center was not necessarily at hurricane strength at the crossing instant. Raw counts also favor large islands and dispersed archipelagos because their geometry gives a storm more opportunities to approach some part of the unit.
| Island or analysis unit | Subregion | 100-km passages | Locally major | Selected official center crossing | Latest qualifying event | Busiest approach month(s) | Relative recorded exposure | Grouping note |
|---|---|---|---|---|---|---|---|---|
| Aruba | Southern Caribbean / ABC islands | 1 | 1 | — | Felix (2007-09-02) | September | Lower recorded exposure | Aruba land polygon |
| Bonaire | Southern Caribbean / ABC islands | 1 | 0 | — | Felix (2007-09-02) | September | Lower recorded exposure | Bonaire main-island land polygon |
| Curaçao | Southern Caribbean / ABC islands | 1 | 0 | — | Felix (2007-09-02) | September | Lower recorded exposure | Curaçao main-island land polygon |
| Trinidad | Southern Caribbean | 0 | 0 | — | None recorded | None recorded | Lower recorded exposure | Trinidad main-island land polygon; Tobago excluded |
| Tobago | Southern Caribbean transition zone | 3 | 2 | — | Beryl (2024-07-01) | July | Lower recorded exposure | Tobago land polygon; Trinidad excluded, because their recorded exposure differs |
| Barbados | Eastern Caribbean / Windward transition zone | 5 | 1 | — | Elsa (2021-07-02) | August | Variable or transition-zone exposure | Barbados land polygon; lower totals do not make this transition-zone island hurricane-proof |
| Grenada | Southern Lesser Antilles transition zone | 3 | 2 | — | Beryl (2024-07-01) | July | Lower recorded exposure | Grenada main-island land polygon; Carriacou and Petite Martinique excluded; Ivan (2004) and Beryl (2024) show why lower totals are not immunity |
| Carriacou | Southern Grenadines transition zone | 4 | 2 | Beryl (2024) | Beryl (2024-07-01) | July | Lower recorded exposure | Carriacou land polygon; kept separate from Grenada main island |
| Petite Martinique | Southern Grenadines transition zone | 4 | 2 | — | Beryl (2024-07-01) | July | Lower recorded exposure | Petite Martinique land polygon; kept separate from Grenada main island |
| Saint Vincent | Windward Islands | 4 | 2 | — | Beryl (2024-07-01) | July | Lower recorded exposure | Saint Vincent main-island land polygon; Grenadines excluded |
| Northern and central SVG Grenadines | Grenadines | 6 | 3 | — | Beryl (2024-07-01) | July | Variable or transition-zone exposure | Sampled islands: Bequia, Mustique and Canouan |
| Southern SVG Grenadines | Grenadines | 5 | 2 | — | Beryl (2024-07-01) | July | Variable or transition-zone exposure | Sampled islands: Mayreau and Union Island |
| Saint Lucia | Windward Islands | 5 | 1 | — | Elsa (2021-07-02) | August | Variable or transition-zone exposure | Saint Lucia land polygon |
| Martinique | Windward Islands | 5 | 2 | — | Tammy (2023-10-21) | August; September | Variable or transition-zone exposure | Martinique land polygon |
| Dominica | Windward/Leeward transition | 5 | 2 | Maria (2017) | Tammy (2023-10-21) | September | Variable or transition-zone exposure | Dominica land polygon |
| Guadeloupe | Leeward Islands | 11 | 4 | — | Tammy (2023-10-21) | September | Recurrent exposure | Connected Basse-Terre/Grande-Terre GSHHG land polygon; nearby Guadeloupe dependencies are not separate comparison units |
| Antigua | Leeward Islands | 11 | 4 | — | Tammy (2023-10-21) | September; October | Recurrent exposure | Antigua land polygon; Barbuda excluded |
| Barbuda | Leeward Islands | 12 | 5 | Irma (2017) | Tammy (2023-10-22) | September; October | Recurrent exposure | Barbuda land polygon; Antigua excluded |
| Montserrat | Leeward Islands | 10 | 4 | — | Tammy (2023-10-21) | September | Variable or transition-zone exposure | Montserrat land polygon |
| Saint Kitts | Leeward Islands | 11 | 5 | — | Tammy (2023-10-22) | September | Recurrent exposure | Saint Kitts land polygon; Nevis excluded |
| Nevis | Leeward Islands | 12 | 5 | — | Tammy (2023-10-22) | September | Recurrent exposure | Nevis land polygon; Saint Kitts excluded |
| Anguilla | Northern Lesser Antilles | 11 | 6 | — | Tammy (2023-10-22) | October | Recurrent exposure | Anguilla main-island land polygon |
| Saint Martin / Sint Maarten | Northern Lesser Antilles | 11 | 6 | Irma (2017) | Tammy (2023-10-22) | October | Recurrent exposure | One physical island; both French and Dutch jurisdictions combined |
| British Virgin Islands | Virgin Islands | 15 | 8 | Irma (2017) | Dorian (2019-08-28) | September | Higher recorded track density | Tortola, Virgin Gorda, Anegada and Jost Van Dyke land polygons |
| U.S. Virgin Islands | Virgin Islands | 13 | 7 | — | Dorian (2019-08-28) | September | Higher recorded track density | Saint Thomas, Saint John and Saint Croix land polygons |
| Puerto Rico | Greater Antilles | 12 | 5 | Fiona (2022) | Fiona (2022-09-18) | September | Recurrent exposure | Puerto Rico main-island land polygon |
| Hispaniola (Haiti and Dominican Republic) | Greater Antilles | 17 | 8 | Fiona (2022; Dominican Republic) | Oscar (2024-10-20) | September | Higher recorded track density | Whole physical island of Hispaniola; Haiti and Dominican Republic combined |
| Jamaica | Greater Antilles | 12 | 7 | Melissa (2025) | Melissa (2025-10-28) | August | Recurrent exposure | Jamaica land polygon |
| Grand Cayman | Western Caribbean / Cayman Islands | 10 | 6 | — | Rafael (2024-11-06) | August | Variable or transition-zone exposure | Grand Cayman land polygon |
| Cayman Sister Islands | Western Caribbean / Cayman Islands | 7 | 2 | — | Rafael (2024-11-06) | August; November | Variable or transition-zone exposure | Cayman Brac and Little Cayman land polygons |
| Western Cuba | Greater Antilles | 23 | 10 | — | Rafael (2024-11-06) | September | Higher recorded track density | Cuba main-island polygon west of 81°W; offshore Cuban islands excluded |
| Central Cuba | Greater Antilles | 13 | 8 | — | Melissa (2025-10-29) | September; November | Higher recorded track density | Cuba main-island polygon from 81°W through 77°W; offshore Cuban islands excluded |
| Eastern Cuba | Greater Antilles | 11 | 6 | Melissa (2025) | Melissa (2025-10-29) | October | Recurrent exposure | Cuba main-island polygon east of 77°W; offshore Cuban islands excluded |
| Northwest Bahamas | Atlantic archipelagos in wider Caribbean travel region | 15 | 6 | — | Nicole (2022-11-09) | August | Higher recorded track density | Grand Bahama, Abaco, Andros, New Providence and Eleuthera land polygons |
| Central Bahamas | Atlantic archipelagos in wider Caribbean travel region | 14 | 7 | Melissa (2025; Long Island) | Melissa (2025-10-29) | August; October | Higher recorded track density | Great Exuma, Cat Island, Long Island, San Salvador and Rum Cay land polygons |
| Southeast Bahamas | Atlantic archipelagos in wider Caribbean travel region | 13 | 6 | — | Melissa (2025-10-29) | September; October | Higher recorded track density | Crooked Island, Acklins, Mayaguana and Great Inagua land polygons |
| Turks and Caicos | Atlantic archipelagos in wider Caribbean travel region | 11 | 7 | Fiona (2022; Grand Turk) | Oscar (2024-10-19) | September | Recurrent exposure | All GSHHG level-1 land polygons inside the documented Turks and Caicos study boundary |
| San Andrés | Southwestern Caribbean | 4 | 2 | — | Julia (2022-10-08) | October | Lower recorded exposure | San Andrés land polygon |
| Providencia | Southwestern Caribbean | 3 | 1 | — | Julia (2022-10-08) | October | Lower recorded exposure | Providencia land polygon |
Reading the table: A passage is counted once per storm and analysis unit when the hurricane-strength center track came within 100 km (62 mi) of the stated land geometry. “Locally major” means the storm reached at least 96 kt while inside that 100-km zone. This is not an NHC strike, landfall count, observed wind footprint, impact total, trip forecast or complete safety ranking. The selected crossing column is deliberately non-exhaustive; an em dash means no example from the five linked reports is displayed, not that no center crossing occurred. A crossing example belongs to a qualifying 100-km encounter but was not necessarily at hurricane strength at the instant of crossing. Cuba’s three rows are longitude slices, so a track can traverse more than one slice without making a separate coastal landfall in each.
Which Caribbean Islands Have Lower Historical Hurricane Exposure?
The calculated lower-exposure group
Trinidad recorded no qualifying 100-km hurricane-center passage in this 46-season window. Aruba, Bonaire and Curaçao each recorded one: Hurricane Felix in 2007. They therefore sit at the low end of this particular track measure, but none is hurricane-proof and a passage outside 100 km can still cause disruption.
Tobago must not inherit Trinidad’s result. Tobago recorded three passages, two locally at major-hurricane intensity, including Beryl in July 2024. Grenada’s main island also recorded three; Carriacou and Petite Martinique each recorded four. San Andrés recorded four and Providencia three in the southwestern Caribbean.
Barbados, Grenada, Tobago and the southern Grenadines are better understood as a transition zone than as a protected area. Hurricane Ivan severely affected Grenada in 2004, while the center of Category 4 Hurricane Beryl crossed Carriacou in 2024. Barbados recorded five passages in the table—below many northern islands, but not comparable to a guarantee of safety.
The same separation matters within Saint Vincent and the Grenadines. Saint Vincent’s main island recorded four passages; the sampled northern and central Grenadines recorded six, and the sampled southern Grenadines recorded five. A national label would hide that internal geography.
Which Islands Lie in More Recurrent Hurricane Corridors?
The denser modern-period corridors in this analysis extend across parts of the northern Lesser Antilles, the Virgin Islands, the Greater Antilles, The Bahamas and Turks and Caicos. The British Virgin Islands recorded 15 qualifying passages and the U.S. Virgin Islands 13. Guadeloupe, Antigua, Barbuda, Saint Kitts, Nevis, Anguilla and Saint Martin/Sint Maarten recorded 11 or 12 each, while nearby Montserrat recorded 10.
Puerto Rico recorded 12 and the whole island of Hispaniola—labeled for both Haiti and the Dominican Republic—recorded 17. Jamaica recorded 12. Grand Cayman recorded 10 and the Cayman Sister Islands seven, illustrating why the Jamaica–Cayman corridor should not be treated as one uniform zone.
Cuba’s long coastline creates a strong size effect and masks regional variation. Splitting the main island produces 23 passages in western Cuba, 13 in central Cuba and 11 in eastern Cuba. These are overlapping storm opportunities across separate longitude bands, not three independent country-level risk scores.
The Bahamas is even more dispersed, so the table uses northwest, central and southeast island groups, with 15, 14 and 13 passages respectively. The Bahamas and Turks and Caicos lie in the Atlantic rather than the Caribbean Sea, but are included because travelers commonly compare them with Caribbean destinations. Bermuda is not part of the Caribbean and is excluded.
These counts describe where hurricane-strength centers have repeatedly passed near land. They do not show deaths, losses, building quality, rainfall exposure or recovery capacity, and they should not be read as a league table of danger.
Why Exposure Differs Across the Caribbean
No official line divides a hurricane-prone north from a safe south. The “hurricane belt” is an informal geographic shortcut, and its supposed southern edge is not a protected boundary.
- Latitude: the Coriolis effect is weaker close to the equator, making organized tropical cyclones less likely to form or maintain the same circulation there. This helps explain lower exposure around Trinidad and the ABC islands, but it does not make those islands immune.
- Common track direction: tropical systems often move west or west-northwest across the tropical Atlantic and Caribbean under the influence of the subtropical ridge.
- African easterly waves: many long-track Atlantic hurricanes originate from disturbances moving westward from Africa, putting the Lesser Antilles near an early gateway into the Caribbean.
- Seasonal migration: favored formation areas change through the season. Early and late activity has a stronger western Caribbean component, while the tropical Atlantic becomes much more active later in summer.
- Recurvature: weaknesses in the subtropical ridge can turn storms northward near the northern Caribbean, contributing to dense but highly variable corridors around the Greater Antilles, Virgin Islands, Bahamas and Turks and Caicos.
Steering patterns change from storm to storm and year to year. A lower historical total therefore cannot tell a traveler where a future storm will form or turn.
Caribbean Hurricane Season by Month
The month-by-month climatology
The official Atlantic hurricane season runs from June 1 through November 30. NOAA’s climatological curve peaks on September 10, and most basin activity occurs from mid-August through mid-October. In a GeographyPin calculation from final HURDAT2 synoptic fixes for 1980–2024, August through October accounted for 89.2% of recorded Atlantic hurricane days and 92.6% of major-hurricane days. Those figures describe the basin and historical period; they are not island probabilities.
| Month | Climatological pattern | Caribbean interpretation |
|---|---|---|
| January | Among the lowest-activity months | Very low tropical-cyclone climatology; not a weather guarantee |
| February | Among the lowest-activity months | Very low tropical-cyclone climatology; not zero by physical law |
| March | Among the lowest-activity months | Very low tropical-cyclone climatology |
| April | Among the lowest-activity months | Very low tropical-cyclone climatology |
| May | Outside the official season; rare preseason systems occur | Low overall, but monitoring still matters if a system develops |
| June | Season begins; activity remains below peak | Relatively greater early-season focus in the western Caribbean; major hurricanes remain possible |
| July | Below the seasonal peak | Risk is rising, and Beryl in 2024 shows that an early major hurricane can occur |
| August | Activity increases rapidly | Broader basin-wide exposure develops, especially later in the month |
| September | Peak month; climatological peak is September 10 | Highest basin-wide concern, including the southern Caribbean despite lower long-run counts there |
| October | Substantial activity continues | Central and western Caribbean risk remains especially important |
| November | Basin-wide activity declines | Residual western Caribbean risk means it is not a universally safe shoulder month |
| December | Outside the official season and generally low | Low tropical-cyclone climatology, but rare off-season systems mean not zero |
Island-by-month heatmap
Each cell shows the number of qualifying storms assigned to the month of closest approach, counted once per unit. The printed number is the actual count; color is only a visual aid. Zero or one event in a small sample must not be interpreted as a guaranteed safe month.
0 1 2 3 4 5 6+
| Island or analysis unit | Jan | Feb | Mar | Apr | May | Jun | Jul | Aug | Sep | Oct | Nov | Dec |
|---|---|---|---|---|---|---|---|---|---|---|---|---|
| Aruba | 0 | 0 | 0 | 0 | 0 | 0 | 0 | 0 | 1 | 0 | 0 | 0 |
| Bonaire | 0 | 0 | 0 | 0 | 0 | 0 | 0 | 0 | 1 | 0 | 0 | 0 |
| Curaçao | 0 | 0 | 0 | 0 | 0 | 0 | 0 | 0 | 1 | 0 | 0 | 0 |
| Trinidad | 0 | 0 | 0 | 0 | 0 | 0 | 0 | 0 | 0 | 0 | 0 | 0 |
| Tobago | 0 | 0 | 0 | 0 | 0 | 0 | 2 | 0 | 1 | 0 | 0 | 0 |
| Barbados | 0 | 0 | 0 | 0 | 0 | 0 | 1 | 2 | 1 | 1 | 0 | 0 |
| Grenada | 0 | 0 | 0 | 0 | 0 | 0 | 2 | 0 | 1 | 0 | 0 | 0 |
| Carriacou | 0 | 0 | 0 | 0 | 0 | 0 | 2 | 0 | 1 | 1 | 0 | 0 |
| Petite Martinique | 0 | 0 | 0 | 0 | 0 | 0 | 2 | 0 | 1 | 1 | 0 | 0 |
| Saint Vincent | 0 | 0 | 0 | 0 | 0 | 0 | 2 | 1 | 0 | 1 | 0 | 0 |
| Northern and central SVG Grenadines | 0 | 0 | 0 | 0 | 0 | 0 | 3 | 1 | 1 | 1 | 0 | 0 |
| Southern SVG Grenadines | 0 | 0 | 0 | 0 | 0 | 0 | 3 | 0 | 1 | 1 | 0 | 0 |
| Saint Lucia | 0 | 0 | 0 | 0 | 0 | 0 | 1 | 2 | 1 | 1 | 0 | 0 |
| Martinique | 0 | 0 | 0 | 0 | 0 | 0 | 0 | 2 | 2 | 1 | 0 | 0 |
| Dominica | 0 | 0 | 0 | 0 | 0 | 0 | 0 | 1 | 3 | 1 | 0 | 0 |
| Guadeloupe | 0 | 0 | 0 | 0 | 0 | 0 | 1 | 1 | 5 | 4 | 0 | 0 |
| Antigua | 0 | 0 | 0 | 0 | 0 | 0 | 1 | 2 | 4 | 4 | 0 | 0 |
| Barbuda | 0 | 0 | 0 | 0 | 0 | 0 | 1 | 2 | 4 | 4 | 1 | 0 |
| Montserrat | 0 | 0 | 0 | 0 | 0 | 0 | 1 | 1 | 5 | 3 | 0 | 0 |
| Saint Kitts | 0 | 0 | 0 | 0 | 0 | 0 | 1 | 1 | 5 | 3 | 1 | 0 |
| Nevis | 0 | 0 | 0 | 0 | 0 | 0 | 1 | 1 | 6 | 3 | 1 | 0 |
| Anguilla | 0 | 0 | 0 | 0 | 0 | 0 | 1 | 2 | 3 | 4 | 1 | 0 |
| Saint Martin / Sint Maarten | 0 | 0 | 0 | 0 | 0 | 0 | 1 | 2 | 3 | 4 | 1 | 0 |
| British Virgin Islands | 0 | 0 | 0 | 0 | 0 | 0 | 1 | 3 | 6 | 3 | 2 | 0 |
| U.S. Virgin Islands | 0 | 0 | 0 | 0 | 0 | 0 | 1 | 4 | 5 | 2 | 1 | 0 |
| Puerto Rico | 0 | 0 | 0 | 0 | 0 | 0 | 1 | 3 | 8 | 0 | 0 | 0 |
| Hispaniola (Haiti and Dominican Republic) | 0 | 0 | 0 | 0 | 0 | 0 | 2 | 4 | 8 | 2 | 1 | 0 |
| Jamaica | 0 | 0 | 0 | 0 | 0 | 0 | 2 | 4 | 2 | 3 | 1 | 0 |
| Grand Cayman | 0 | 0 | 0 | 0 | 0 | 0 | 1 | 4 | 2 | 0 | 3 | 0 |
| Cayman Sister Islands | 0 | 0 | 0 | 0 | 0 | 0 | 0 | 3 | 1 | 0 | 3 | 0 |
| Western Cuba | 0 | 0 | 0 | 0 | 0 | 1 | 1 | 5 | 7 | 6 | 3 | 0 |
| Central Cuba | 0 | 0 | 0 | 0 | 0 | 0 | 1 | 1 | 4 | 3 | 4 | 0 |
| Eastern Cuba | 0 | 0 | 0 | 0 | 0 | 0 | 1 | 0 | 3 | 4 | 3 | 0 |
| Northwest Bahamas | 0 | 0 | 0 | 0 | 0 | 0 | 1 | 5 | 4 | 2 | 3 | 0 |
| Central Bahamas | 0 | 0 | 0 | 0 | 0 | 0 | 1 | 5 | 3 | 5 | 0 | 0 |
| Southeast Bahamas | 0 | 0 | 0 | 0 | 0 | 0 | 2 | 1 | 4 | 4 | 2 | 0 |
| Turks and Caicos | 0 | 0 | 0 | 0 | 0 | 0 | 1 | 1 | 7 | 1 | 1 | 0 |
| San Andrés | 0 | 0 | 0 | 0 | 0 | 0 | 1 | 0 | 0 | 2 | 1 | 0 |
| Providencia | 0 | 0 | 0 | 0 | 0 | 0 | 0 | 0 | 0 | 2 | 1 | 0 |
Table downloads (3)
- Recorded hurricane-center passages within 100 km (62 mi), completed Atlantic seasons 1980–2025 (40 × 9)View tableDownload CSV
- Practical interpretation of Atlantic hurricane climatology by month (13 × 3)View tableDownload CSV
- Month of closest hurricane-strength approach, 1980–2025; raw qualifying-event counts (40 × 13)View tableDownload CSV
Each storm is assigned once per analysis unit to the month of its closest hurricane-strength approach. A zero is an observed zero under this method and period, not a guarantee of zero future risk. Early records outside this 1980–2025 comparison are not represented here.
Direct Strike vs. Travel Disruption
A cyclone does not need to make landfall, meet the NHC strike definition or enter the 100-km analysis zone to disrupt a trip. A distant storm can send large swell toward beaches and ports, feed heavy rain into another island, close airports, alter cruise itineraries, interrupt ferries or delay supplies.
Hazard is not the same as vulnerability
Track exposure is only one part of physical hazard, and hazard is only one part of risk. Consequences also depend on storm size, forward speed, rainfall, terrain, elevation, coastal exposure and the direction of approach. Vulnerability depends on construction, infrastructure, warning systems, access to shelter and the capacity to recover.
The Saffir–Simpson Hurricane Wind Scale measures maximum sustained wind only. It does not measure rainfall flooding, storm surge or tornado risk. A lower-category or nearby hurricane can therefore produce severe impacts that this table’s locally measured category does not capture.
How to Use the History for a Trip
Practical planning checklist
January through April are the lowest-risk months only in the narrow sense of Atlantic tropical-cyclone climatology. That does not guarantee sunshine, dry weather, calm seas, open airports or uninterrupted ferry service. The difference is the same one explained in weather vs. climate: a long-run pattern cannot predict the conditions on a specific date.
- Check the National Hurricane Center as departure approaches.
- Follow the destination’s national meteorological service and emergency-management agency.
- Review airline, hotel and ferry cancellation or rebooking policies.
- Read travel-insurance exclusions and named-storm provisions before purchase; do not assume every disruption is covered.
- Keep dates, routes or bookings flexible during the June–November season.
Seasonal outlooks estimate basin-wide activity—such as the likely number of named storms, hurricanes or major hurricanes. They cannot forecast which island will be struck months in advance; useful track and impact forecasts emerge on much shorter lead times once a storm exists.
If timing and price both matter, the most cost-effective Caribbean islands comparison can help with the budget side of the decision. Treat any shoulder-season savings separately from hurricane exposure and cancellation flexibility.
Climate Change and Historical Comparisons
NOAA’s Geophysical Fluid Dynamics Laboratory concludes that warming is projected to increase tropical-cyclone rainfall rates and average intensity, while changes in total storm frequency remain less certain. There is also less confidence in precise regional track changes. That evidence does not establish that every Caribbean island’s strike frequency is already increasing.
Historical comparisons remain useful for describing where storms have traveled, but they are not fixed probabilities for a warmer future. The prudent use is to combine the record with current forecasts, local vulnerability and flexible planning—not to turn a 1980–2025 ordering into a permanent map of safety. GeographyPin’s overview of climate change and extreme weather provides broader context.
Frequently Asked Questions
Which Caribbean islands have the lowest historical hurricane exposure?
Under this 1980–2025 100-km passage method, Trinidad recorded zero qualifying encounters and Aruba, Bonaire and Curaçao recorded one each. Tobago, Grenada, Providencia, Carriacou, Petite Martinique, Saint Vincent and San Andrés also fall in the 0–4 lower-exposure bin, but none is hurricane-free.
Which islands have been affected most often?
For center-track exposure—not all impacts—western Cuba recorded the highest displayed unit total at 23, followed by Hispaniola at 17 and the British Virgin Islands and northwest Bahamas at 15. Large and dispersed units have more opportunity for a track to approach land, so these are not normalized danger rankings.
Is any Caribbean island hurricane-free?
No. A zero in a 46-season, 100-km sample means no event met that exact test; it does not prove immunity from future hurricanes, distant effects or tropical storms.
Are the ABC islands outside the hurricane belt?
“Hurricane belt” is informal, not an official boundary. Aruba, Bonaire and Curaçao have lower recorded exposure in this analysis, but Hurricane Felix passed within the defined zone in 2007, so “outside” must not be read as protected.
Is Barbados a low-risk island?
Barbados recorded five qualifying passages and falls in the variable or transition-zone group. Its historical center-track total is below many northern islands, but that is not a complete risk assessment or a guarantee for a particular season.
What is the safest month to visit the Caribbean?
No month is guaranteed safe. January through April collectively have the lowest Atlantic hurricane activity; that statement covers tropical-cyclone climatology only, not rain, sea state or travel operations.
Is September safe in the southern Caribbean?
Southern islands often have lower long-run track exposure, but September is the Atlantic peak month and the ABC encounter with Felix occurred in September 2007. Check current forecasts rather than treating latitude as a shield.
What counts as a hurricane strike?
The official NHC strike test uses an asymmetric 125-nautical-mile-diameter circle. This article’s table does not claim that test: it counts hurricane-strength center passages within a fixed 100 km (62 mi) of land.
Why do strike totals differ among websites?
Sources may count landfalls, NHC strikes, center passages at different radii, any tropical-cyclone approach, wind footprints or reported impacts. Results also change with the date range, island geometry, track interpolation, intensity-at-encounter rule and whether a storm is counted once or at every fix.
Can a distant hurricane disrupt a trip?
Yes. Swell, rain, airport restrictions, ferry suspensions, cruise changes and supply interruptions can occur even when the center remains far away.
Can a seasonal forecast predict island landfalls?
No. Seasonal outlooks estimate activity across the Atlantic basin; they cannot identify months ahead which island, if any, a future storm will reach.
Does climate change make historical rankings less reliable?
History still describes past tracks, but it is not a stationary forecast. Projected increases in rainfall rates and average intensity, plus uncertainty about frequency and tracks, make it even more important to pair history with current forecasts and vulnerability.
What Did We Learn Today?
Caribbean hurricane exposure is a gradient rather than a protected zone: the ABC islands and Trinidad have lower modern-period center-track totals, while several northern corridors record recurrent approaches. The result depends on a declared track distance, local storm intensity and transparent island boundaries; it is not a landfall count, an impact score or a forecast. January through April minimize tropical-cyclone climatology, but current official information and flexible plans remain essential.
Sources & Data Notes
Analysis run September 4, 2026; source links rechecked September 5, 2026. Track file: hurdat2-1851-2025-02272026.txt, SHA-256 1b9b0c7beed5b4505838658b1d30e159fc84330c60891a58cfcf43ae55c37202. A SHA-256 checksum identifies the exact file version used. Filters: completed Atlantic seasons 1980–2025, hurricane strength at local encounter, one count per storm and unit, geodesic interpolation no greater than 5 km, a 100-km land buffer, a 96-kt locally major threshold and the month of closest approach. The 89.2% and 92.6% seasonal shares use 00, 06, 12 and 18 UTC HURDAT2 fixes through 2024, with four qualifying fixes treated as one hurricane day; these are GeographyPin calculations, not NOAA-published percentages. Coastlines: GSHHG/GSHHS 2.3.7 full-resolution level-1 land polygons, distribution SHA-256 8dbbe7e071e77e9e75f2d639239099ebca8d5c16d6a07df8169729d49f15cf41. Companion CSV: caribbean-hurricane-passages-1980-2025.csv, SHA-256 69bd7bc360c4c5e6230c9467d1366f132c8cc31d5b1c66ec79af404ebc178589. The grouping-note column defines each unit: paired islands are separated where feasible; Saint Martin/Sint Maarten is one physical island; Hispaniola is one physical island labeled for Haiti and the Dominican Republic; Cuba is split at 81°W and 77°W; The Bahamas is split into three named groups; listed multi-island units use the specified polygons; and the Turks and Caicos unit includes GSHHG level-1 polygons with representative points inside 72.55°W–70.9°W and 21.1°N–22.1°N. Twelve encounters fall between 95 and 100 km, underscoring that track uncertainty exceeds apparent computational precision. The center-crossing column contains selected examples checked against the five linked NHC reports, not a complete landfall inventory; a dash does not mean that no crossing has ever occurred. HURDAT2 can be revised through reanalysis. This analysis is scheduled for recalculation after each completed Atlantic season is incorporated and for review before June 1 each year.
- National Hurricane Center: Atlantic HURDAT2, 1851–2025
- National Hurricane Center: HURDAT2 Atlantic format documentation
- National Hurricane Center: Tropical Cyclone Climatology
- NOAA/AOML Hurricane FAQ
- National Hurricane Center glossary and National Weather Service strike definition
- NOAA/NCEI: International Best Track Archive for Climate Stewardship
- NOAA/NCEI: GSHHG shoreline and coastline databases and the official GSHHG 2.3.7 release page for the shapefile distribution used
- National Hurricane Center: Saffir–Simpson Hurricane Wind Scale
- NOAA Climate Prediction Center: Atlantic Hurricane Outlook
- NOAA Geophysical Fluid Dynamics Laboratory: Global Warming and Hurricanes
- Selected center crossings checked against NHC tropical cyclone reports for Irma (2017), Maria (2017), Fiona (2022), Beryl (2024) and Melissa (2025).