A blue patch and a set of depth numbers can make an underwater landscape look simple. The difficulty is deciding what the numbers are measured from, how the contours were produced, and which details the underlying survey can really support.
To read a bathymetric map, check its depth units and vertical datum, then use contour values and the color legend to interpret the underwater terrain. Compare contour spacing only at a consistent interval and scale. Finally, check the source and resolution: a smooth, detailed-looking map is not necessarily a detailed survey or a navigation chart.
How to use this article: Check depth versus elevation, follow contour intervals, understand changing water levels, or try the Lake Erie exercise.
1. Start with the legend, units and purpose
A bathymetric map describes underwater terrain: shallow banks, slopes, channels and deep basins. It may show a lake, a coastal shelf or an ocean basin. The central task is to work out what each number and color represents before deciding where the bottom rises or falls.
Read these five items first:
- Coverage: identify the water body and the area actually mapped.
- Units: look for feet, meters or fathoms. One fathom equals 6 feet (about 1.83 meters).
- Vertical reference: find the datum, the surface from which depths or elevations are measured.
- Legend: distinguish contours, individual depth labels and colored bands.
- Purpose and source: check whether this is a scientific terrain map, a historical compilation or an official navigation product.
Do not assume that a number printed in the water is a depth below the water surface at this moment. It may be a depth below a fixed reference level, or an elevation in a land-and-water model. A bare number without units and a reference is not enough.
Depth and elevation run in opposite directions
With positive depths, a larger value means deeper water: 100 feet (about 30.5 meters) is deeper than 50 feet (about 15.2 meters). With elevations measured relative to the same zero surface, −100 feet (about −30.5 meters) is lower than −50 feet (about −15.2 meters). The minus sign does not mean that the water has a “negative depth”; it describes where the bed lies relative to that reference.
Color is also a choice, not a universal code. Dark blue often represents greater depth on teaching maps, but other palettes reverse the order or use warm colors. Read the legend rather than interpreting blue as shallow or red as dangerous. General orientation and scale principles are covered in our map-reading guide.
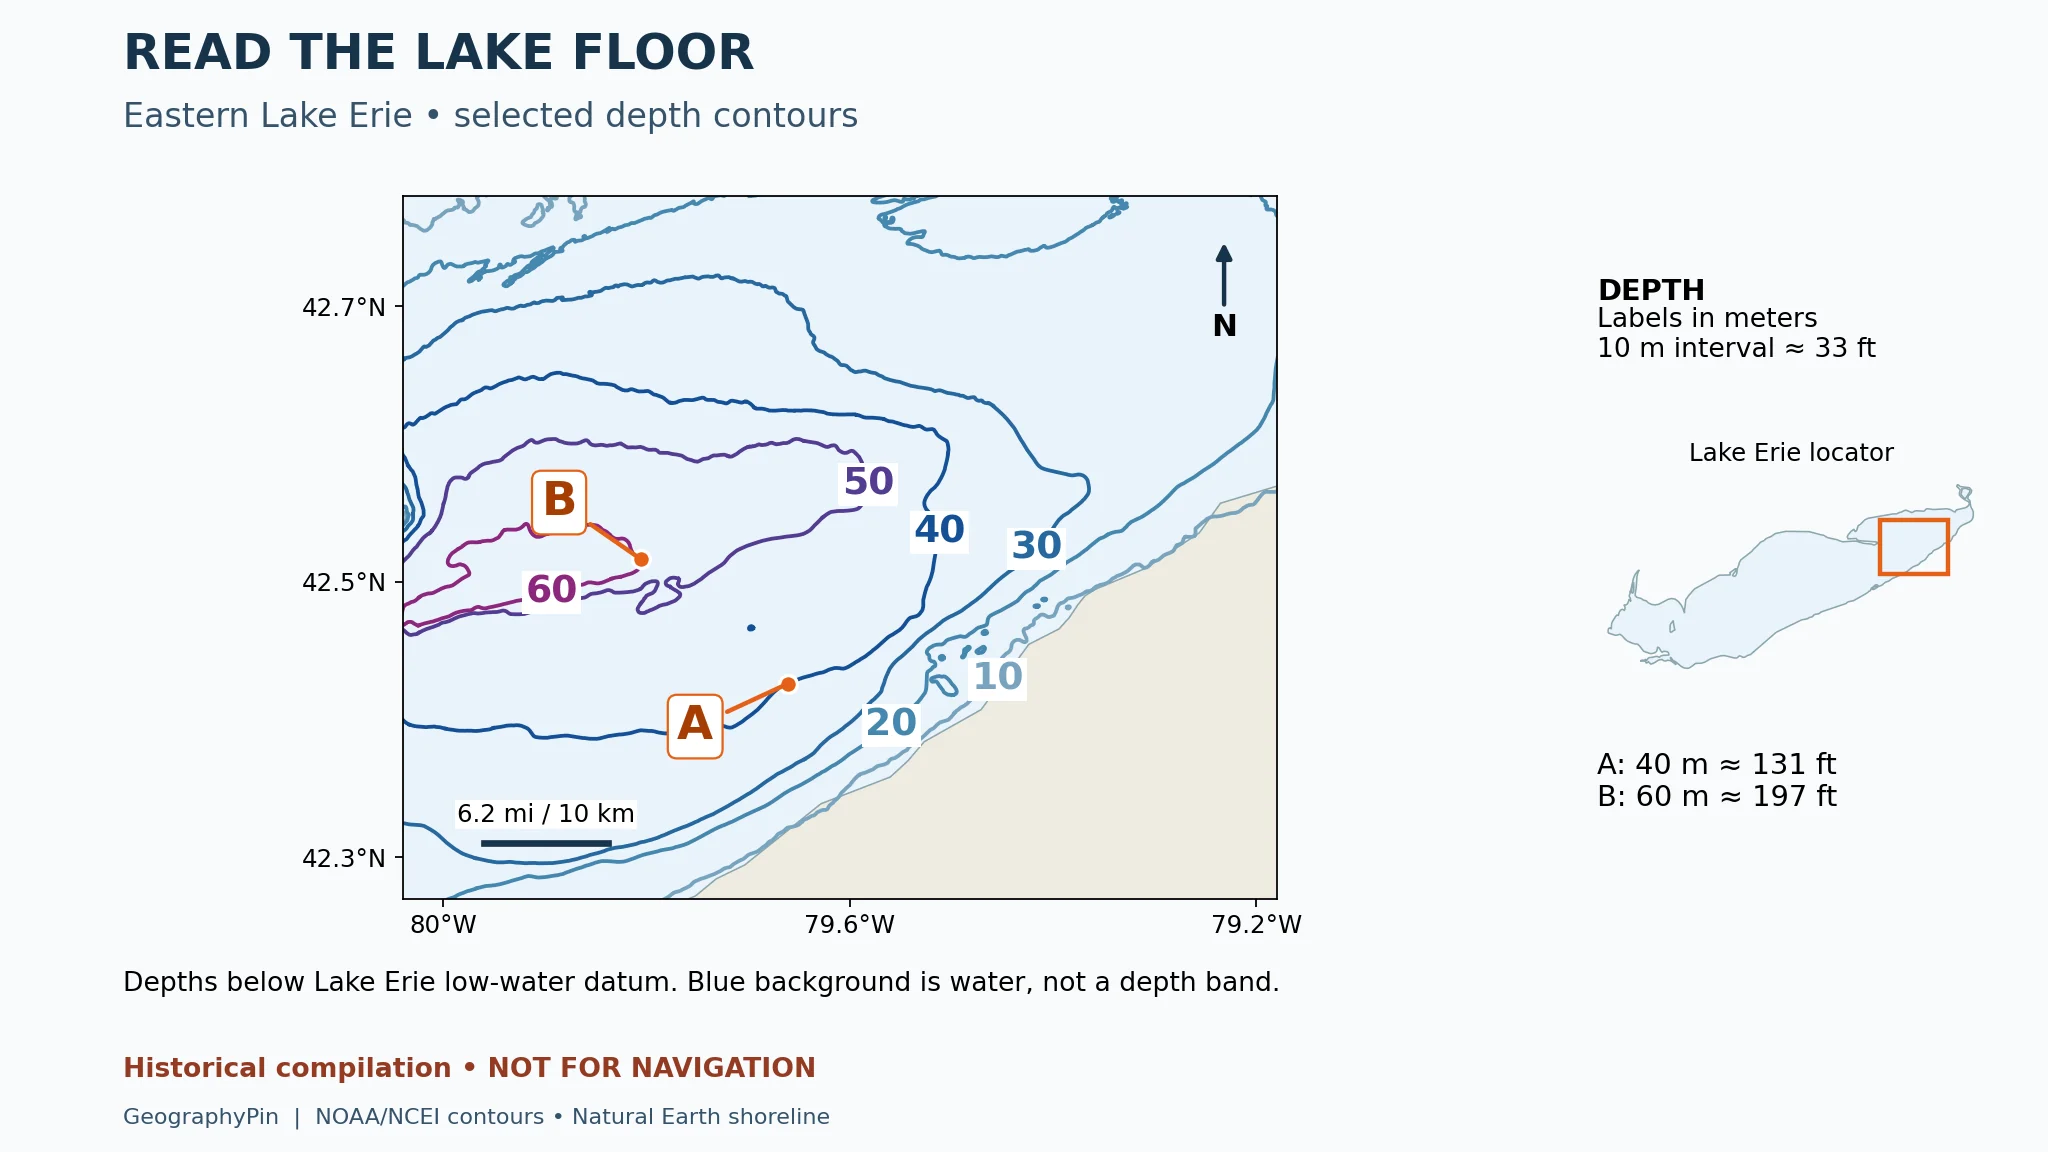
The real Lake Erie example below retains the source’s metric labels. Follow the orange leader lines to locate A and B; the letters identify positions on contours, not towns or survey stations. The practice questions and answer key explain what you can conclude from them.

2. Read depth contours without inventing precision
A depth contour, also called an isobath, connects locations assigned the same depth. A sounding is a depth measurement associated with a location. Contours organize those observations or a derived model into a picture of the bottom; they are not individual survey tracks.
Count intervals, not lines
Suppose an illustrative map labels successive contours 30, 40 and 50 feet, approximately 9.1, 12.2 and 15.2 meters. There are two 10-foot intervals between the first and last lines, so the depth difference is 20 feet (about 6.1 meters), not 30 feet. A point between the 40- and 50-foot lines is not automatically 45 feet deep. That estimate would require assumptions about the shape between them.
The interval may change between shallow and deep areas. A map might include closely spaced shallow contours and only selected deeper ones; a bold index contour may be separated from the next bold line by several thinner contours. Check every labeled value and the legend before counting.
For a consistent contour interval and map scale, tightly packed lines indicate a steeper bottom slope than widely spaced lines. Measure spacing across the contours, roughly perpendicular to them. Following a line keeps you at its represented depth; it does not measure the downslope change.
A closed loop can be a hollow or a high point
Read the numbers toward the center. Increasing positive depths indicate a depression or basin. Decreasing positive depths indicate an underwater rise. A ring by itself does not identify which one it is, and missing central contours do not establish the exact highest or deepest point.
Colors and hillshading can help reveal broad shapes, but neither replaces labeled depth values. Hillshading imitates illumination from a chosen direction; a dark face is not necessarily deeper than a bright face. A smooth shaded surface can conceal gaps or interpolation in the observations.
3. Find the zero: what a depth datum means
A vertical datum is the reference used for heights and depths. Mean sea level, a tidal low-water reference and a lake’s low-water datum are different references. You cannot compare two bare depth values reliably without knowing which reference each uses.
The bed and the water surface are separate
Consider an explicitly hypothetical example: a bed is 20 feet (about 6.1 meters) below a local datum. If the water surface stands 2 feet (about 0.6 meter) above that same datum, the vertical separation is 22 feet (about 6.7 meters). If the surface is 1 foot (about 0.3 meter) below datum, it is 19 feet (about 5.8 meters).
This arithmetic explains the reference, not a boating-clearance procedure. It assumes a matching datum, a reliable local water level and an unchanged bed. It does not account for waves, vessel motion, surveying uncertainty or hazards. Neither this example nor the teaching map establishes a safe route.
A horizontal datum answers a different question: how positions such as latitude and longitude are referenced. Changing the vertical reference alters heights or depths; it does not move the coastline sideways in the same way as changing a position reference can. The word “datum” alone therefore needs context.
For this real-data example, the distinction matters immediately. NOAA NCEI describes its original Great Lakes bathymetric contours as referenced to each lake’s own low-water datum. Its Grid Extract downloads are instead referenced to mean sea level. Two products from the same organization can therefore need different interpretations. Read the metadata for the exact download, not just the name of the collection.
4. Practice on a real Lake Erie bathymetric map
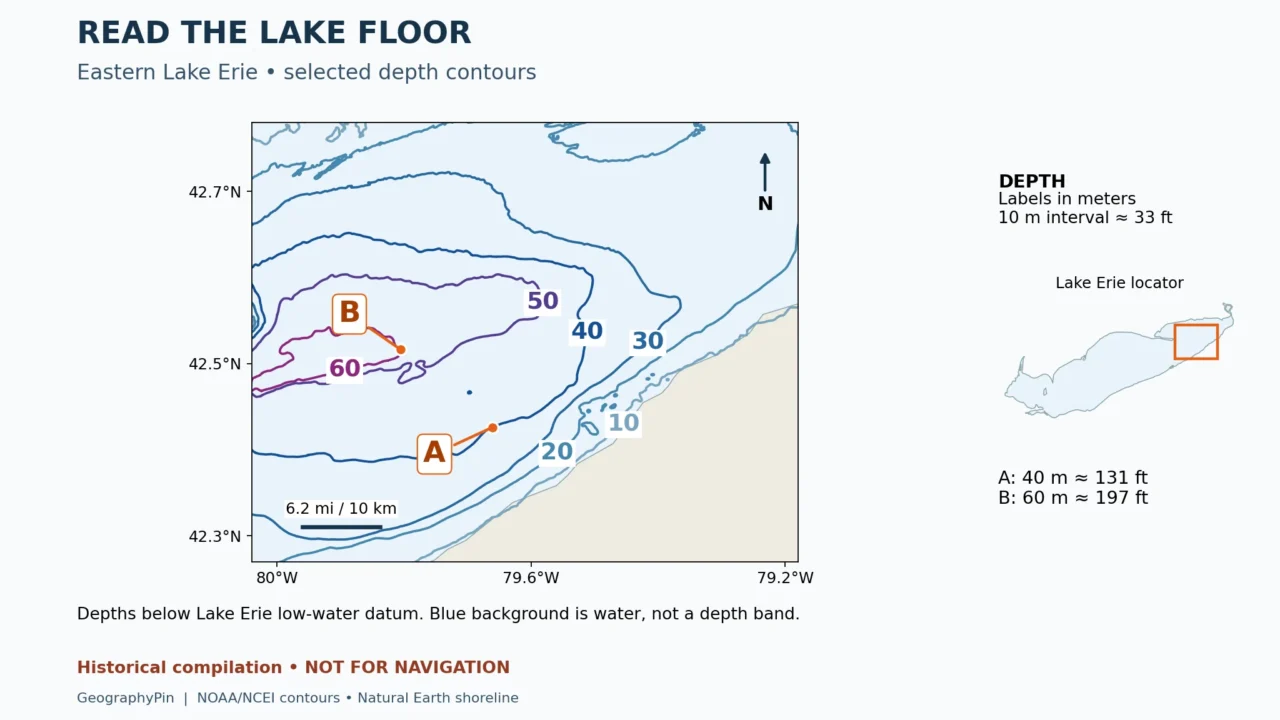
This close-up uses original depth-contour geometry from NOAA NCEI’s Bathymetry of Lake Erie and Lake St. Clair dataset, published in 1999. The view covers part of eastern Lake Erie; the orange rectangle in the locator identifies its position within the larger lake. It is not a map of the whole lake.
Only the source’s 10, 20, 30, 40, 50 and 60 meter contours are displayed. These selected levels are about 33 feet (10 meters) apart vertically. We retained the original lines rather than generating a new interpolated surface. Line color distinguishes contour depths; the uniform pale blue between them represents water, not a depth category.
Try the map, then check the answers
- Which marked position, A or B, has the greater mapped depth?
- How much greater is it?
- How many displayed contour intervals separate their depth values?
- Can the blue area between the lines establish an exact depth there?
- Does the map establish today’s water depth at A?
Answer key: B has the greater mapped depth. A lies on an original 40-meter contour, approximately 131 feet below the lake’s low-water datum; B lies on an original 60-meter contour, approximately 197 feet below it. The difference is about 66 feet (20 meters), or two selected 10-meter intervals. The blue background supplies no exact intermediate value. Neither point establishes today’s water depth: the reference is a fixed datum and the compilation is historical.
The two points were placed on existing contour vertices, not estimated between lines. That makes the exercise reproducible, but it does not turn either point into an independent sounding or give the compilation survey-grade precision. A and B are teaching annotations added to the map.
The generalized shoreline is a separate Natural Earth context layer. It is not the source’s exact hydrographic shoreline, so small nearshore mismatches should not be interpreted as water-level change. The scale bar represents an approximate horizontal distance of 6.2 miles (10 kilometers), not a vertical depth difference.
5. Separate resolution from survey accuracy
Three kinds of detail are easy to confuse: how finely the map is displayed, how closely the model’s cells are spaced, and how well the bottom was actually observed. A crisp image proves only that the image is crisp.
| Term | What it describes | What it does not prove |
|---|---|---|
| Image resolution | The pixels used to display the map | That more seabed measurements were collected |
| Grid spacing | The distance between model cells | That every cell contains an independent observation |
| Contour interval | The chosen vertical step between lines | That depth error is smaller than that step |
| Survey coverage | Where observations were acquired | Uniform quality across every date and instrument |
Interpolation fills a model, not a knowledge gap
Interpolation estimates values between known data. Resampling an existing grid into smaller cells can make it easier to display alongside another layer, but it does not reveal previously unmeasured rocks or channels. Likewise, drawing contours at smaller intervals can create more lines without adding evidence.
Imagine two measured locations with no observation between them. A smooth connecting surface is one possible model, but it cannot rule out a small intervening hollow or rise. Where the source coverage is sparse, report the broad landform with more confidence than an exact depth at an arbitrary pixel.
NOAA Ocean Exploration’s explanation of seafloor mapping distinguishes sonar measurements from the broad seafloor shape inferred using satellite altimetry. A seamless ocean map can combine very different kinds of evidence. An apparently detailed patch beside a smooth patch may reflect survey coverage rather than a sudden change in geological complexity.
For any map, look for acquisition dates, source-survey coverage, the processing method and reported uncertainty. A download or publication date is not necessarily the date the bottom was surveyed. Avoid assigning an accuracy figure when the metadata does not provide one.
6. Know when a bathymetric map is not enough
Educational bathymetry helps explain terrain. A nautical chart serves navigation and includes additional information such as navigational aids and obstructions. NOAA’s chart-versus-map explanation makes this difference explicit. A bathymetric image that lacks a symbol for a wreck has not proved that no wreck is present.
For navigation, use the appropriate official, maintained chart products and associated updates, local information and competent navigation practices. Do not use this article’s map to choose a passage, anchorage or diving depth. The NOAA Great Lakes dataset used here expressly excludes navigational use.
For classroom or research interpretation, a useful final check is to state your conclusion and its limit together: “The mapped bottom slopes toward the deeper contours here; this image does not establish present-day water depth or clearance.” That is more informative than either treating every pixel as exact or dismissing the whole map as useless.
If you need to understand the shape along a line rather than across a whole area, a cross-section can help. The principles in reading a topographic profile also explain horizontal versus vertical scale. Apply the correct underwater reference and sign convention, and do not mistake vertical exaggeration for the actual slope.
Frequently Asked Questions
Can a bathymetric map show whether the bottom is sand or rock?
Not from depth contours alone. Bottom-material information requires a separate layer or supporting observations, such as samples or interpreted acoustic data. Read that layer’s own legend and evidence rather than treating a depth color as a sediment type.
Can two correct maps show different depths at the same place?
Yes. Different datums, units, survey dates, processing methods or levels of generalization can produce different displayed values. Compare those properties before deciding that either map contains an error. Persistent discrepancies need examination of the original surveys.
Does a blank area mean the water is shallow?
No. Blank space can mean missing data, a masked area or a display choice. Unless the legend explicitly assigns a depth range to it, treat it as unknown rather than zero depth.
What Did We Learn Today?
A useful bathymetric interpretation combines the numbers, their reference and the evidence behind them. Contours describe the modeled bottom; water levels determine a different, changing surface above it. Read the units, datum, interval and legend together, then limit your conclusion to the detail the survey and map can actually support.
Sources & Data Notes
The real-data exercise uses NOAA’s historical Lake Erie bathymetric compilation, not a current survey or navigation chart. Original metric contour values are retained to match the source; rounded customary equivalents support reading without changing those labels. The separate arithmetic examples are hypothetical. Datum and processing differences must be checked for each product.
- Natural Earth: 1:10m lakes, public-domain shoreline context
- NOAA NCEI: Great Lakes Bathymetry, Lake Erie data and compilation notes
- NOAA NCEI: Digital Elevation Model FAQs, datums and reuse conditions
- NOAA National Ocean Service: What do the numbers mean on a nautical chart?
- NOAA Ocean Exploration: Topographic and bathymetric maps
- NOAA Ocean Exploration: Seafloor Mapping
- NOAA National Ocean Service: Nautical charts and maps