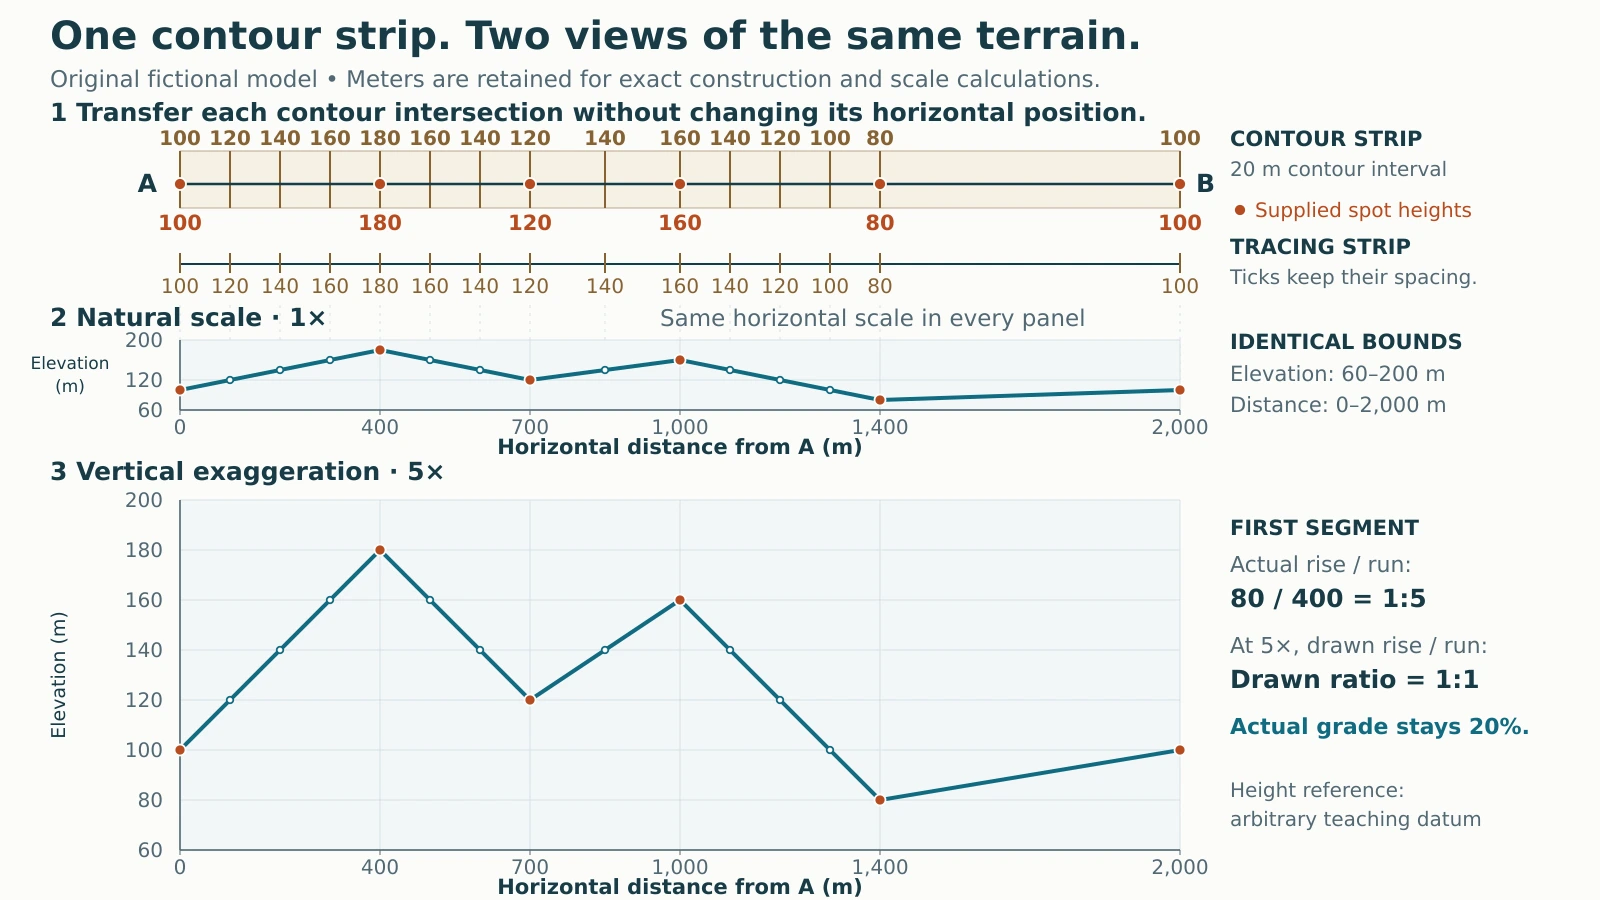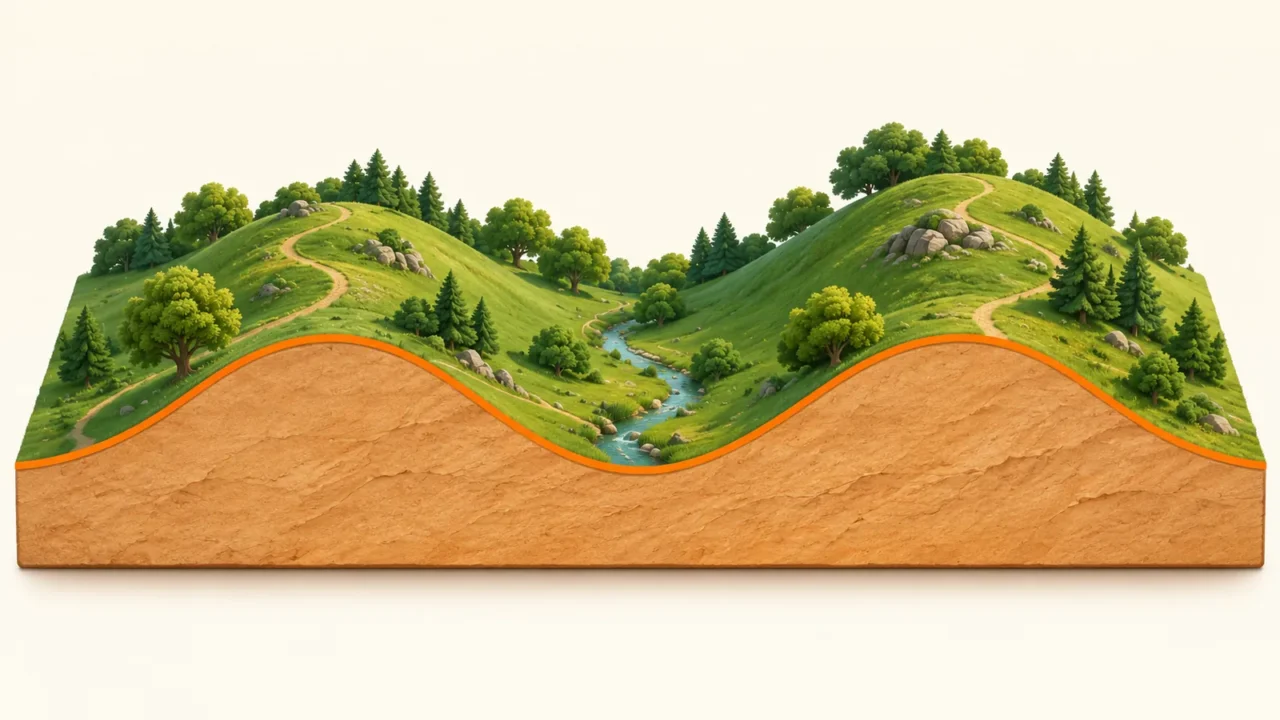
A topographic profile turns a line across a map into a side view of the land. Its hills can look much steeper than the terrain actually is because the vertical axis may use a different scale. Building one profile, then changing only that scale, makes the difference clear.
To read a topographic profile, follow horizontal distance along the bottom axis and elevation along the vertical axis. Check the direction, units, height reference and vertical exaggeration before judging slope. To construct one, preserve each contour intersection’s position along the chosen line, then plot its elevation. The connecting line depends on the information and assumptions available.
How to use this article: You can transfer the contour marks, calculate vertical exaggeration, or check the elevation totals.
1. Define the Line and Its Reference
A profile describes the surface along a chosen line, here from A on the left to B on the right. The horizontal axis records distance measured from above, not distance over every rise and dip. Elevations refer to a datum, the stated reference for height.
For the prerequisites, use GeographyPin’s map-reading guide to scale and contours. This exercise adds the complete profile-construction step.
Our fictional line spans about 1.24 miles (2 kilometers). Six supplied heights define the model, with straight slopes between them. Extend that surface unchanged perpendicular to A–B across a narrow strip: this produces deliberately straight ridge and trough axes. These are assumptions, not surveyed peaks.
| Point | Horizontal distance from A | Elevation above teaching datum |
|---|---|---|
| A | 0 ft (0 m) | 328 ft (100 m) |
| First high point | 1,312 ft (400 m) | 591 ft (180 m) |
| First low point | 2,297 ft (700 m) | 394 ft (120 m) |
| Second high point | 3,281 ft (1,000 m) | 525 ft (160 m) |
| Second low point | 4,593 ft (1,400 m) | 262 ft (80 m) |
| B | 6,562 ft (2,000 m) | 328 ft (100 m) |
The diagram retains meters so its exact inputs, contour interval and scale arithmetic remain consistent. Heights use an arbitrary teaching datum, not sea level.
2. Transfer Every Contour Intersection
Keep the marks in their original positions
The NSW Department of Education’s construction lesson uses a paper edge to carry contour positions from map to graph. Apply that method to the strip:
- Align the edge with A–B and mark both endpoints.
- Mark each place where a contour meets the line and write its elevation.
- Retain separately identified spot heights, including turning points.
- Transfer the marks to a distance axis with the same horizontal scale.
- Plot each mark at its labeled elevation.
Our contour interval is about 66 feet (20 meters). Equal height intervals do not require equal horizontal gaps. The 140-meter contours meet A–B at distances of 200, 600, 850 and 1,100 meters. Each is a separate intersection, even though the labels match.
Include a contour that touches a high or low point without crossing to the other side of its elevation. At the first high point, the 180-meter contour supplies one mark, not two. Shared segment endpoints are counted once.

3. Compare Natural and Exaggerated Scales
At natural scale, or 1×, one unit of elevation occupies the same drawn length as one unit of horizontal distance. At 5×, each vertical unit occupies five times that length. The elevation values and their horizontal positions stay unchanged.
Calculate the factor from matching units
Waldron and Snyder’s topographic-profile explanation defines vertical exaggeration as vertical scale divided by horizontal scale, with both scales expressed as fractions.
For a specified-size print, suppose 1 centimeter horizontally represents 200 meters, while 1 centimeter vertically represents 40 meters. Those scales are 1:20,000 and 1:4,000:
VE = (1/4,000) ÷ (1/20,000) = 20,000 ÷ 4,000 = 5.
This print example does not assign a fixed ground length to a centimeter on your screen. Read the plotted axis intervals instead. Resize the entire figure uniformly; stretching its height independently changes its exaggeration.
As Esri’s definition explains, exaggeration makes relief more prominent. This axis choice is separate from the world-map projection distortion discussed in our Equal Earth map comparison.
4. Read the Terrain Values, Not the Apparent Steepness
Equal endpoints can hide repeated climbs
A and B both stand about 328 feet (100 meters) above the teaching datum. Their net elevation difference is zero, but the profile includes three climbs and two descents. Use the exact metric heights to total them:
- Ascent: 80 + 40 + 20 = 140 meters, about 459 feet.
- Descent: 60 + 80 = 140 meters, about 459 feet.
- Relief along A–B: 180 − 80 = 100 meters, about 328 feet.
The first segment rises about 262 feet (80 meters) over a horizontal run of about 1,312 feet (400 meters). Its grade is 80 ÷ 400 × 100 = 20% in both panels.
In the 5× panel, that rise is drawn five times taller, so the segment appears to have a 1:1 rise-to-run ratio. The actual model ratio remains 1:5. Reading the angle of the exaggerated line as a real slope would incorrectly turn a 20% grade into 100%.
5. Keep Interpolation Separate From Evidence
Connecting known heights means choosing how to represent the ground between them. Here the straight connections are exact because we defined them as part of the fictional model. A real contour map does not normally establish constant slope between every crossing.
Ordnance Survey’s relief guide distinguishes labeled spot heights from contours. Neither makes the terrain between known points fully observed.
For a separate ordinary hill with a highest closed contour of 180 meters and a 20-meter interval, an unlabeled summit is at least 180 but below 200 meters, assuming all relevant contours are shown and the hill rises inward. The contour alone cannot justify an exact 190-meter summit.
Do not smooth a profile into invented bumps or treat a smooth curve as measured detail. Missing terrain detail also limits ascent and descent estimates. Our exact totals belong to this defined model, not to a real route.
What Did We Learn Today?
A reliable profile keeps contour intersections in their correct horizontal positions, identifies supplied heights and states how the points are connected. Changing vertical scale alters the drawing’s steepness without changing elevation, relief or grade. Equal endpoint heights conceal the repeated climbs in this model, while real maps require more caution about what happens between known points.
Sources & Data Notes
The six points, straight slopes and perpendicular extension are original fictional assumptions. Calculations use exact meter inputs; US customary equivalents are rounded using 1 foot = 0.3048 meter. The drawing is not a survey, a real route or a geological cross-section.