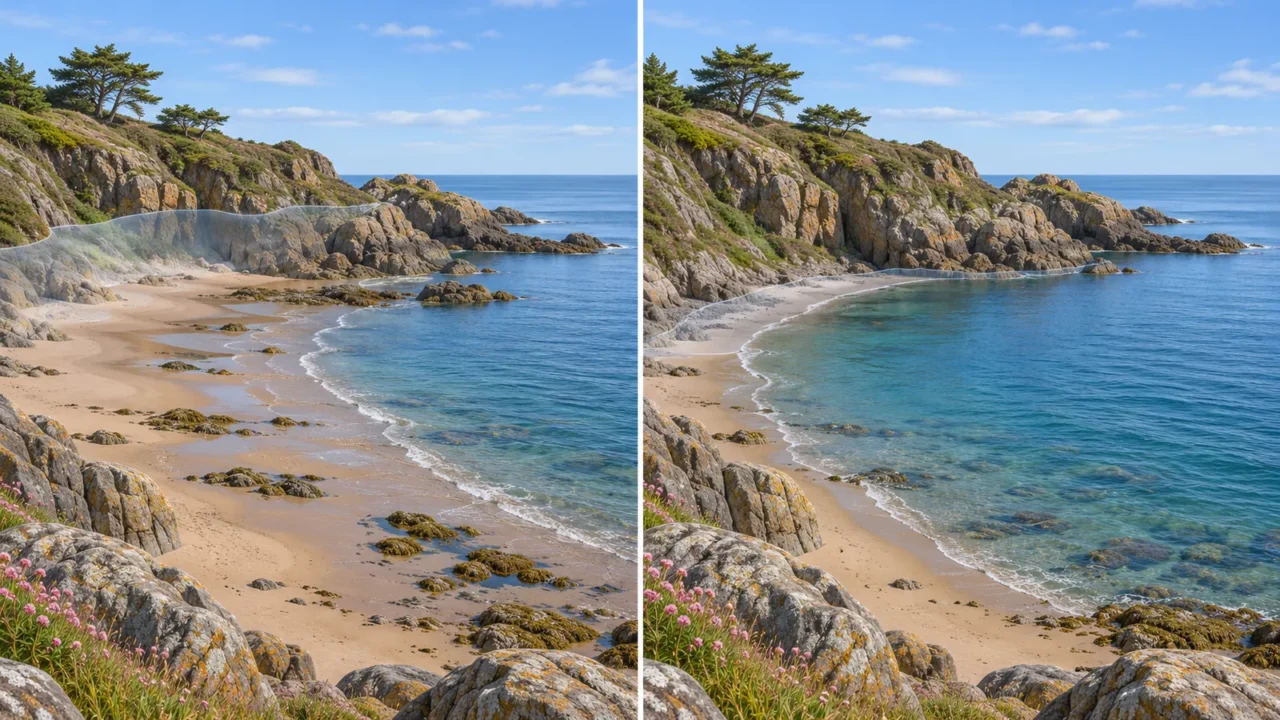
A beach can reveal much more sand at one low tide than at another a week later. Spring and neap tides help explain this changing range, but a Moon-phase calendar cannot tell you exactly when the water will rise at a particular shore. The key is to separate tidal range, daily timing and local conditions.
Spring tides have a larger difference between high and low water, generally around new and full moons. Neap tides have a smaller difference, generally around first- and last-quarter moons. These describe changes in tidal range, not seasons or individual high and low tides. Local geography can shift the timing and strength of the pattern.
How to use this article: You can calculate a tidal range, understand the Moon’s position, separate daily and monthly cycles, or check a local prediction.
Start with Tidal Range, Not High Tide Alone
Subtract low-water height from high-water height
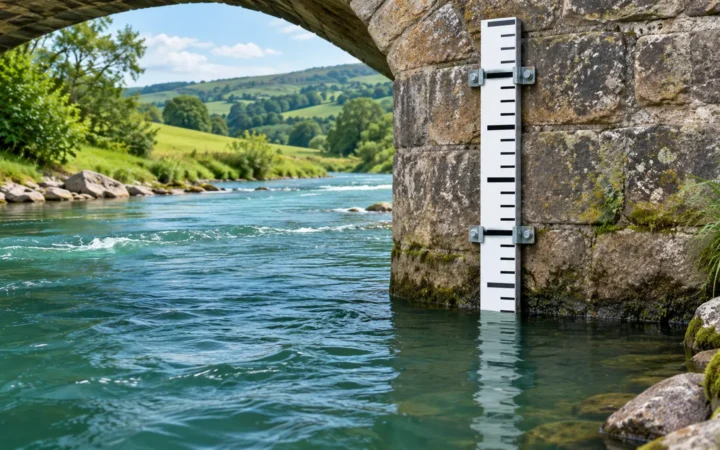
Tidal range is the vertical difference between a high water and the adjoining low water. The Australian Bureau of Meteorology’s tide guide distinguishes this range from the water level at a single moment.
Consider two fictional high–low pairs at the same station. Every height uses the same reference elevation, or datum. The first pair represents a larger-range part of the cycle; the second represents a smaller-range part.
| Illustrative pair | High-water height | Low-water height | Range |
|---|---|---|---|
| Spring-tide pair | 8 ft (2.44 m) | −1 ft (−0.30 m) | 9 ft (2.74 m) |
| Neap-tide pair | 6 ft (1.83 m) | 2 ft (0.61 m) | 4 ft (1.22 m) |
The first calculation is 8 − (−1) = 9 feet. Subtracting a negative adds its magnitude. The second is 6 − 2 = 4 feet. These are invented teaching values, not observations or predictions for a real coast.
A negative height means below the chosen datum, not below the seabed. As NOAA’s datum reference explains, heights need a defined reference. Changing both heights by the same datum offset leaves their difference unchanged; mixing datums makes the calculation invalid.
Spring and Neap Tides Follow Different Alignments
Compare alignment with a right-angle configuration
Tides arise from differences in gravitational pull across Earth, not just the total pull on the planet. NOAA’s JetStream explanation describes why the nearer and farther parts of Earth experience different lunar attraction.
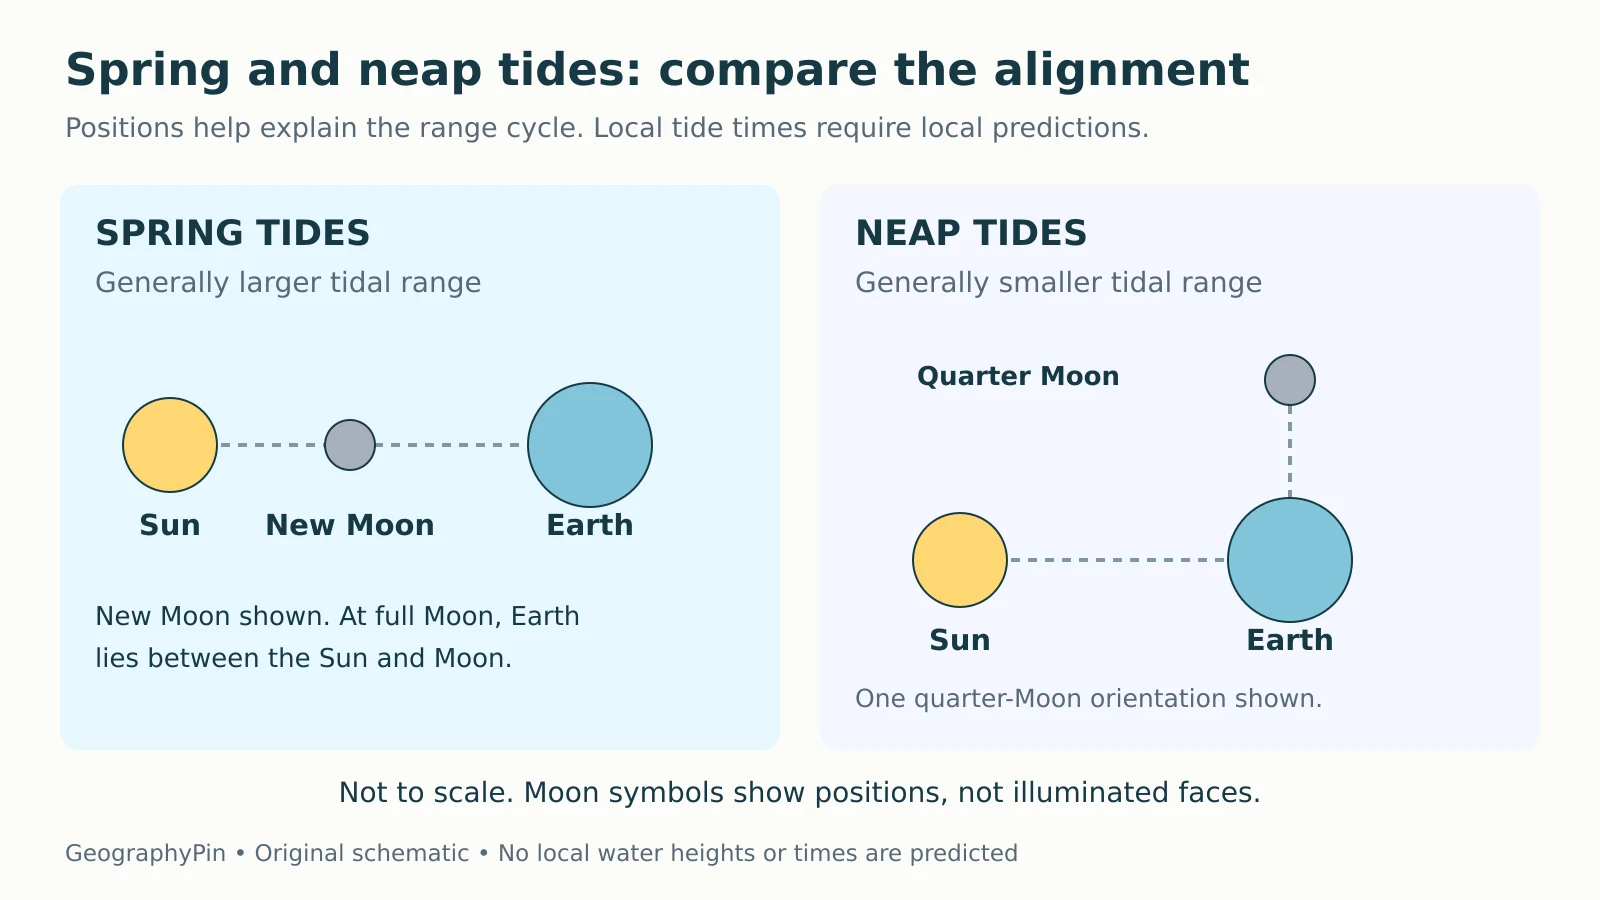
Around new and full moons, the Sun, Earth and Moon are approximately aligned. Their tide-generating effects reinforce one another, producing the familiar spring-tide range increase. Around first and last quarter, the directions from Earth to the Sun and Moon are roughly perpendicular, and the solar contribution partly offsets the lunar range-producing effect.

NOAA’s tidal-variation lesson describes two spring and two neap periods per lunar month. “Spring” is unrelated to the season. A spring tide includes both higher high waters and lower low waters relative to the smaller-range part of the local cycle; it is not another name for high tide.
Do Not Confuse Monthly Range with the Daily Pattern
Ask how often high and low water occur
The spring–neap pattern changes the size of the range over roughly two weeks between successive spring-tide periods. It does not say that a place has high tide only twice a month. High and low waters continue through that larger cycle.
A lunar day follows Earth’s rotation relative to the Moon and averages about 24 hours 50 minutes, slightly longer than a calendar day.
| Pattern | Typical behavior per lunar day |
|---|---|
| Diurnal | One high water and one low water |
| Semidiurnal | Two high waters of similar height and two low waters of similar height |
| Mixed semidiurnal | Two high waters and two low waters, with unequal heights |
These NOAA tidal-cycle categories describe the daily pattern. They should not be treated as a promise of exactly two highs within every midnight-to-midnight calendar day.
The simple spring–neap picture is clearest where semidiurnal tides are important. Some places have more complicated patterns or very little tidal range. Read the local series rather than forcing every coastline into one idealized curve.
Local Geography Changes the Response
The ocean cannot respond as a uniform, unobstructed shell of water. Basin depth, continental shelves, coastline shape and restricted entrances affect how tides move and how large they become. A funnel-shaped bay can amplify a tide, while shallow or narrow connections can reduce it.
NOAA’s guide to additional tidal influences also describes how river flow and weather can alter local water levels. This is why a spring tide at one coast need not have a larger range than a neap tide somewhere else.
There can also be a delay between the astronomical alignment and the greatest or smallest local range. The Bureau of Meteorology notes that spring tides commonly occur within a few days of new or full Moon. Use “around,” not an exact universal date or time.
Coastal geometry matters here, but it is a separate classification question from the distinctions in Gulf vs Bay vs Fjord. The name of a water body does not, by itself, tell you its tidal range.
Perigean Spring Tides and King Tides Need Careful Labels
The Moon’s distance from Earth varies. Near perigee, its closest point, the lunar tide-generating effect is stronger. When perigee occurs near new or full Moon, it can enhance a spring tide. The effect at a particular coast still depends on its local response.
NOAA defines “king tide” as a popular, non-scientific term for exceptionally high tides. It is not a separate universal measurement scale or a synonym for every spring tide. The label alone supplies neither a water height nor a flooding threshold.
Likewise, neap does not mean “the day’s low tide” or “no tide.” Smaller range still allows high and low waters, and does not establish that a coastal activity is safe.
Read the Local Prediction Before Drawing a Conclusion
Check the station, time and reference level
NOAA’s prediction guide makes several settings explicit. They are useful checks on any tide table:
- Location and date: confirm the named station and the intended day, rather than borrowing a nearby port’s times.
- Time basis: check the time zone, daylight-saving treatment and 12- or 24-hour clock.
- Units and datum: distinguish feet from meters and identify the reference elevation.
- Product and limits: distinguish predicted tide heights from observed water levels, current predictions and weather warnings.
NOAA’s tides-and-currents FAQ cautions that slack water does not generally coincide with high or low tide. A water-height table is not a timetable for current speed or direction.
The Bureau of Meteorology’s cautionary note explains that predictions assume average weather and seasonal conditions; some locations also have limited observations. Check current official coastal information and local restrictions for real activities. A larger or smaller astronomical range is an explanation, not a safety clearance.
To practice related distinctions among tides, currents and waves, continue with the Ocean Geography Quiz.
What Did We Learn Today?
Spring and neap tides describe larger and smaller tidal ranges, generally associated with aligned and right-angle Sun–Earth–Moon configurations. Calculate range from high and low heights using the same datum. Keep this monthly pattern separate from daily tide frequency, and use local predictions rather than Moon phase alone for actual times and heights.
Sources & Data Notes
The two high–low pairs and the alignment artwork are original teaching examples. Heights are fictional and use one common datum; metric equivalents are rounded from 1 foot = 0.3048 meter. The diagram shows simplified geometry, not body sizes, distances, illuminated Moon faces or a prediction for a particular coast.
- NOAA: Tides and Currents Glossary
- Bureau of Meteorology: Tides and sea level
- NOAA: Tidal Datums
- NOAA JetStream: Tides
- NOAA: Tidal Variations
- NOAA: Types and Causes of Tidal Cycles
- NOAA: Additional Tidal Influences
- NOAA: What Is a King Tide?
- NOAA: Tide Predictions Users Guide
- NOAA: Tides and Currents FAQ
- Bureau of Meteorology: Cautionary Note