A river gauge can display a rising line, a flow rate and a flood threshold on the same page. Those numbers answer different questions, and the highest point may be a forecast rather than a measurement. This worked example shows how to separate them before drawing a conclusion.
Start with the station, variable, units and timestamp. Stage is water-surface height relative to a stated reference; discharge is volume flowing past a section per unit time. Separate observations from forecasts, check data qualifications and compare stage only with that station’s flood thresholds. A gauge reading alone does not establish safe conditions.
How to use this article: You can understand the height reference, read the worked display, separate observations and forecasts, or interpret the local threshold.
Stage Is a Referenced Height, Not River Depth
Find the gauge datum before interpreting the number
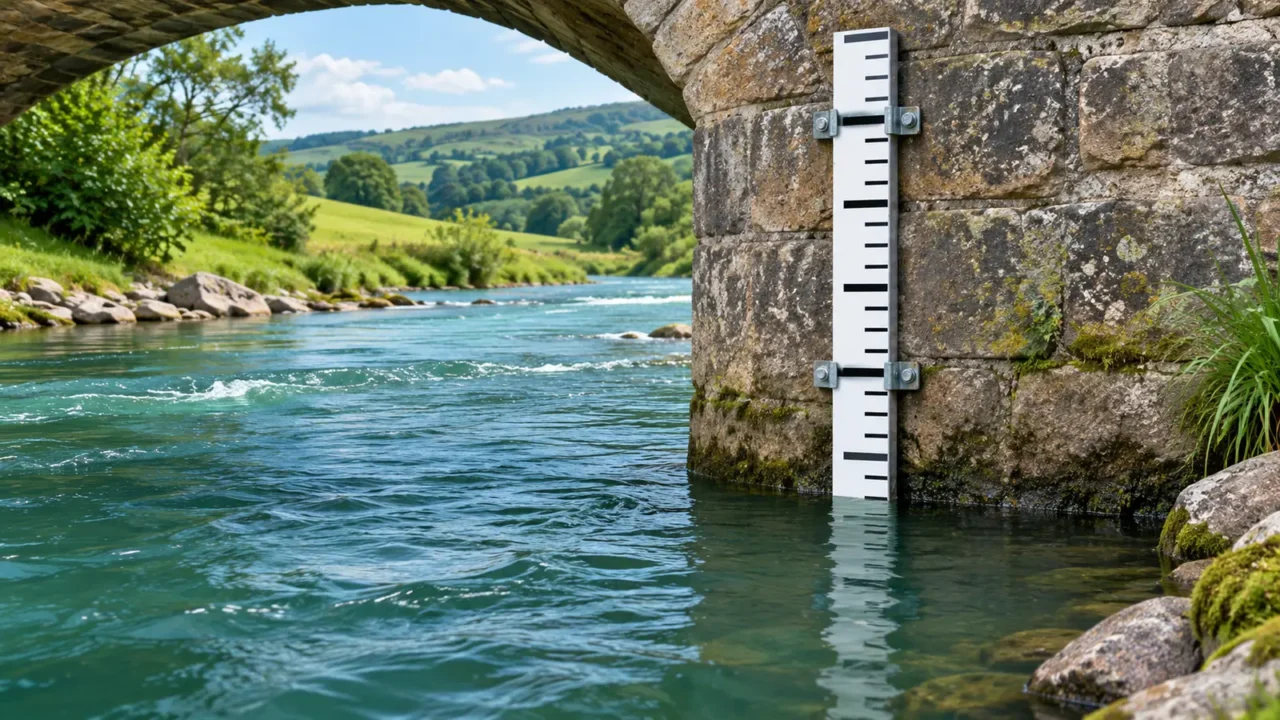
Stage, often labeled gage height in U.S. records, describes the water-surface height relative to a reference called a datum. It is not automatically the distance from the surface to the riverbed. The National Weather Service’s negative-stage explanation shows why even zero or a negative value does not necessarily mean a dry river.
Many stations use a local gauge datum. Others report a water-surface elevation tied to a broader vertical reference. Read the station metadata instead of assuming that every number is height above sea level. A local zero is not necessarily the channel bottom.
Two stations can both report 4 feet (1.22 meters) while having different water depths, elevations and flows. Their reference levels and channels differ. Compare readings at one station consistently, or establish compatible elevation references before making a cross-station height comparison.
Work Through a Fictional Gauge Display
Read the latest observation separately from the graph
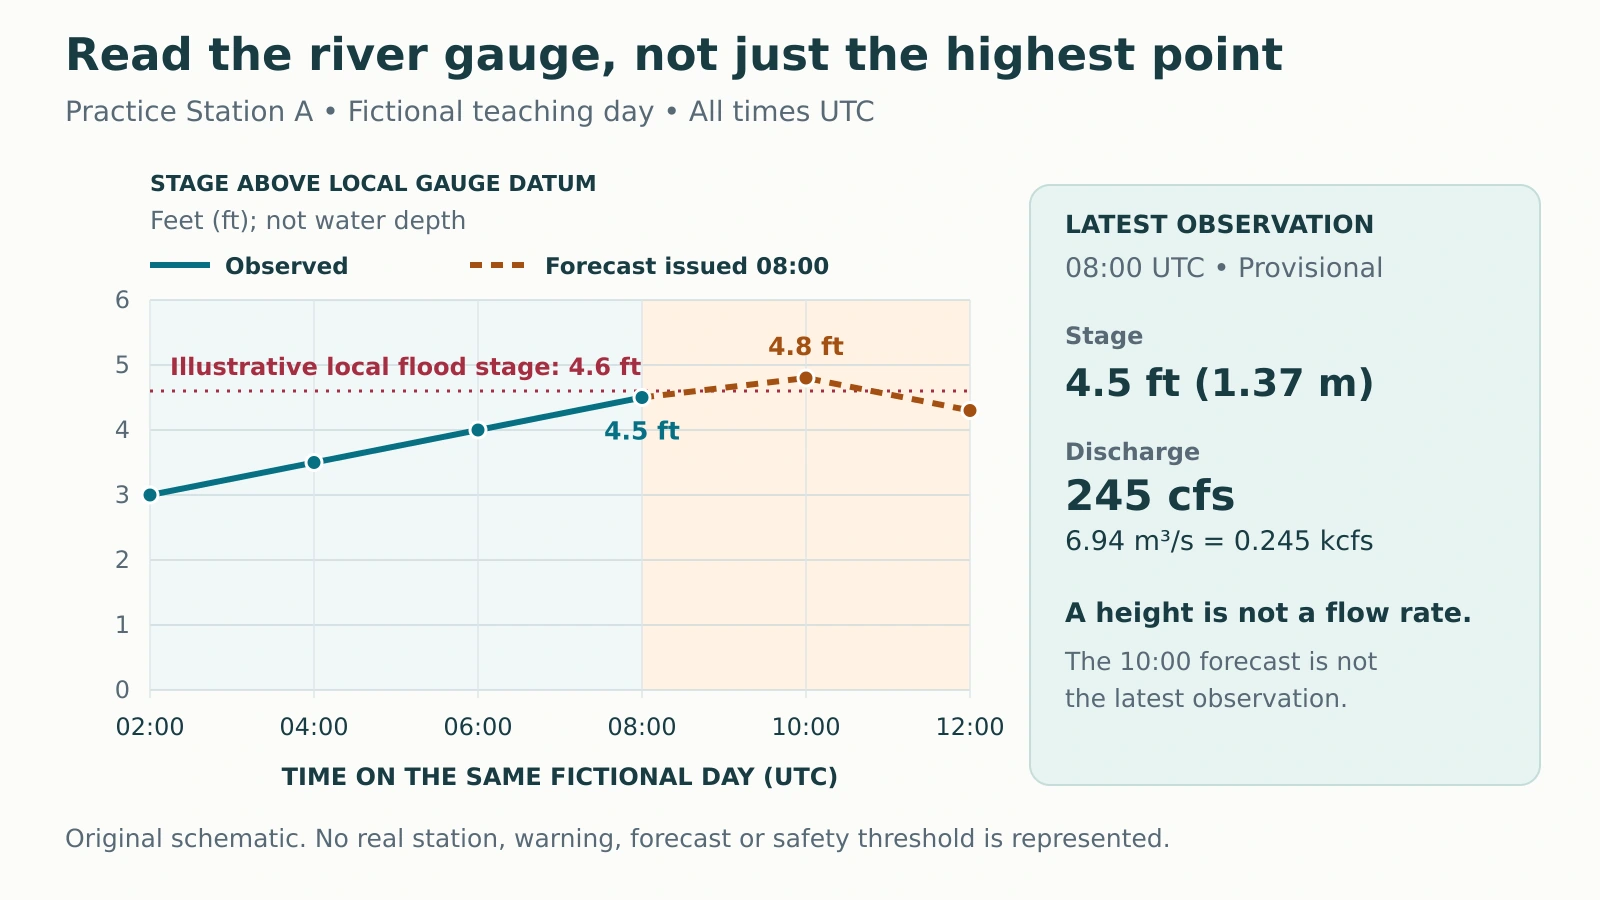
The original diagram below represents Practice Station A on a fictional teaching day. No real river, warning or forecast is shown. The stage axis uses feet above a local gauge datum; all times use UTC.

| Time, UTC | Stage above local datum | Status |
|---|---|---|
| 02:00 | 3.0 ft (0.91 m) | Observed |
| 04:00 | 3.5 ft (1.07 m) | Observed |
| 06:00 | 4.0 ft (1.22 m) | Observed |
| 08:00 | 4.5 ft (1.37 m) | Latest observed |
| 10:00 | 4.8 ft (1.46 m) | Forecast issued at 08:00 |
| 12:00 | 4.3 ft (1.31 m) | Forecast issued at 08:00 |
At 08:00, the latest observed stage is 4.5 feet (1.37 meters). The separate discharge field is 245 cubic feet per second, or cfs (6.94 cubic meters per second). These are a height and a volume rate, not two units for the same quantity.
From 02:00 to 08:00, observed stage rose by 1.5 feet (0.46 meters). That is a change in water level, not a water speed and not the amount of rain that fell.
A Forecast Point Is Not the Latest Observation
Check both the valid time and the issue time
The National Water Prediction Service hydrograph guide explains how river plots combine observations, forecasts, units and flood categories. A hydrograph shows how a water variable changes through time. Read its axis label: the variable may be stage or discharge.
In our example, 4.8 feet (1.46 meters) at 10:00 is a predicted level. It is not an observed crest. The forecast was issued at 08:00 and is valid for the future times shown. A later forecast could revise that predicted rise.
The red line is an invented local flood stage of 4.6 feet (1.40 meters). None of the displayed observations reaches it, while the 10:00 forecast exceeds it. The correct reading is “a threshold crossing is forecast,” not “the gauge has already measured flooding.”
For a real display, read the date as well as the time zone. Do not confuse the newest webpage update, the observation time and the forecast’s issue time. They need not be identical.
Discharge Measures a Volume Rate
The USGS streamflow-measurement guide distinguishes stage measurement from discharge measurement. Discharge is the volume passing through a river cross section per unit time. It is different from velocity, which measures distance traveled per unit time.
One basic relationship is Q = A × v: discharge equals wetted cross-sectional area multiplied by mean velocity through that section. As a separate fictional arithmetic example, 60 square feet (5.57 square meters) multiplied by 3 feet per second (0.91 meters per second) gives 180 cfs (5.10 cubic meters per second). Metric values here are rounded.
Mean velocity matters. A surface float or the fastest part of a channel does not necessarily represent the whole cross section. Actual measurements can divide the section into smaller parts or use acoustic instruments.
Also check abbreviations. A value in kcfs represents thousands of cfs: the example’s 245 cfs equals 0.245 kcfs. The river guide places discharge in the wider drainage-basin context.
A Rating Curve Connects Stage and Flow at One Site
Many streamgages continuously record water level and use a site-specific rating curve to estimate discharge. The USGS rating-curve explanation describes how measurements of flow at different stages establish that relationship.
You cannot convert feet directly into cfs with a universal multiplier. The channel’s shape and hydraulic conditions matter. A rating developed for one station is not automatically valid at the next bridge.
The relationship also needs maintenance. Erosion, sediment deposition, vegetation, debris or structural changes can alter how much water passes at a given stage. A continuously displayed discharge value is therefore not necessarily a separate direct field measurement made at that instant.
Some sites require additional information. The USGS New Jersey streamgaging overview describes index-velocity methods for difficult conditions such as variable backwater or tidal influence. It also identifies stage-only stations where streamflow is not computed. Check what the selected station actually provides.
Local Thresholds and Data Status Limit the Conclusion
Do not transfer a flood threshold to another river
A flood-stage threshold reflects impacts at a particular location. The NWS Chicago flooding FAQ distinguishes flood stage from bankfull stage: reaching the channel’s banks and reaching a defined impact threshold are not necessarily the same event.
A stage below that threshold is not permission to drive through water, enter a river or ignore an official warning. Conditions away from the gauge may differ. Use current official warnings, local restrictions and site-specific information for actual decisions.
Our latest-reading card also says provisional. USGS distinguishes provisional and approved data: provisional values have not completed the full review and may be revised. For formal comparisons, inspect the record’s qualifications and whether values are instantaneous, daily means or another statistic.
Reading a hydrograph is about matching each number to its question. “How high is the water here?” differs from “How much water passes?” and “What is predicted next?” For practice with flow calculations and catchment processes, use the Hydrology Quiz.
What Did We Learn Today?
Read the station and height reference before interpreting stage. Read discharge as a volume rate, not depth or speed. Separate observations from forecast values and compare them with the correct local threshold. In the fictional example, the latest observation is below the threshold while a later crossing is forecast; neither statement establishes safe conditions.
Sources & Data Notes
All station values, times, chart lines and the threshold are original fictional teaching material. The separate area–velocity calculation is also hypothetical. Unit conversions use 1 foot = 0.3048 meter and 1 cubic foot = 0.028316846592 cubic meter; displayed metric results are rounded. No real station rating or current river condition is asserted.
- NWS State College: How can a River Stage be Negative?
- National Water Prediction Service: About Hydrographs
- USGS Water Science School: How Streamflow is Measured
- USGS: Using a rating curve to convert gage height to streamflow
- USGS New Jersey Water Science Center: Streamgaging
- NWS Chicago: Flooding FAQ
- USGS Caribbean–Florida Water Science Center: Real-time and Historical Data