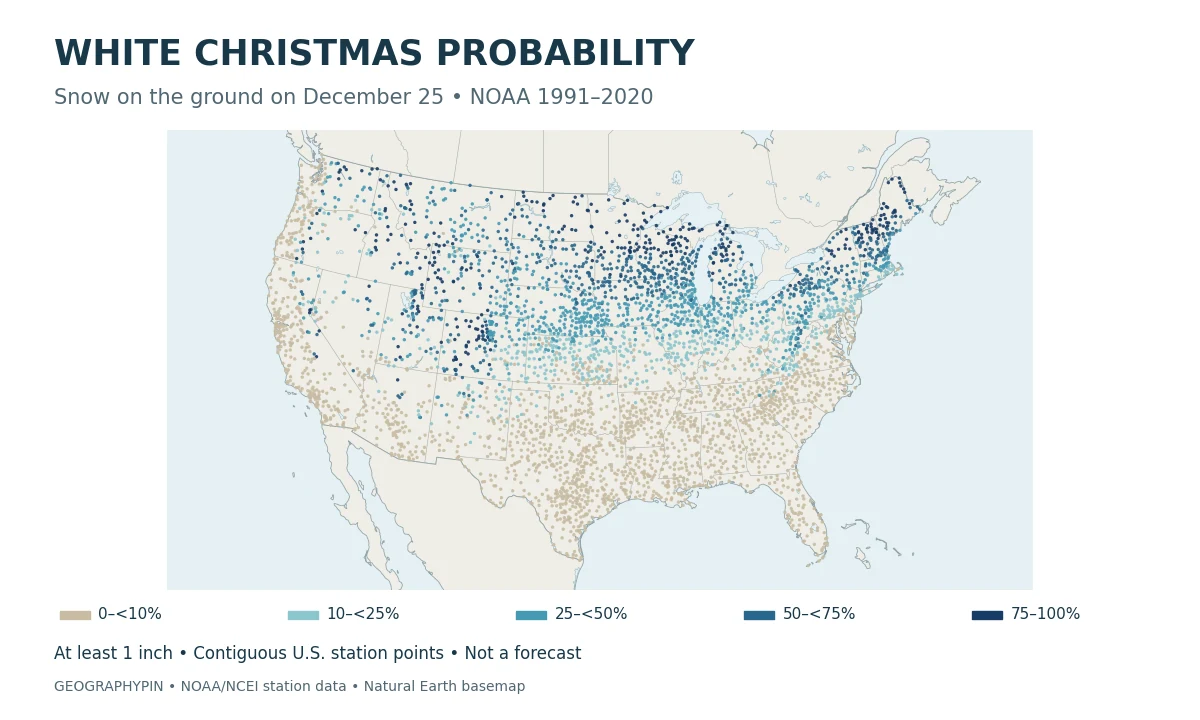
A white Christmas probability map answers a different question from a Christmas weather forecast. It shows where snow-covered ground has been more likely in the historical climate, not where a storm is expected this December.
NOAA’s white Christmas probability map shows the historical chance of at least 1 inch (2.54 centimeters) of snow on the ground on December 25, using the 1991–2020 U.S. Climate Normals. Snow can have fallen earlier. The map is not a forecast of fresh snowfall or a guarantee for any particular Christmas.
1. Read the White Christmas Probability Map
Each colored point below is a weather station with a published NOAA probability. The overview shows the contiguous United States; open a regional panel for larger labels and selected station values. Alaska and Hawaii examples appear in the table, not on these maps.
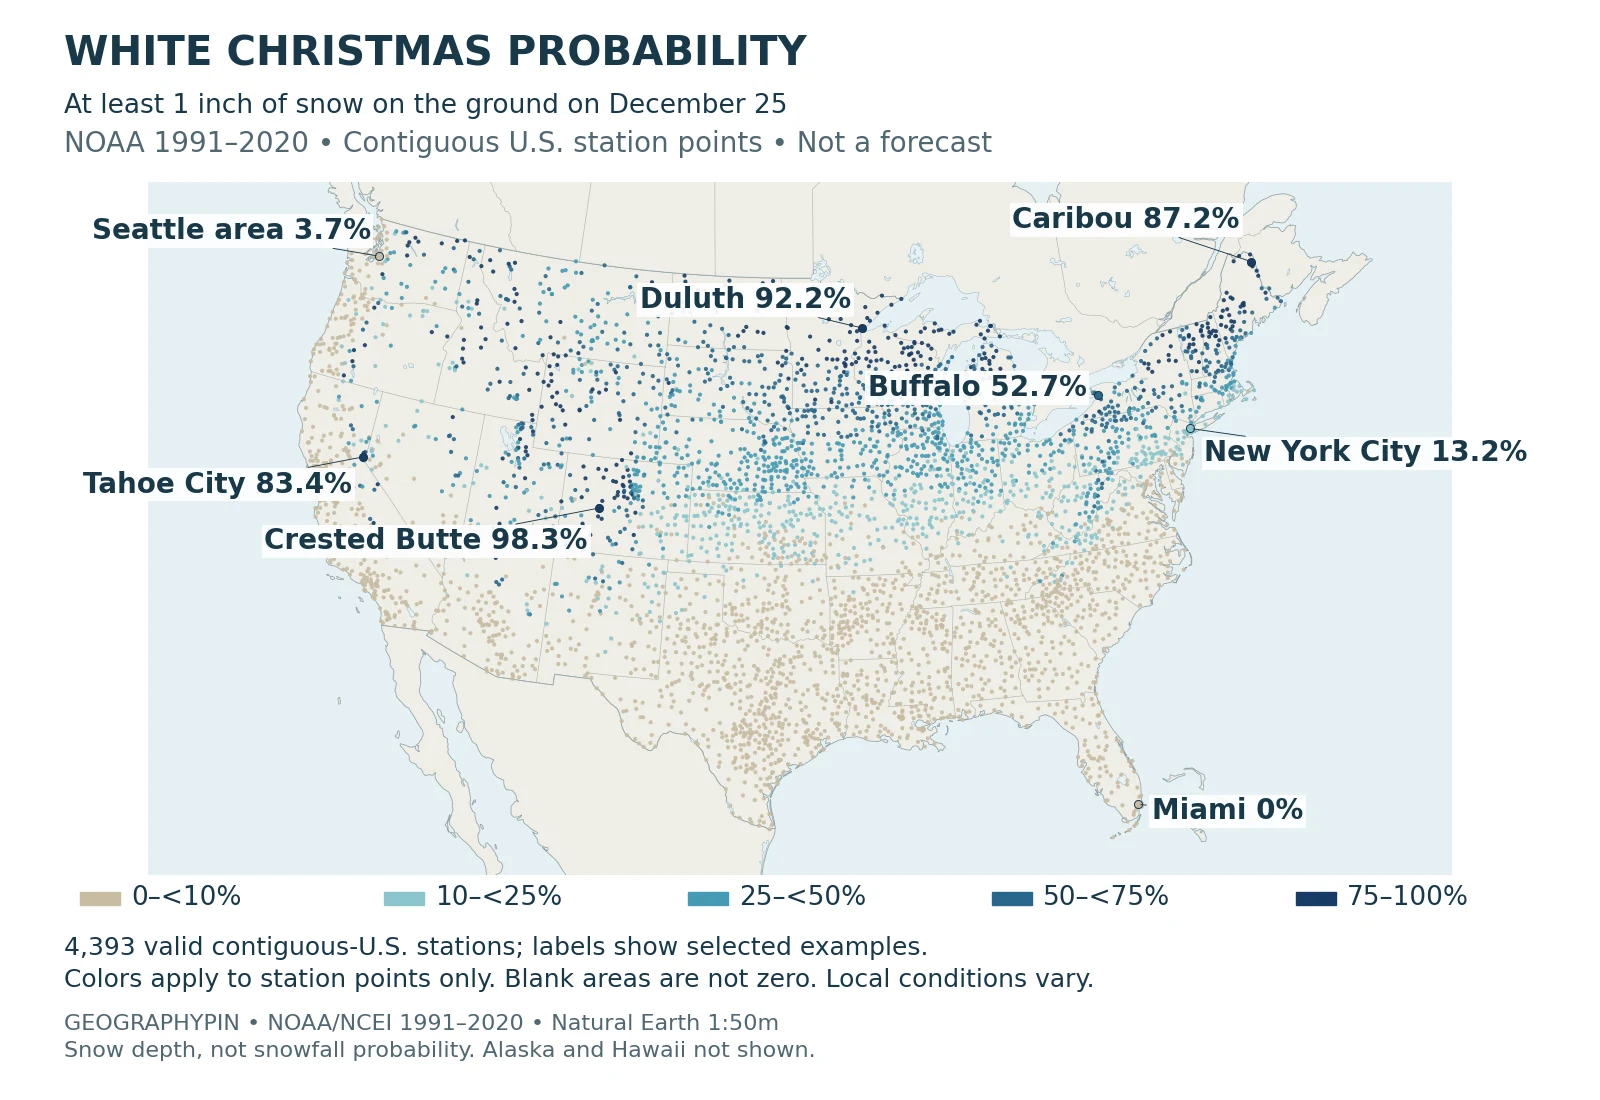
The five color groups run from 0 to less than 10%, 10 to less than 25%, 25 to less than 50%, 50 to less than 75%, and 75 to 100%. They describe probability, not inches of snow. Blank spaces between points do not mean zero probability, and dense clusters of stations should not be read as regional averages.
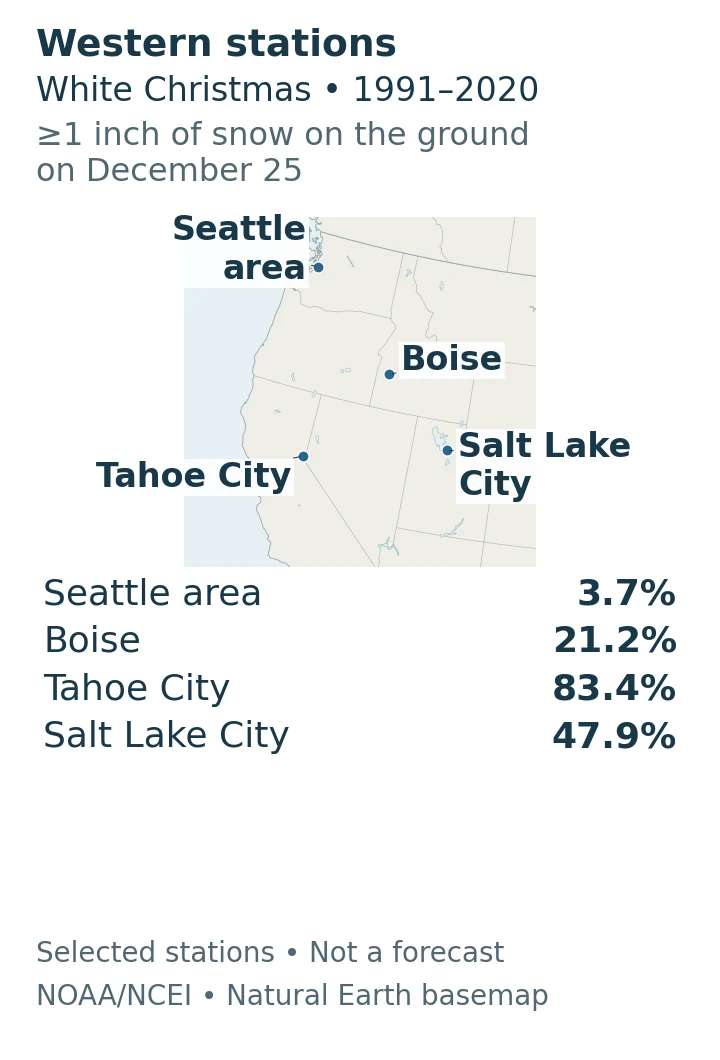
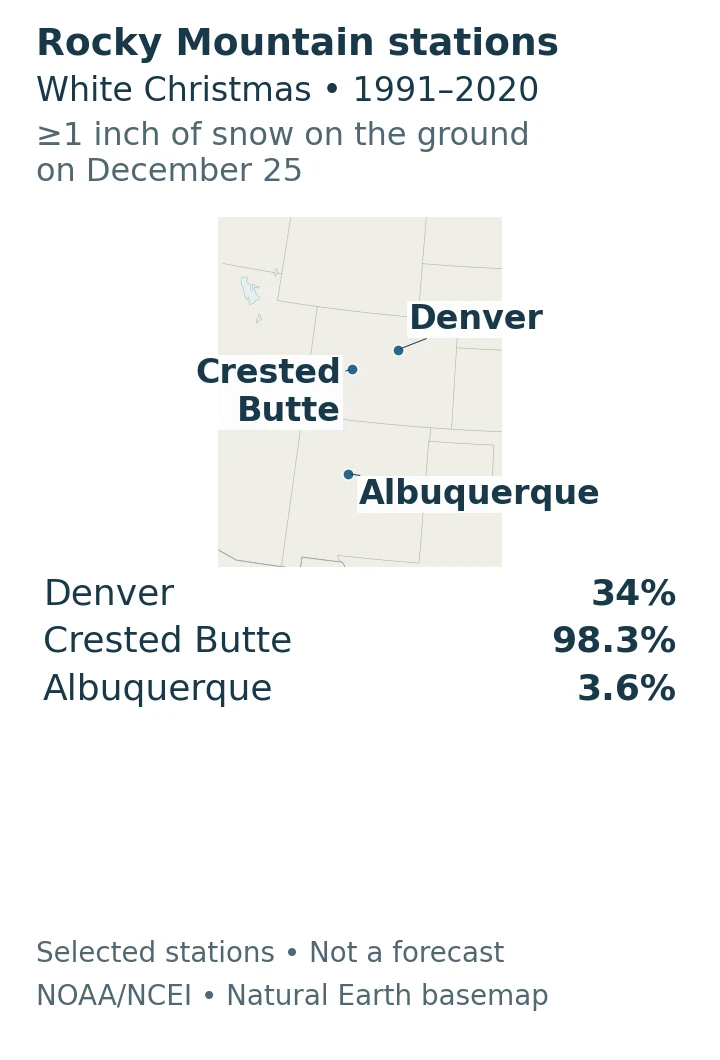
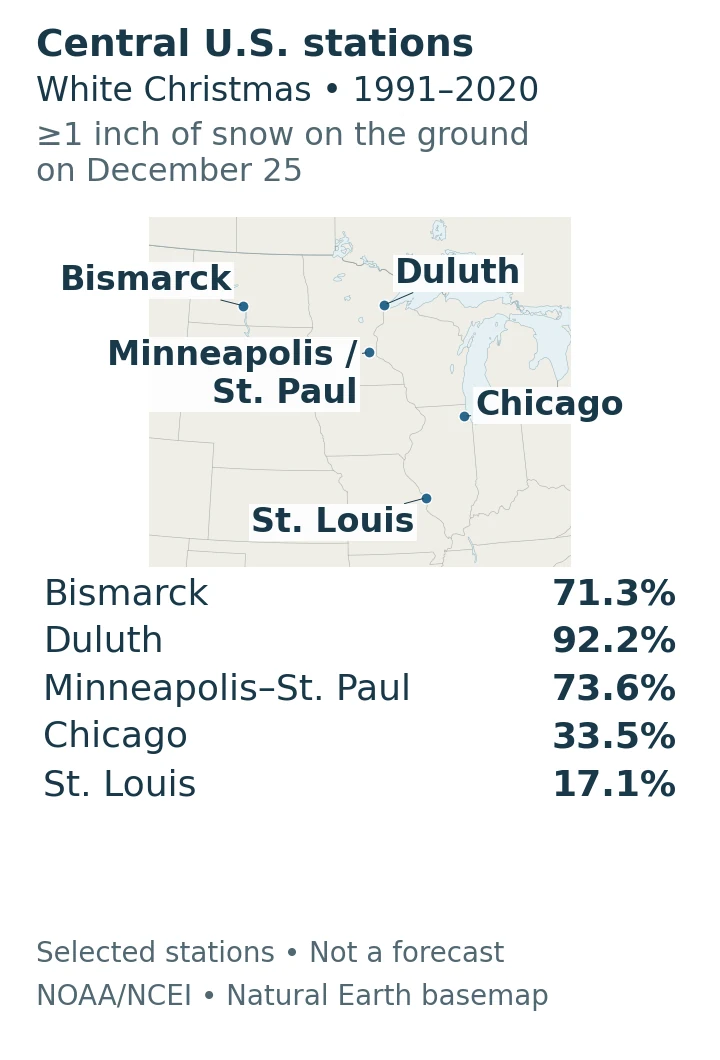
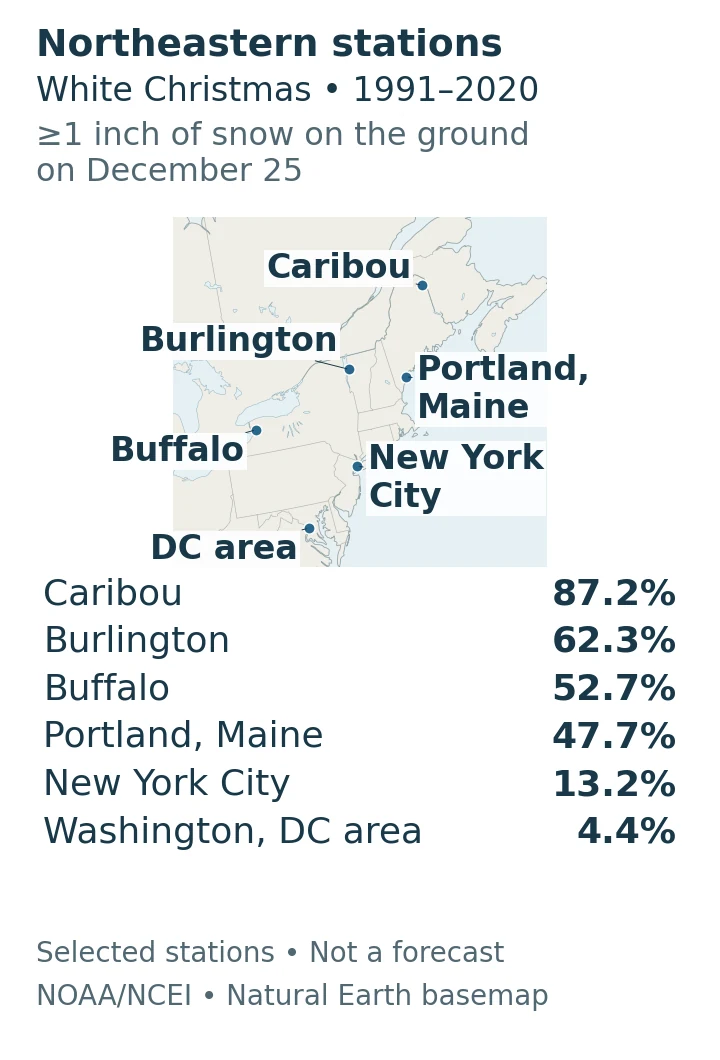
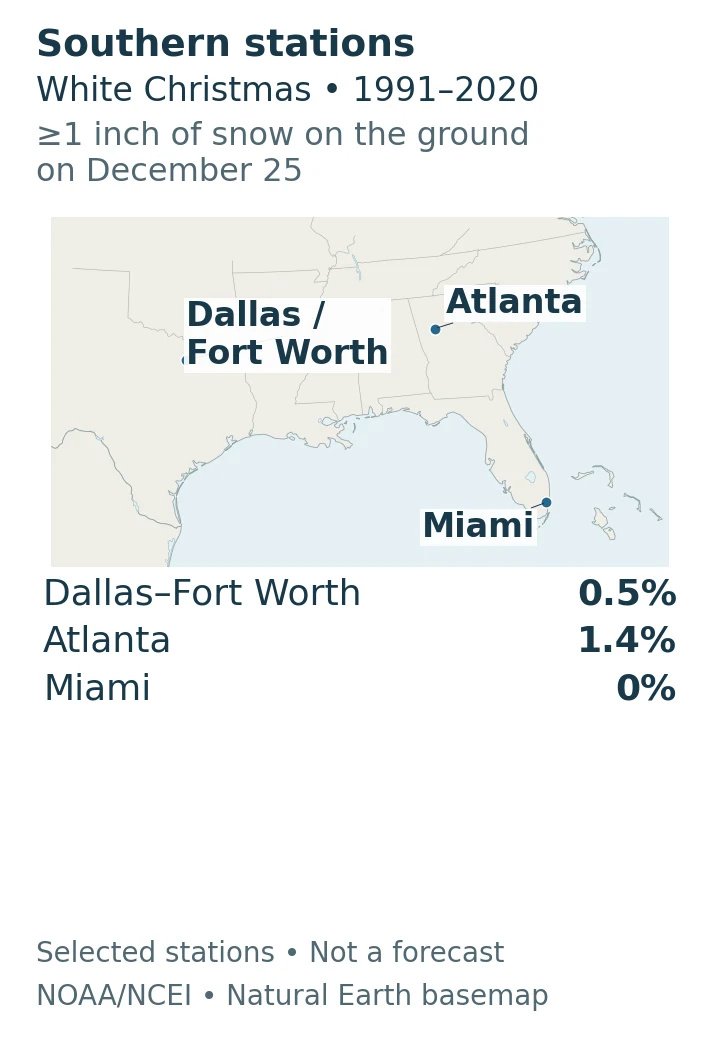
Regional close-ups: These panels use dark-blue locator dots for selected stations, with names and exact percentages listed beside the map. Their dots do not use the overview’s probability colors.
Western states: open station map
Rocky Mountains and Southwest: open station map
Central states and Upper Midwest: open station map
Northeast and Mid-Atlantic: open station map
Southern states: open station map
A location can meet the definition during a dry, clear Christmas if earlier snow remains on the ground. Conversely, falling flakes or a thin dusting need not produce the required snow depth. Annual snowfall totals answer another question again: how much snow falls over a much longer period.
2. Why the Odds Change Across the Country
NCEI highlights Minnesota, Maine, Upstate New York, much of Idaho, the Allegheny Mountains, the Rockies and the Sierra Nevada among the favorable regions. These are regional tendencies, not a promise for every location within a named state or mountain range.
Read the western United States by elevation as well as latitude. A mountain location and a nearby lowland city can belong to very different snow climates. A state-wide label hides that contrast, especially where mountain ranges rise above milder valleys and coastal areas.
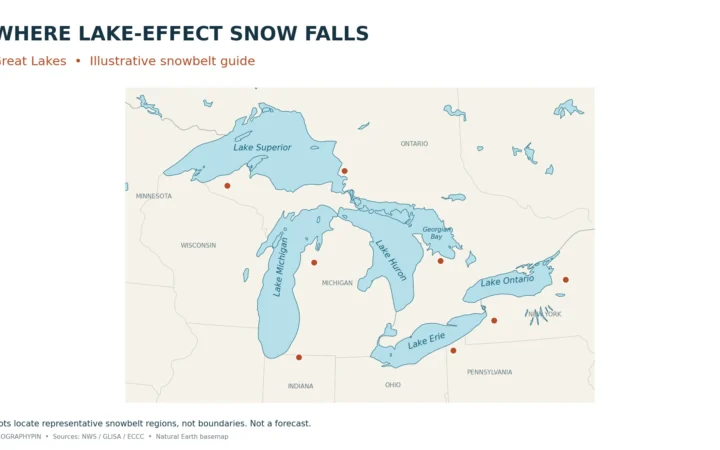
Near the Great Lakes, the supply of snow can vary sharply across short distances. Our Great Lakes lake-effect snowbelt map explains how lake position, wind and terrain shape recurring snowy regions. A snowbelt map is useful context, but it does not itself measure the probability that snow survives until Christmas.
The general lesson is to consider both snowfall and persistence. Snow must reach the ground, accumulate to the threshold and remain there until the observation. A snowy storm followed by melting can leave a different Christmas landscape from a smaller snowfall that stays frozen.
3. Compare Locations Without False Precision
The following 24 examples are an illustrative station selection, not a national ranking or a complete city list. The place label is a reading aid; the NOAA station name and ID identify the actual observation site. Alaska and Hawaii entries are explicitly included here even though the maps cover only the contiguous United States.
| Place and station | NOAA station ID | Probability |
|---|---|---|
| Fairbanks, AK (not mapped) FAIRBANKS INTL AP GSN | USW00026411 | 100% |
| Anchorage, AK (not mapped) ANCHORAGE INTL AP | USW00026451 | 93.7% |
| Crested Butte, CO CRESTED BUTTE | USC00051959 | 98.3% |
| Duluth, MN DULUTH | USW00014913 | 92.2% |
| Caribou, ME CARIBOU MUNI AP GSN | USW00014607 | 87.2% |
| Tahoe City, CA TAHOE CITY | USC00048758 | 83.4% |
| Minneapolis–St. Paul, MN MINNEAPOLIS/ST PAUL AP GSN | USW00014922 | 73.6% |
| Bismarck, ND BISMARCK GSN | USW00024011 | 71.3% |
| Burlington, VT BURLINGTON INTL AP GSN | USW00014742 | 62.3% |
| Buffalo, NY BUFFALO | USW00014733 | 52.7% |
| Salt Lake City, UT SALT LAKE CITY INTL AP | USW00024127 | 47.9% |
| Portland, ME PORTLAND INTL JETPORT | USW00014764 | 47.7% |
| Denver, CO DENVER-STAPLETON | USW00023062 | 34% |
| Chicago, IL CHICAGO OHARE INTL AP | USW00094846 | 33.5% |
| Boise, ID BOISE AIR TERMINAL GSN | USW00024131 | 21.2% |
| St. Louis, MO ST LOUIS LAMBERT INTL AP | USW00013994 | 17.1% |
| New York City, NY NEW YORK CNTRL PK TWR | USW00094728 | 13.2% |
| Washington, DC area, VA WASHINGTON REAGAN AP GSN | USW00013743 | 4.4% |
| Seattle area, WA SEATTLE TACOMA INTL AP | USW00024233 | 3.7% |
| Albuquerque, NM ALBUQUERQUE INTL AP GSN | USW00023050 | 3.6% |
| Atlanta, GA ATLANTA HARTSFIELD INTL AP | USW00013874 | 1.4% |
| Dallas–Fort Worth, TX DALLAS FT WORTH AP | USW00003927 | 0.5% |
| Miami, FL MIAMI INTL AP | USW00012839 | 0% |
| Lihue, Hawaii (not mapped) LIHUE WSO AP 1020.1 GSN | USW00022536 | 0% |
Location matters: Denver here means Denver-Stapleton, not Denver International Airport. Washington’s example is Reagan Airport in Virginia; Seattle’s is Seattle–Tacoma Airport; New York’s is Central Park. Lihue is a low-elevation Hawaii station and does not represent the state’s high summits.
For a mountain-versus-city comparison, Crested Butte’s published value is 98.3%, compared with 34% at Denver-Stapleton. In New York, Buffalo’s station is 52.7%, while Central Park is 13.2%. These are differences between the named stations, not probability boundaries around either city.
Weather-station statistics describe a measurement location, not every neighborhood in a city. Before comparing two places, check the station name, elevation and setting. A mountain station should not silently stand in for a nearby valley, and an airport observation should not be presented as a citywide measurement.
Keep the reference period and variable consistent. A percentage based on 1981–2010, a count from an entire century of Christmas observations and a 1991–2020 climate normal are not interchangeable. Nor is the probability of new snow the same as the probability of snow already on the ground.
NOAA calculates these daily probabilities using observations within a 29-day window centered on the calendar date, then smooths the results with a 29-day running mean. The December 25 normal therefore is not simply a count of snowy Christmas Days divided by 30. The source workbook does not supply each station’s sample size, so these figures should not be translated into a number of snowy Christmases. Missing values are omitted, never converted to zero.
4. Use a Forecast for This Christmas
The historical map helps compare typical conditions. For an approaching holiday, NCEI recommends checking your National Weather Service local forecast within seven days of Christmas. Actual storms, temperatures and existing snow cover determine what happens that year.
This is the practical difference between weather and climate: a long-term pattern provides context, while a forecast addresses a particular period. Neither a high historical probability nor a snowy-looking national map replaces current local travel forecasts and warnings.
Frequently Asked Questions
Does a historical probability of zero mean snow is impossible?
No. A value based on a particular historical period is not a physical limit on future weather. Equally, a very high historical value is not a guarantee for the next Christmas.
Does the map show how long snow stays on Christmas Day?
No. The threshold concerns observed snow depth, not continuous snow cover throughout every hour of December 25.
What Did We Learn Today?
Reading Christmas snow odds starts with the measurement: snow on the ground, not necessarily snow falling. Geography helps explain the regional pattern, but station location and the historical baseline determine whether a comparison is meaningful. Use that background to understand a place, then turn to a local forecast for the approaching holiday.
Sources & Data Notes
The baseline is NOAA’s 1991–2020 U.S. Climate Normals and the threshold is at least 1 inch (2.54 centimeters) of snow depth on December 25. Historical probabilities are not a forecast. The original GeographyPin maps plot published station values without spatial interpolation. The overview contains 4,393 valid station points in the contiguous-U.S. map extent; close-ups show selected stations only. Blank map areas are not zero values. The 24 table entries are illustrative, not ranked. Values retain the source’s precision, up to one decimal place; color categories use the published values without additional rounding. Missing source values are excluded. NOAA’s daily calculation uses a centered 29-day observation window and a 29-day running mean, rather than a simple count of December 25 observations. The workbook does not provide station-specific sample sizes. Basemap geometry comes from Natural Earth; map design and station selection are GeographyPin’s, without implying NOAA endorsement.
- NOAA/NCEI: Christmas Day Snow Statistics, 1991–2020 (source workbook).
- NCEI: daily normals variable documentation.
- NOAA: What are your chances for a white Christmas?
- NCEI: Are You Dreaming of a White Christmas?
- NCEI: U.S. Climate Normals
- NCEI: 1991–2020 Normals calculation methodology
- Natural Earth: public-domain basemap terms.
- NCEI Open Data Policy.