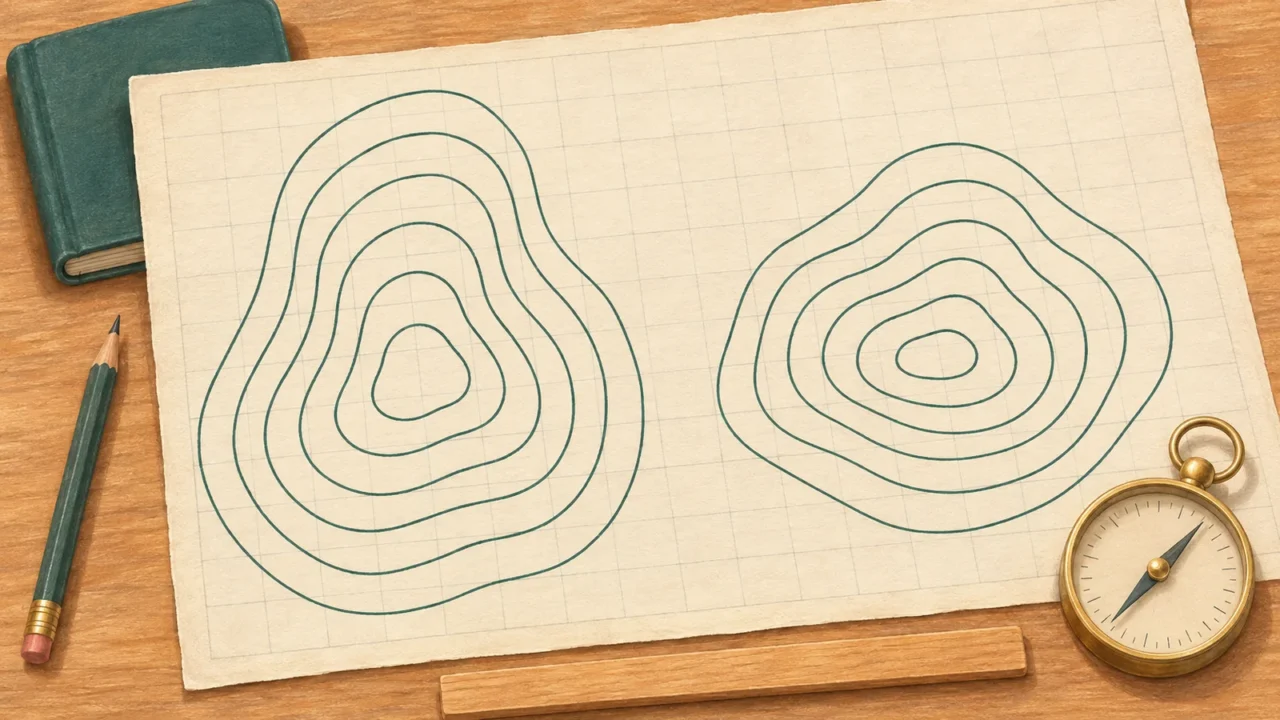
Test your map-reading judgment with this cartography quiz: 24 questions on coordinates, scale, contours, projections and mapped data. This fixed practice set combines familiar ideas with worked calculations and explanations, so you can check how you reached each answer.
Cartography and map reading support both physical and human geography. The questions use self-contained descriptions and numerical examples; no atlas or specialist software is needed.
Read maps. Check your reasoning.
24 questions · No timer · One point per correct answer
Easy, Medium and Hard are relative editorial difficulty levels for general geography learners, not standardized ratings. Every correct answer earns one point.
Choose an answer, then open “Show answer” to check it yourself. Interactive scoring appears when JavaScript is available.
Choose one answer, select Check answer, then continue to the next question.
Your Cartography and map skills quiz result
Easy
Show answer
Correct answer: The legend or key.
The legend explains the map’s symbols and line styles. A dashed line does not have one universal meaning across every map.
Easy
Show answer
Correct answer: Southern and Western.
S places it south of the equator; W places it west of the prime meridian. Read the latitude and longitude labels rather than treating the numbers as interchangeable.
Medium
Show answer
Correct answer: Geographic coordinates use angular latitude and longitude; projected coordinates use linear units on a plane.
Latitude and longitude describe angular position. A projected system uses a flat coordinate grid, commonly measured in meters or feet. Precision depends on the data and reference system, not simply the coordinate type.
Medium
Show answer
Correct answer: 12.5° N.
There are 60 arcminutes in one degree. So 30′ is 30 ÷ 60 = 0.5°, and 12°30′ N equals 12.5° N.
Medium
Show answer
Correct answer: No, it spans a shorter distance at 60° N.
Meridians converge toward the poles. Their separation along a parallel is therefore smaller at 60° N than at the equator; an angular difference is not a fixed distance in kilometers.
Easy
Show answer
Correct answer: Toward the right edge.
Use the marked orientation, not the page edges. Maps do not have to place north at the top.
Medium
Show answer
Correct answer: Magnetic north.
A magnetic compass aligns with the local magnetic field. True north follows the geographic meridian, while grid north follows the map’s grid; the three need not coincide.
Medium
Show answer
Correct answer: 2 km.
At 1:50,000, 1 cm represents 50,000 cm, or 500 m. Multiplying by 4 gives 2,000 m, which is 2 km.
Easy
Show answer
Correct answer: 1:25,000.
The largest fraction is 1/25,000. At that scale, a given ground feature occupies more map space than at the other scales. Large scale does not mean a larger area of Earth.
Hard
Show answer
Correct answer: 1:25,000.
Doubling a map length halves the scale denominator: 50,000 ÷ 2 = 25,000. The original printed “1:50,000” label is no longer correct. This is a doubling of length, not area.
Medium
Show answer
Correct answer: The resized scale bar.
The scale bar shrinks in the same proportion as the map, so it remains usable for the distances it represented. Unchanged numerical or verbal scale text does not automatically adjust.
Medium
Show answer
Correct answer: Trace the path’s bends, then compare that length with the map scale.
Follow the route’s curves, for example with string on a paper map, before reading the scale. The straight endpoint-to-endpoint distance misses those bends. Neither measurement alone gives walking time or the extra distance caused by slopes.
Easy
Show answer
Correct answer: The same elevation relative to the map’s reference surface.
An elevation contour joins points of equal elevation. It describes height, not a particular land cover or a constant steepness along the line.
Easy
Show answer
Correct answer: A steeper slope.
The same vertical change occurs over a shorter horizontal distance, so the slope is steeper. Compare spacing using the same map scale and contour interval.
Hard
Show answer
Correct answer: 20 m.
Five successive lines have four intervals between them. The elevation difference is 180 − 100 = 80 m, so the interval is 80 ÷ 4 = 20 m.
Hard
Show answer
Correct answer: 20%.
Percent slope is vertical rise divided by horizontal run, multiplied by 100: 60 ÷ 300 × 100 = 20%. A slope percentage is not the same as an angle in degrees.
Medium
Show answer
Correct answer: Toward higher ground up the valley.
In a valley or re-entrant, the contour bends point uphill. A V-shaped bend around a projecting spur points downhill instead, so identify the landform before interpreting the pattern.
Easy
Show answer
Correct answer: To keep the map legible while retaining important coastal patterns.
Generalization selects and simplifies detail for the map’s purpose and scale. A national or world map cannot show every feature that fits on a detailed local map.
Medium
Show answer
Correct answer: Equal area.
An equal-area projection preserves area proportions. It can still distort shapes, angles and distances, so it is not distortion-free.
Medium
Show answer
Correct answer: Mercator’s area exaggeration grows toward high latitudes.
On the standard Mercator projection, areas at high latitudes are enlarged relative to areas nearer the equator. Use an equal-area map when comparing region sizes.
Hard
Show answer
Correct answer: Angles and the shapes of very small features.
Conformality preserves angles locally and the shapes of sufficiently small features. It does not mean that every distance, area or large region’s shape is preserved.
Easy
Show answer
Correct answer: A curved global surface cannot be flattened while preserving all its geometric properties.
A projection must make trade-offs among properties such as area, shape, distance and direction. The useful choice depends on what the map is meant to show.
Hard
Show answer
Correct answer: A: 30%; B: 10%.
Divide connected households by all households in each region: A is 900 ÷ 3,000 × 100 = 30%; B is 1,200 ÷ 12,000 × 100 = 10%. Raw totals would answer a different question.
Hard
Show answer
Correct answer: Both fall in that range, but their exact percentages may differ.
A color class represents a range of values. The two regions could have different percentages within that range, and the shading does not reveal their population totals.
Use the explanations to sharpen your map skills
Each correct answer earns one point, with no penalty for a wrong answer. At the end, select Review answers to see every question and explanation, or Try again to replay the same set. The quiz does not save your score between visits.
- Separate angles from distances. Check whether coordinates use degrees or a projected grid’s linear units. Keep north/south and east/west labels with their values.
- Check the scale before calculating. Use matching units, and remember that resizing a print changes its numerical scale. A scale bar must resize together with the map to remain usable.
- Count contour intervals, not just lines. Compare slopes using the same scale and interval, and distinguish vertical height change from horizontal distance.
- Ask what the map preserves or groups. Check the projection, the denominator behind a percentage and the ranges in the legend before comparing regions.
For a broader, configurable mix of places and geography topics, try the world geography quiz.
What Did We Learn Today?
Reading a map means checking its conventions as well as recognizing places. Coordinates, scale and contours require careful attention to units and reference directions. Projections preserve some properties at the expense of others, while generalization and color classes control how much detail a map can communicate. Good interpretation starts with the map’s purpose and legend.
Sources & Data Notes
The questions use standard map-reading concepts from mapping agencies, government technical guidance and university teaching material. All numerical examples are hypothetical exercises, with units and assumptions stated in the question. Scale calculations concern horizontal distance, and projection properties are distinguished from local accuracy. Difficulty labels are editorial, not a qualification or standardized assessment.
- Ordnance Survey: Map legends; North arrows; Scale; Measuring Distance; Generalisation; Projections.
- NOAA National Ocean Service: What are latitude and longitude?; What is latitude?.
- U.S. Army Corps of Engineers, Hydrologic Engineering Center: Coordinate System Types.
- University of Twente, Faculty ITC: Map scale.
- U.S. Geological Survey: 7.5-Minute OnDemand Topo Cartographic Specifications - Map Symbol Guide.
- USDA Natural Resources Conservation Service: Soil Survey Manual, Chapter 2: Landscapes, Geomorphology, and Site Description.
- Scottish Government: 8B4 The Understanding and Use of Topographical Maps.
- NOAA Climate Prediction Center: Points, Pixels, Grids, and Cells: A Mapping and Gridding Primer.
- Office for National Statistics: Other charts and maps: Choropleth maps.