Lake Powell’s branching blue water follows a canyon landscape across Utah and Arizona. Its changing shoreline is striking, but understanding the lake requires separating three things: the shape of the flooded valleys, the height of the water and the volume stored behind Glen Canyon Dam.
Lake Powell is a Colorado River reservoir in Utah and Arizona, impounded by Glen Canyon Dam. Its water level measures surface elevation, not depth or storage volume. The map shows its canyon setting; the dated official observations below explain how to read elevations and percentages without confusing them with live conditions.
How to use this article: Start with the branching canyon landscape, interpret water-level measurements, or find official access information.
1. Where Is Lake Powell?
Lake Powell occupies flooded Colorado River canyons in southern Utah and northern Arizona. Glen Canyon Dam, near Page, Arizona, holds back the reservoir at its southwestern end. Most of the long, branching waterbody extends northeast into Utah.
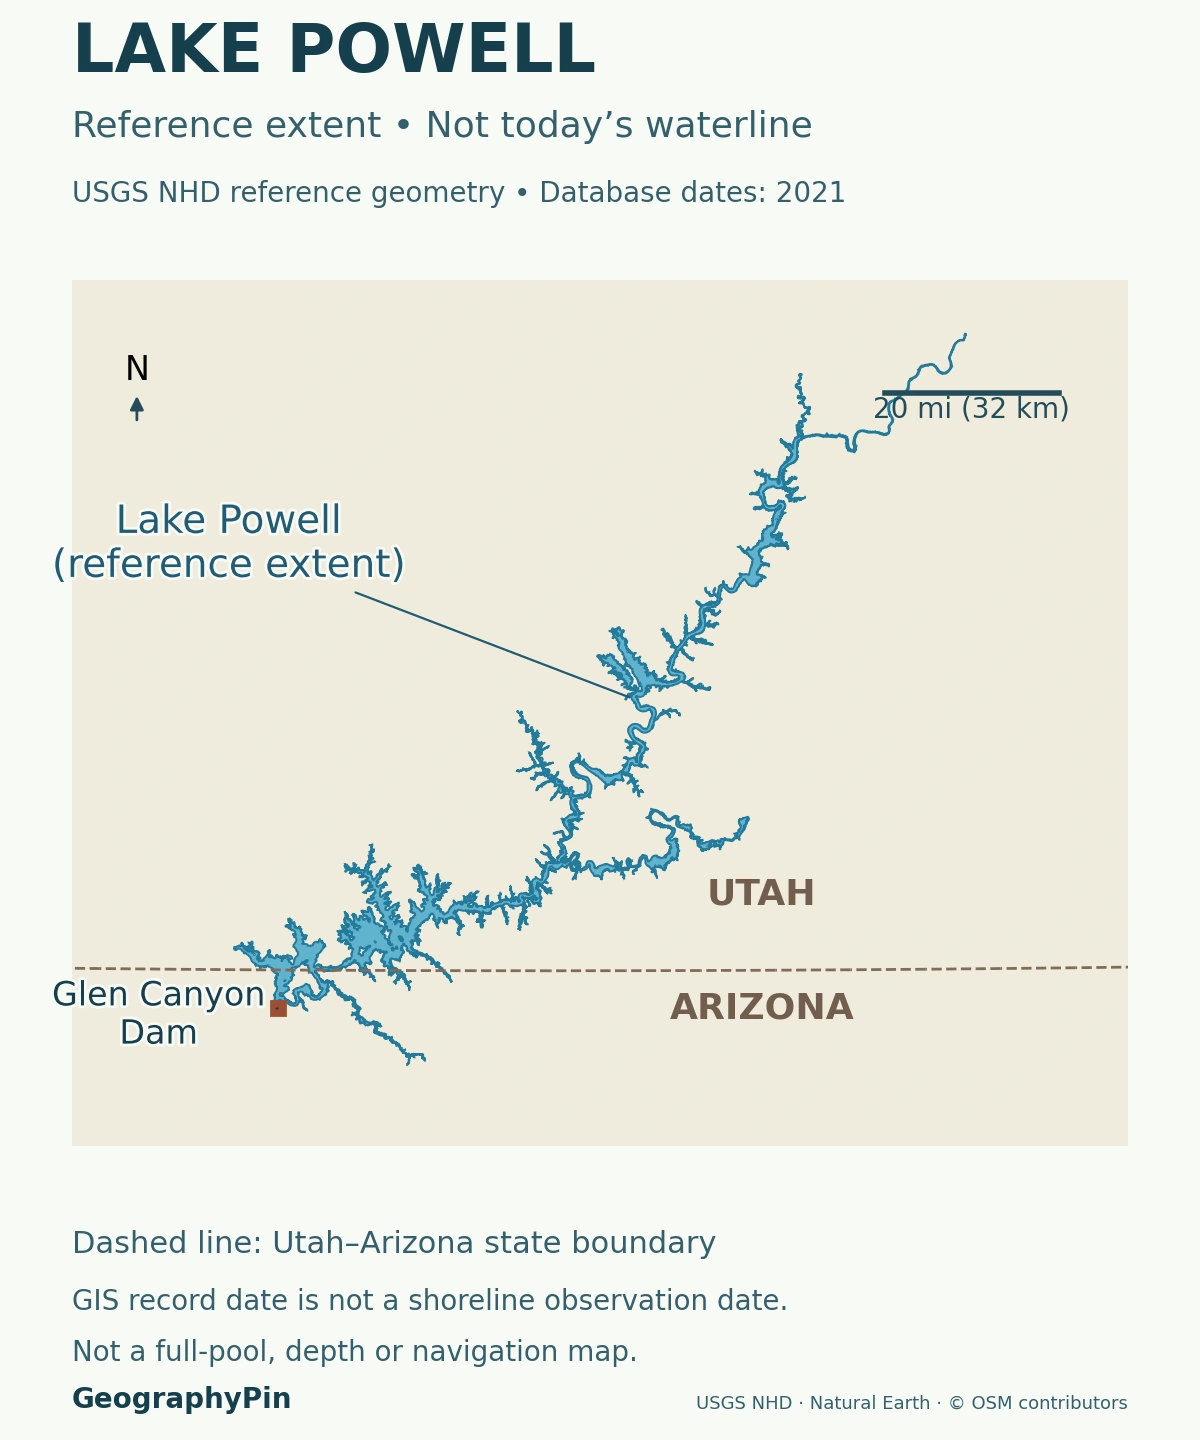
The reservoir follows a branching canyon system
Its shape makes more sense as a flooded river landscape than as an oval lake. Water extends along the main Colorado River corridor and into tributary valleys. Narrow passages, wider reaches and side arms reflect the terrain beneath and beside the water.
The shoreline shown on a general map is not a fixed outline that remains valid at every elevation. As water falls, shallow coves retreat and connections can narrow; rising water covers additional ground. The reference map here explains the reservoir’s position, state boundary and dam, not the navigable extent on a particular day.
Lake Powell and Lake Mead are separate reservoirs. Glen Canyon Dam impounds Powell upstream; Hoover Dam impounds Lake Mead farther downstream. Their elevations use different reporting conventions and should not be compared as though they were depths measured from identical lake bottoms.
2. How Glen Canyon Became a Reservoir
The Colorado Plateau’s layered rocks and deeply incised valleys existed long before the dam. The Colorado River and its tributaries cut through this landscape, exposing successive rock layers. Filling the reservoir submerged parts of that older canyon system rather than creating the canyons themselves.
Filling began in 1963, not at a single instant of completion
Reclamation dates the start of Lake Powell’s filling to March 13, 1963, when the dam’s diversion tunnels closed. The reservoir first reached full pool on June 22, 1980. That seventeen-year interval is a useful reminder that building a dam, beginning impoundment and filling a reservoir are different milestones.
The dam stores and regulates Colorado River water and generates hydroelectricity. Water released through it continues downstream; the reservoir is not a closed natural basin with no outlet.
Flooded side canyons help explain why a modest-looking change in surface height can alter access over a much larger area. Steep walls may shift the water’s edge only slightly in plan view, while shallow margins can expose broad stretches of ground. A single water-level number cannot describe all of those local changes.
3. What a Lake Powell Water-Level Reading Means
A reading such as 3,539.64 feet is the elevation of the water surface relative to a survey reference. It is not the distance from the surface to the canyon floor. Storage, by contrast, describes how much water the reservoir contains.
| Quantity | Meaning | Common mistake |
|---|---|---|
| Surface elevation | Water height above a defined vertical reference | Calling it the lake’s depth |
| Storage | Volume of water, often in acre-feet | Confusing it with the surface area |
| Capacity | Volume associated with a stated elevation and accounting definition | Treating every published maximum as interchangeable |
The vertical datum belongs with the measurement
Reclamation’s January 2022 area–capacity report states that its operational tables use NGVD 29. The underlying USGS elevation model used NAVD 88, so Reclamation applied a site-specific adjustment of 2.913 feet (about 0.888 meters). That is a change of reference, not a change in the amount of water.
The observations below retain the agency’s reported feet. Their metric equivalents are arithmetic unit conversions only, not conversions to a different datum. A generic website label or an unrelated survey’s elevation should not silently replace the reference used by the reservoir’s operational tables.
Likewise, converting height into storage requires an elevation–capacity relationship that accounts for the basin’s shape. Storage is not proportional to the elevation number. One acre-foot is a volume covering one acre to a depth of one foot, approximately 1,233.5 cubic meters.
4. A Dated Lake Powell Snapshot and Short-Term Trend
Reclamation’s daily report gives the following figures for November 12, 2026. These are dated operational observations, not a live feed. The source warns that its automatic data have not been checked for errors.
| Measure | Value |
|---|---|
| Reported surface elevation | 3,539.64 feet (1,078.88 meters) |
| Reported storage | 6.426 million acre-feet (about 7.93 cubic kilometers) |
| Report’s comparison capacity | 23.314 million acre-feet at 3,700 feet (1,127.76 meters) |
| Calculated storage percentage | About 27.6%, using 6.426 ÷ 23.314 × 100 |
Twelve daily readings are not a seasonal forecast
The accompanying chart uses the same report’s daily elevations for November 1–12, 2026. The reported surface rose from 3,532.42 feet (1,076.68 meters) to 3,539.64 feet (1,078.88 meters) over that interval.
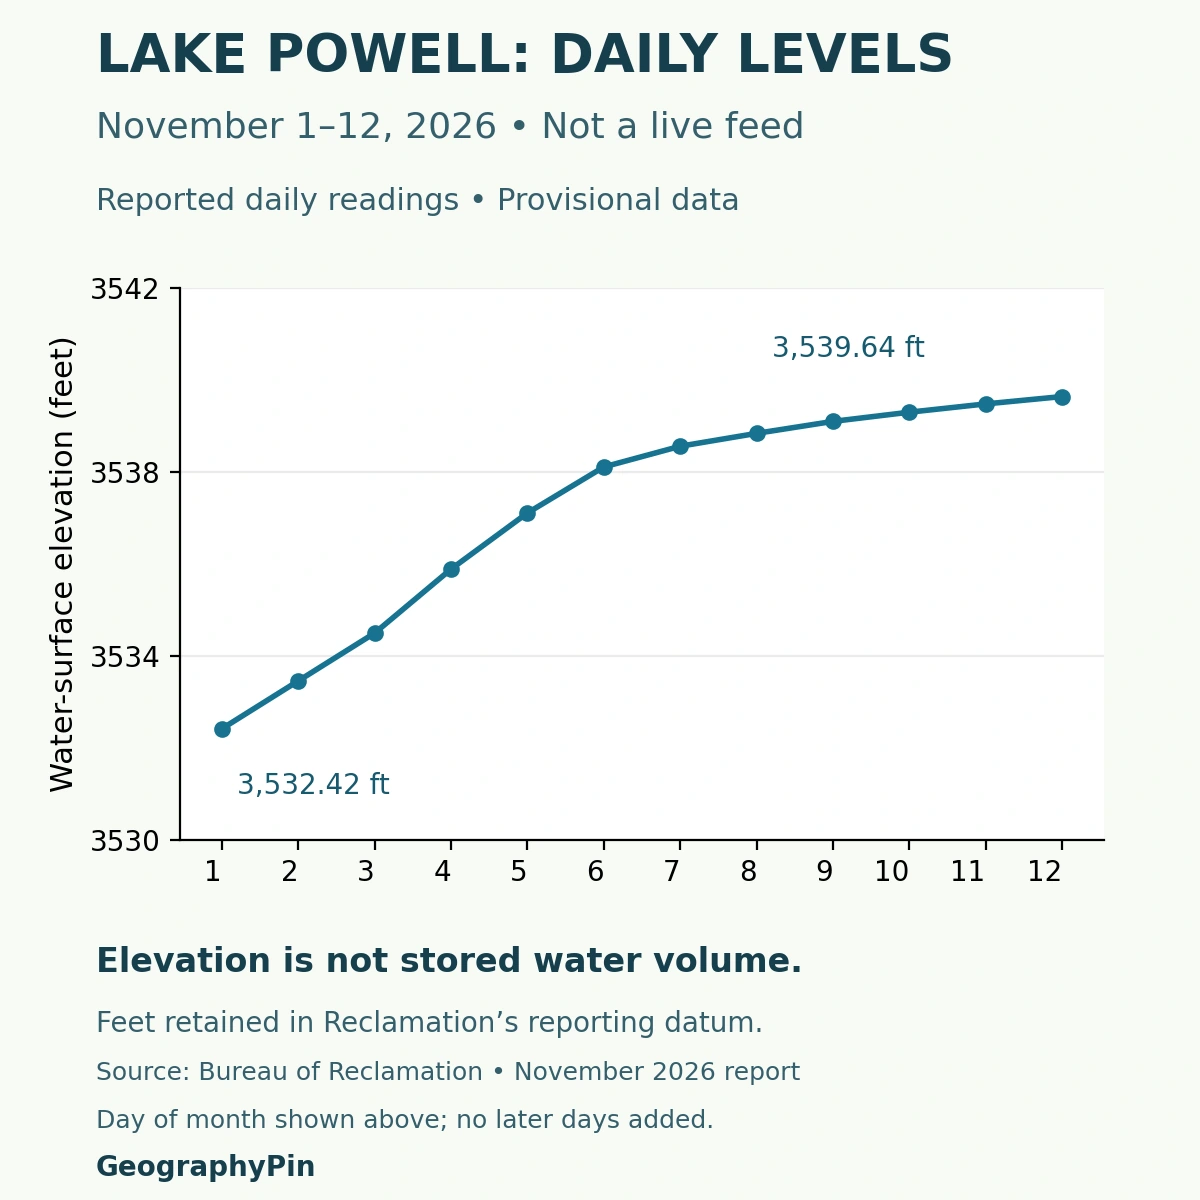
These are daily points, not monthly averages or month-end observations. No readings after November 12 have been supplied in this chart. The connecting line shows the sequence of observations, not a prediction of where the lake will go next.
A short rise does not establish that longer-term supply problems have ended. Understanding its causes requires inflow, release and other water-balance information, not just the shape of the line. Reclamation’s operating studies make projections under stated assumptions; those projections are not measured future levels.
5. Why Capacity Changes More Slowly Than Stored Water
Stored water changes as inflows, dam releases and other gains and losses change. Capacity describes the space available under a specified definition. Sediment deposited in the reservoir can reduce that space even when the water surface is temporarily rising.
A survey total is not automatically an operational denominator
A USGS study published in 2022 used 2017–2018 survey information and estimated that Lake Powell had lost 6.79% of its potential storage capacity between 1963 and 2018, largely through sediment accumulation. That is a long-term change in capacity, not a claim that 6.79% of its water evaporated during a particular year.
The study’s roughly 25.16-million-acre-foot total is not the denominator used in the daily-report calculation above. The USGS report expressly distinguishes its elevation-model results from Reclamation’s separately calculated operational relationships. Differences in methods, elevation reference and storage definitions matter; the figures should not be reconciled by simply subtracting one assumed dead-storage volume.
For a percentage, keep the reported water volume and the stated capacity on a compatible accounting basis. For a sedimentation comparison, use the study’s own dates and methods. Neither number alone supplies a current boating depth or a forecast of future water availability.
6. Where to Find Newer Levels and Access Information
Use Reclamation’s daily elevations and contents report for a newer observation. Check the reservoir name, month and day, and remember that a column labeled “1000 A.F.” reports thousands of acre-feet. The Lake Mead and Lake Powell blocks must not be interchanged.
A ramp notice answers a question that the chart cannot
The National Park Service’s changing lake levels page links water conditions to launch ramps and on-lake facilities. Changing levels can narrow channels and affect access to fuel, walkways and other services. Check the named facility rather than assuming that a general elevation guarantees access.
Also consult Glen Canyon’s alerts and conditions and current weather information before a visit. A reference shoreline is not a navigation chart, and the historical photograph on this page does not establish the present waterline.
For the broader waterbody distinction, see what is a lake? Lake Powell belongs to that wider landscape story, but its modern water surface is controlled by an engineered dam and a changing river system.
What Did We Learn Today?
Lake Powell flooded an older Colorado Plateau canyon system. Its shoreline changes with water elevation, while storage and capacity require their own units and definitions. A daily observation is not a forecast, a survey total is not automatically an operational capacity, and a general map cannot replace current access notices.
Sources & Data Notes
Operational observations are provisional and explicitly dated. The percentage is calculated using the capacity printed in the same daily report, not the USGS survey total. Metric values are rounded unit conversions, with no vertical-datum transformation. The chart and snapshot do not update automatically.
- Reclamation: Glen Canyon Unit, dam purpose and filling history
- National Park Service: Glen Canyon geology
- Reclamation: November 2026 daily elevations and contents
- Reclamation, January 2022: area–capacity report and NGVD 29 survey reference
- Reclamation glossary: acre-foot and storage terminology
- Reclamation: Glen Canyon Dam operations and dated projections
- USGS, March 2022: sedimentation and survey findings
- USGS Scientific Investigations Report 2022–5017: survey methods and capacity comparisons
- National Park Service: changing lake levels and facility access
- National Park Service: Glen Canyon alerts and conditions
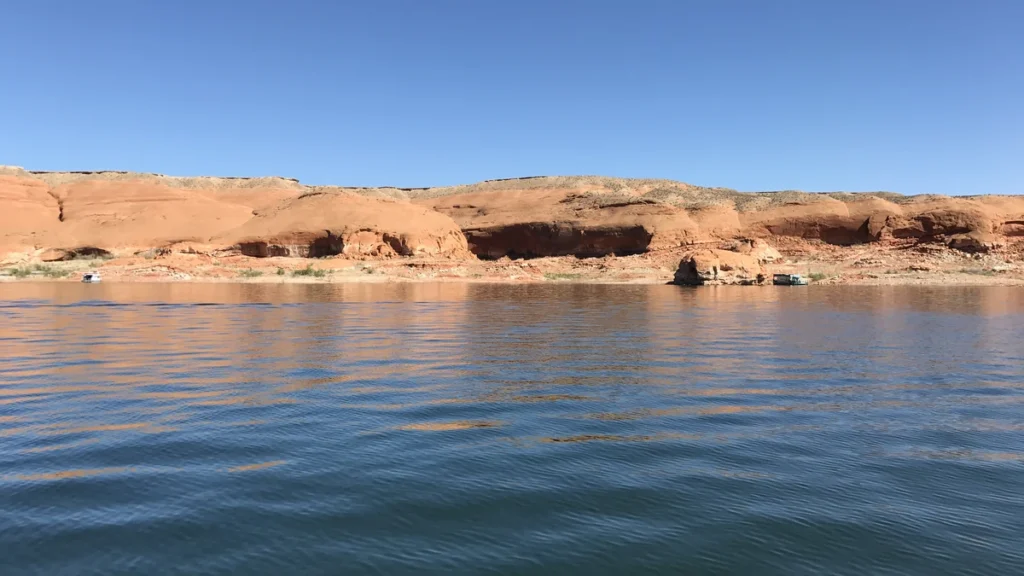
Featured photograph: Lake Powell, USGS, public domain. Cropped, resized and converted to WebP. The source does not establish an exact capture date; this archival photograph is not evidence of the November 2026 shoreline. No synthetic alterations or GeographyPin watermark were added.
Map methods: Five valid high-resolution USGS National Hydrography Dataset features with the Lake Powell geographic identifier were combined without inventing connecting water or redrawing the shoreline. Their January and June 2021 record dates describe database maintenance, not a dated survey of the water surface. The main map uses UTM zone 12N with equal axis scaling. The state boundary comes from Natural Earth public-domain data; the dam location comes from OpenStreetMap. No current depth, bathymetry, capacity boundary or boating route is implied.
Chart methods: Twelve daily values were extracted from the Powell block of the November 2026 report and checked against the source. The line connects those observations; later days are omitted, not predicted. Surface elevation is distinct from storage volume and percentage capacity.