Lake Elsinore does not have one shoreline that tells its whole story. Rainfall, runoff, evaporation and water-management works change the relationship between its open water, exposed margins and surrounding city. A useful map therefore needs both geography and a date: where the lake lies, what feeds it, and when the pictured water surface was observed.
Lake Elsinore is a natural lake in western Riverside County, Southern California, near the lower end of the San Jacinto River watershed. The city shares its name but is not the lake itself. Its water surface changes with inflows, evaporation and management, so shoreline images and lake-level figures need dates.
How to use this article: Start with following the watershed, compare the dated images using fixed landmarks, or distinguish elevation and depth.
1. Locate the lake, the city and the upstream watershed
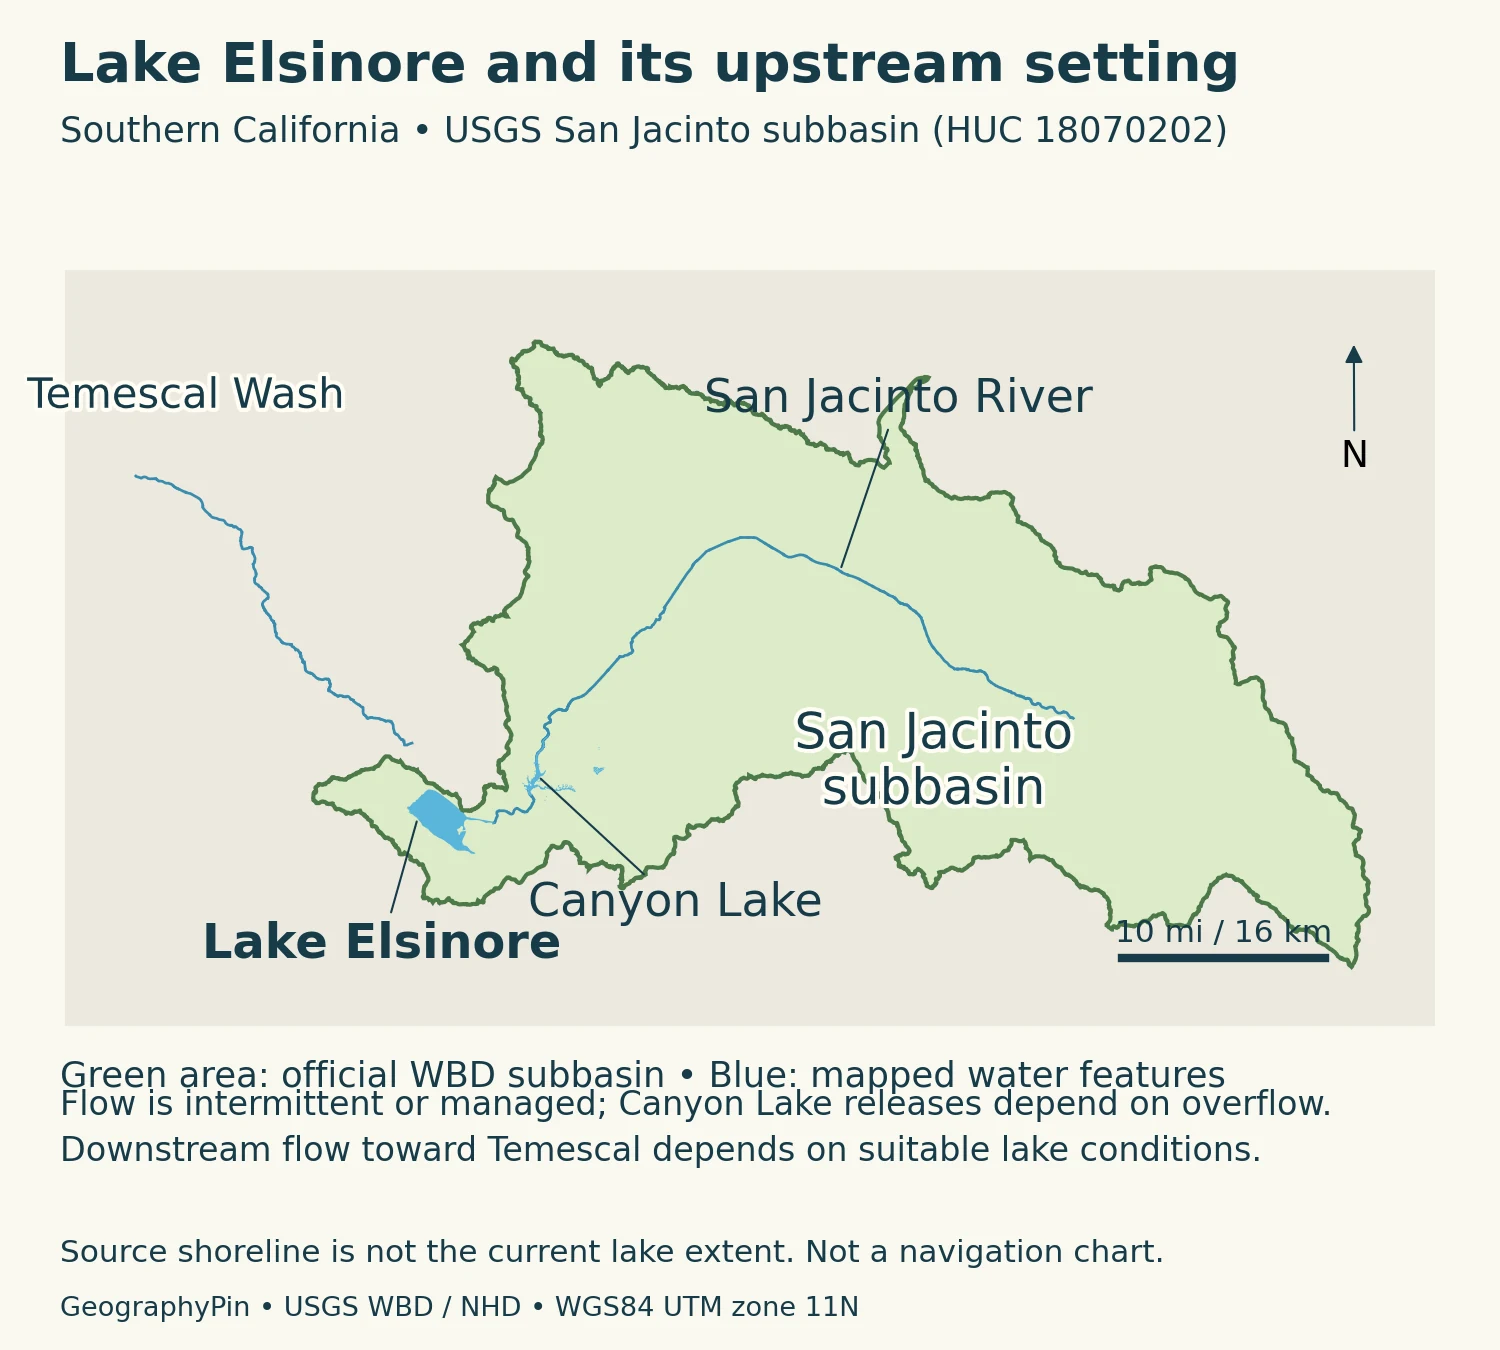
The lake occupies a low part of the landscape inland from the Pacific coast, beside the Santa Ana Mountains. The City of Lake Elsinore includes developed neighborhoods around the water, but a city boundary and a lake shoreline describe different things. Neither should be substituted for the watershed: the land from which surface water drains toward the lake.
Follow the water, not the city name
The San Jacinto River links a much wider inland drainage area to this setting. Upstream Canyon Lake is a separate, artificial reservoir. The Lake Elsinore and San Jacinto Watersheds Authority explains that heavy-rainfall inflows can spill from Canyon Lake and continue toward Lake Elsinore. Thus a storm beyond the immediate lakeshore can matter to the lake downstream.
The two similarly named places are also different kinds of destinations. A search for a city address may lead to a neighborhood well away from open water. A search for the lake may show a waterfront access point, while a watershed map includes distant tributaries and uplands. Start by deciding which of those geographic objects you need.
2. A natural basin with a managed modern footprint
The basin belongs to the landscape shaped by the Elsinore fault zone. USGS geological mapping describes a series of pull-apart basins associated with that fault system, including the depression partly occupied by Lake Elsinore. A pull-apart basin develops where fault movements create room for the ground between fault strands to subside. This geological explanation concerns the basin, not a claim that a recent earthquake produced the present shoreline.
Natural does not mean unchanged
Modern engineering has altered how water occupies that depression. The Santa Ana Water Board’s January 2025 technical report describes the Lake Elsinore Management Project, implemented between 1989 and 1995. A levee separated the main lake from the back basin, and inlet and outlet works changed the movement of water. Consequently, older lake outlines cannot automatically be treated as interchangeable with the present managed footprint.
This distinction is visible in satellite images: a straight embankment or managed channel is a different kind of feature from an irregular water margin. It is possible for the basin to be natural while parts of its present water-control system are engineered. Calling the entire feature simply “a reservoir” would miss that history; calling every shoreline feature untouched nature would miss it too.
3. Why the water surface grows and shrinks
The watershed authority identifies rainfall and runoff as important sources of lake water and describes supplemental recycled-water delivery intended to offset evaporation. These inputs do not guarantee a fixed level. Water reaching the lake varies, while evaporation removes water from the exposed surface, especially during warm conditions.
The Water Board’s historical account records episodes when the lakebed dried out. It also describes a downstream outlet toward Temescal Creek that operates when the lake reaches a sufficiently high level. Lake Elsinore therefore should not be described as either a continuously flowing river lake or an absolutely sealed basin with no possible outlet. Its behavior depends on the level and the managed drainage system.
Separate a process from a single photograph
A low-water picture documents the visible surface on its acquisition date. It does not, by itself, establish the cause of the change. Explaining a particular rise or fall requires the accompanying history of rainfall, river inflow, evaporation and management. The same caution applies to a large water surface: it is not proof that all water-quality problems have disappeared.
The nearby reservoirs, channels and developed land also make this more than a simple comparison between rain falling directly on the lake and water evaporating from it. The watershed collects and routes water across a larger area. A shoreline map is one part of that system, not a complete water budget.
4. Compare two August views on the same geographic grid
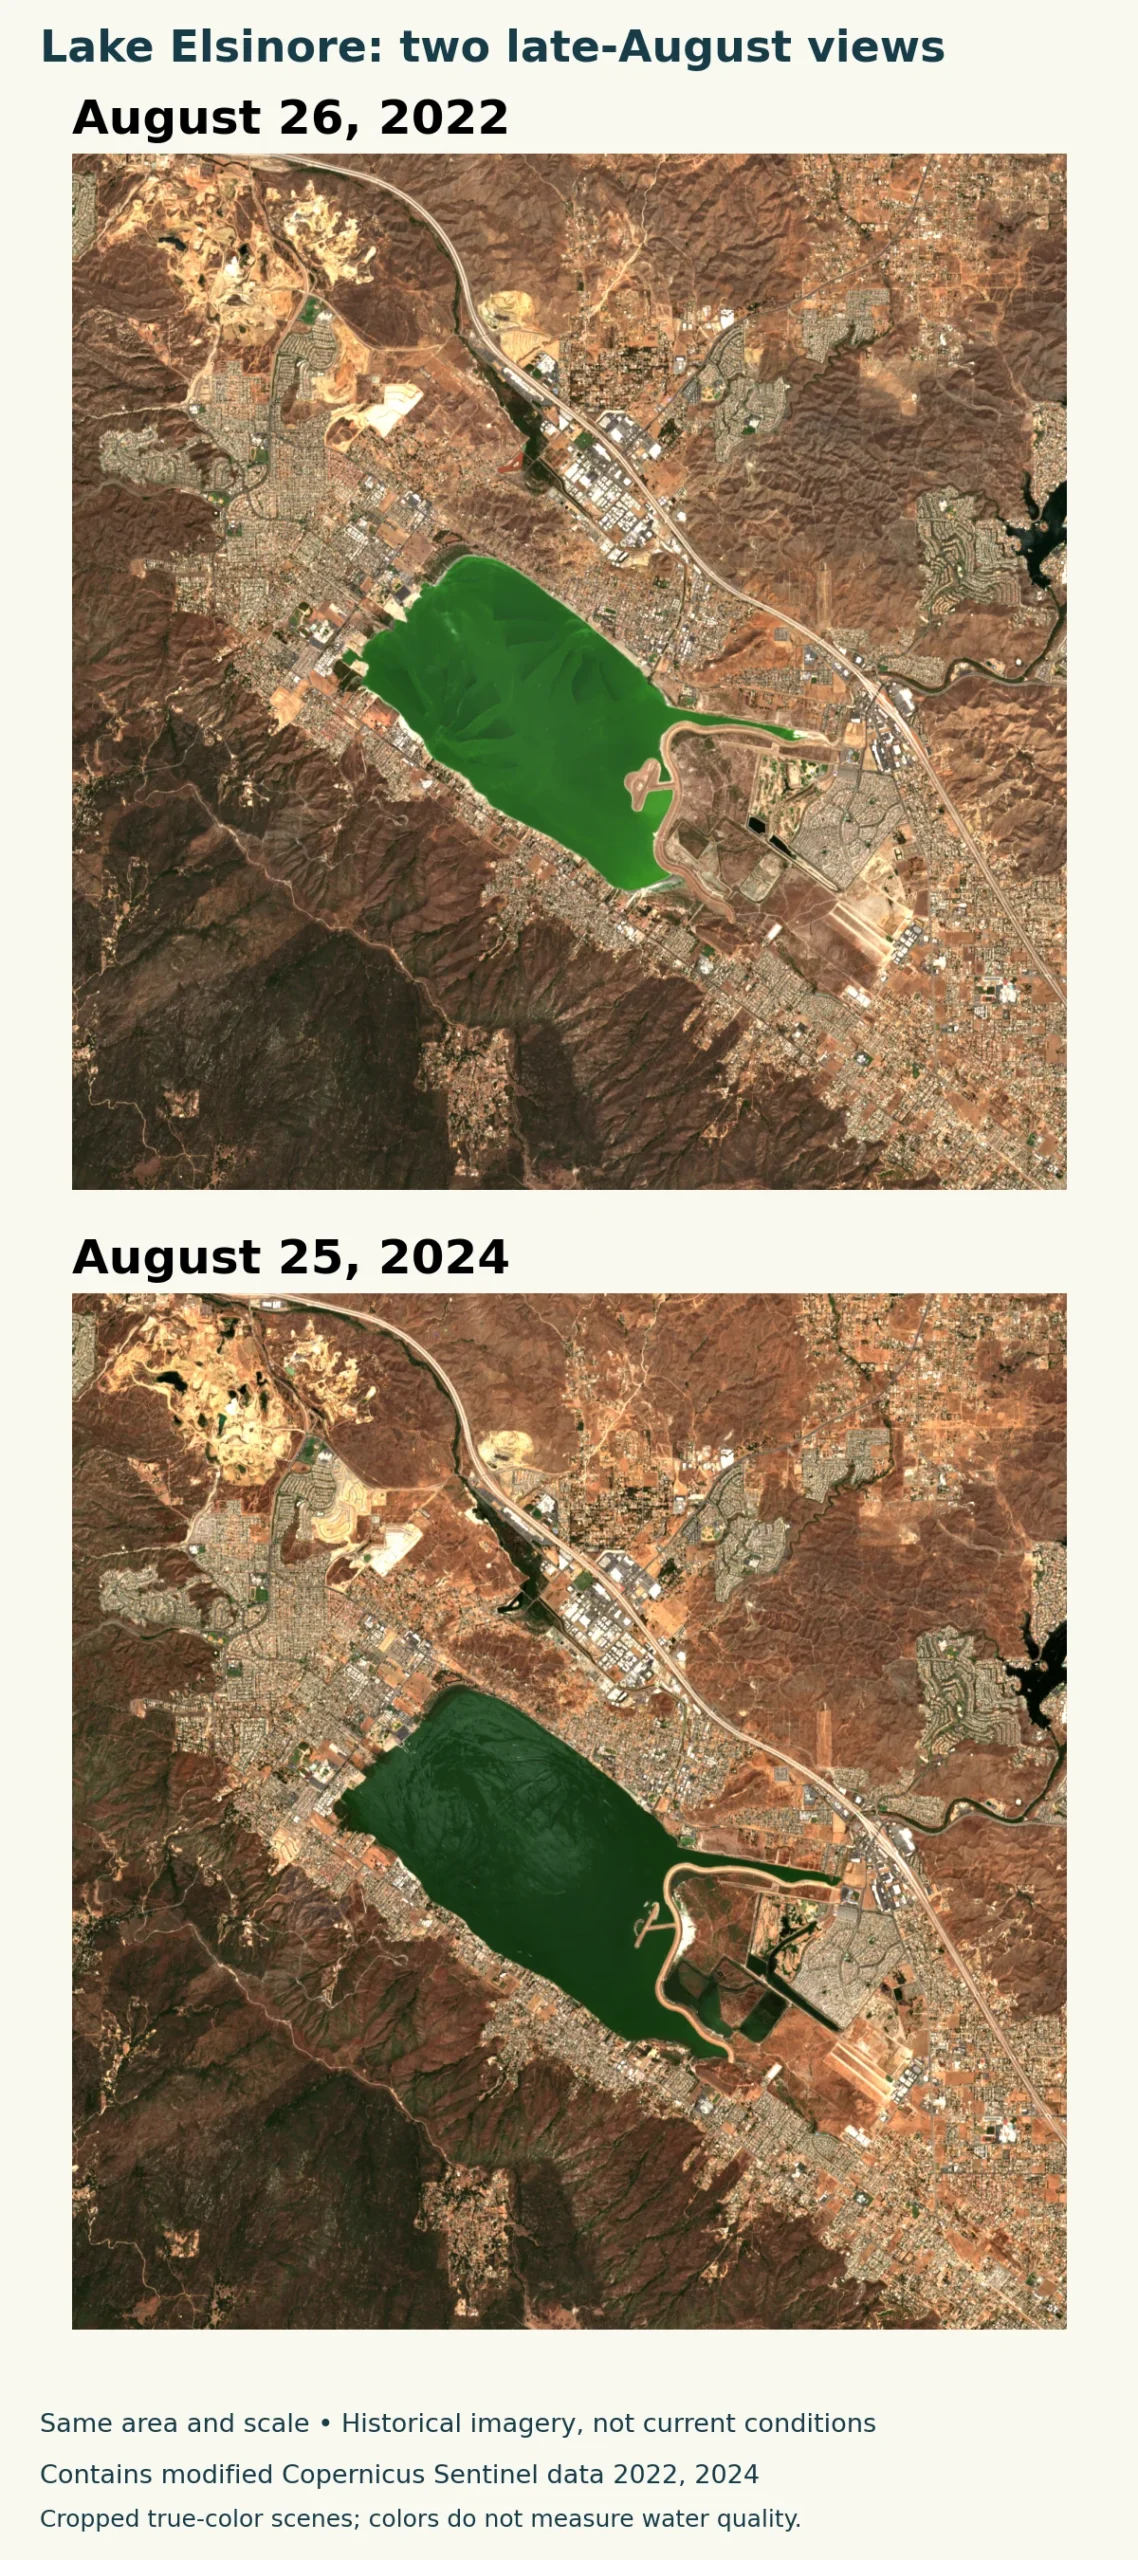
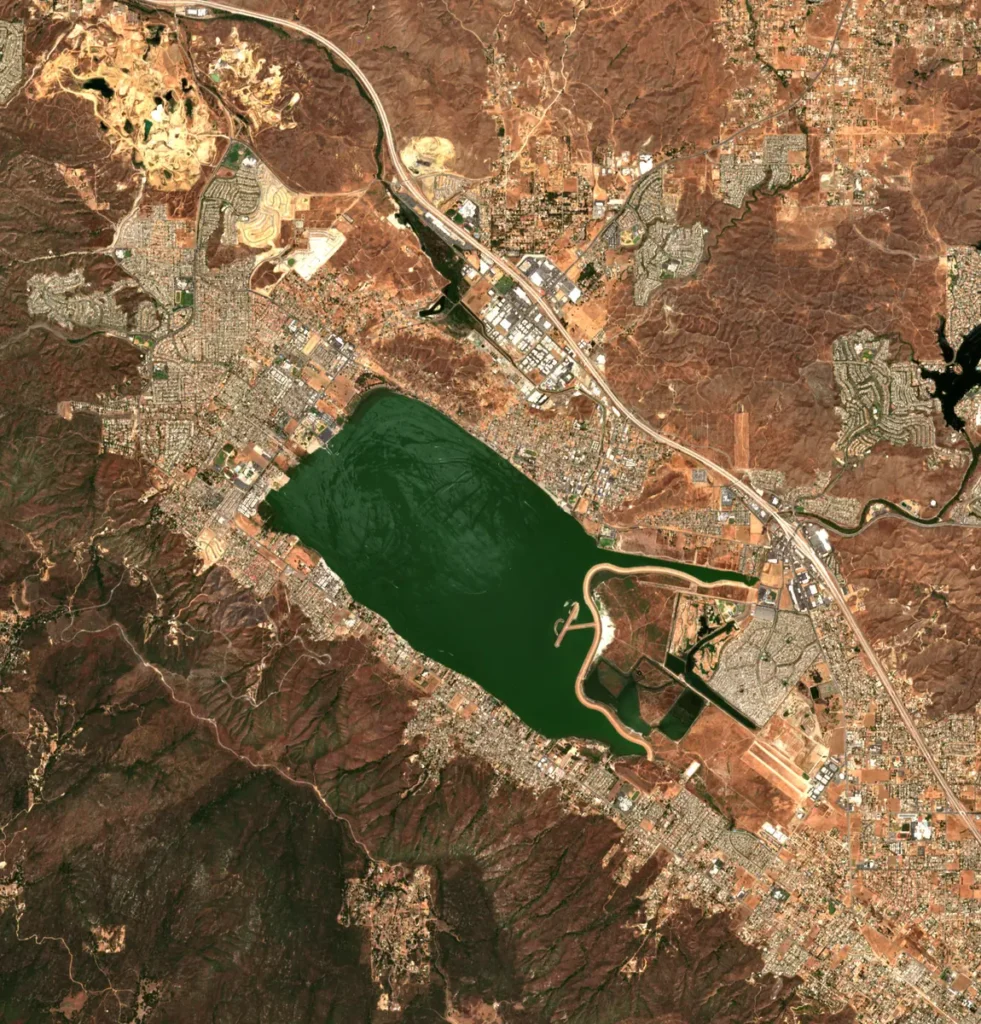
These are actual Sentinel-2A observations from August 26, 2022 and August 25, 2024, not reconstructed lake shapes. Both show the same area at the same scale. Comparing nearly the same point in the calendar reduces one obvious seasonal mismatch, although the years still had different preceding weather and management conditions.
Use fixed landmarks
Look at the roads, embankments and developed blocks around the southern and southeastern margins. They provide reference points against which the visible water edge can be compared. In the 2024 view, water occupies more of some marginal areas that appear exposed in the 2022 view. The pair illustrates a change in visible extent; it is not a calculated acreage estimate or a surveyed legal shoreline.
Water color also differs between the scenes. True-color imagery records an optical appearance affected by conditions in the water, illumination and image processing. The two selected products also have different processing baselines. Neither image measures cyanotoxins or establishes whether contact with the water is safe. Those questions require the relevant sampling results and official advisories, not a judgment that one photograph looks greener or clearer.
Cloud cover over the lake was visually checked in both selected scenes. The images retain the same mapped pixel grid and were cropped rather than redrawn. They are historical examples, not a live satellite view of today’s lake.
5. Read lake measurements with their dates and definitions
| Measurement | Reported value | What to notice |
|---|---|---|
| Reported lake elevation | 1,243.4 feet (379.0 meters) | City sheet updated September 17, 2026; not a current reading |
| Minimum preferred operating level | 1,240 feet (378.0 meters) | Management reference on that sheet, not depth or a health threshold |
| Outflow channel reference | 1,255 feet (382.5 meters) | Reported channel level; no continuous-outflow claim |
| Satellite comparison dates | August 26, 2022 and August 25, 2024 | Historical same-season observations, not a present shoreline survey |
The City’s Lake Watch sheet updated September 17, 2026 lists a lake elevation alongside several reference levels. That dated snapshot is useful for showing how a measurement is reported, but it is not a current reading for every visitor who later opens this article. For a new observation, follow the Elsinore Valley Municipal Water District’s lake-level service and check the observation date.
Elevation is not depth
Lake elevation describes the position of the water surface relative to a vertical reference. Depth measures downward from that surface to the lakebed at a location. Surface area describes how much ground the water covers. As a shallow lake rises or falls, its waterline and area change; none of these quantities is a substitute for the others.
Do not compare a bare elevation number with another source without checking the stated reference system. The City’s public sheet labels its values as elevation in feet but does not identify a geodetic datum on that sheet. The table preserves that limitation instead of silently labeling the figures NAVD 88 or another datum. Its preferred operating level is a management reference, not a promise of safe recreation or a fixed natural shoreline.
6. Read water-quality notices separately from lake levels
The City maintains Lake Watch information and testing results, while California’s Freshwater Harmful Algal Bloom program provides statewide reporting and advisory resources. Check the latest dated notice and any signs at the place you intend to visit. A historical “no advisory” result must not be carried forward indefinitely as a blanket assurance about the lake.
The City explains that harmful blooms may move within a waterbody and may not be visible. Official guidance therefore matters even when water appears clear. Conversely, a green patch in an old satellite image cannot establish the present advisory category. The geographic question “where is the water?” and the public-health question “what does current testing show?” require different evidence.
For access, identify the specific beach, launch or managed facility rather than assuming every shoreline segment is public or open. Follow the current instructions of the responsible operator and the official water-quality guidance. This article explains the setting and how to read the evidence; it does not replace a current access or health notice.
What Did We Learn Today?
Lake Elsinore is a natural basin within the San Jacinto drainage system whose modern water footprint has also been shaped by management. The lake, the surrounding city and the watershed are distinct geographic objects. Dated satellite scenes show changing margins, while lake levels, water depth and official health advisories answer different questions. Keeping those sources and dates separate produces a more useful picture than treating one blue shape or one number as permanent.
Sources & Data Notes
The numerical table preserves the date and labels of the City’s September 17, 2026 sheet. That sheet does not specify a geodetic datum; no NAVD 88 conversion is implied. Historical observations are not current health or access advice.
- Santa Ana Water Board, Revised TMDL Technical Report, January 17, 2025
- City Lake Watch and dated monitoring update
- City Lake Watch monitoring sheet updated September 17, 2026
- EVMWD lake level dashboard entry point
- USGS Elsinore quadrangle geology metadata
- Copernicus Sentinel data legal notice
- LESJWA: Lake Elsinore and its water inputs
- LESJWA: Canyon Lake and downstream spill
- California Freshwater Harmful Algal Bloom program
Satellite imagery: Contains modified Copernicus Sentinel data 2022, 2024, accessed through EarthSearch’s public Sentinel-2 Level-2A cloud-optimized files. Exact acquisition dates are August 26, 2022 and August 25, 2024. Crops share a 10-meter UTM zone 11N grid. Processing baselines differ, so color is not a quantitative comparison. No water-area classification or toxin measurement was inferred.
Watershed map: the USGS Watershed Boundary Dataset supplies the San Jacinto subbasin (HUC 18070202); selected river and lake geometry comes from the National Hydrography Dataset. This source-specific watershed boundary is not a municipal boundary or the exact delineation used for every published catchment-area estimate. The map uses WGS 84 / UTM zone 11N. Source shorelines are not present water levels. Gaps in selected hydrography are retained rather than joined with invented channels; mapped channels do not imply continuous flow. Map layout by GeographyPin using public U.S. federal geographic data.