Lake Mead’s water level is often reported as a single number, but that number cannot tell the whole story. A surface elevation, a stored volume and a percentage describe different aspects of the reservoir behind Hoover Dam.
Lake Mead is the Colorado River reservoir behind Hoover Dam on the Nevada–Arizona boundary. Its water level is the surface elevation relative to a defined datum; storage measures volume, and percent full compares that volume with a stated capacity. The dated observations below are examples, not a live water-level feed.
How to use this article: Distinguish height from volume, understand the percentage’s capacity basis, or find official measurements and access notices.
1. Where Is Lake Mead?
Lake Mead is a reservoir on the Colorado River along the Nevada–Arizona boundary in the southwestern United States. Hoover Dam holds back its water in Black Canyon, southeast of Las Vegas and near Boulder City. Downstream of the dam, the river continues toward Lake Mohave.
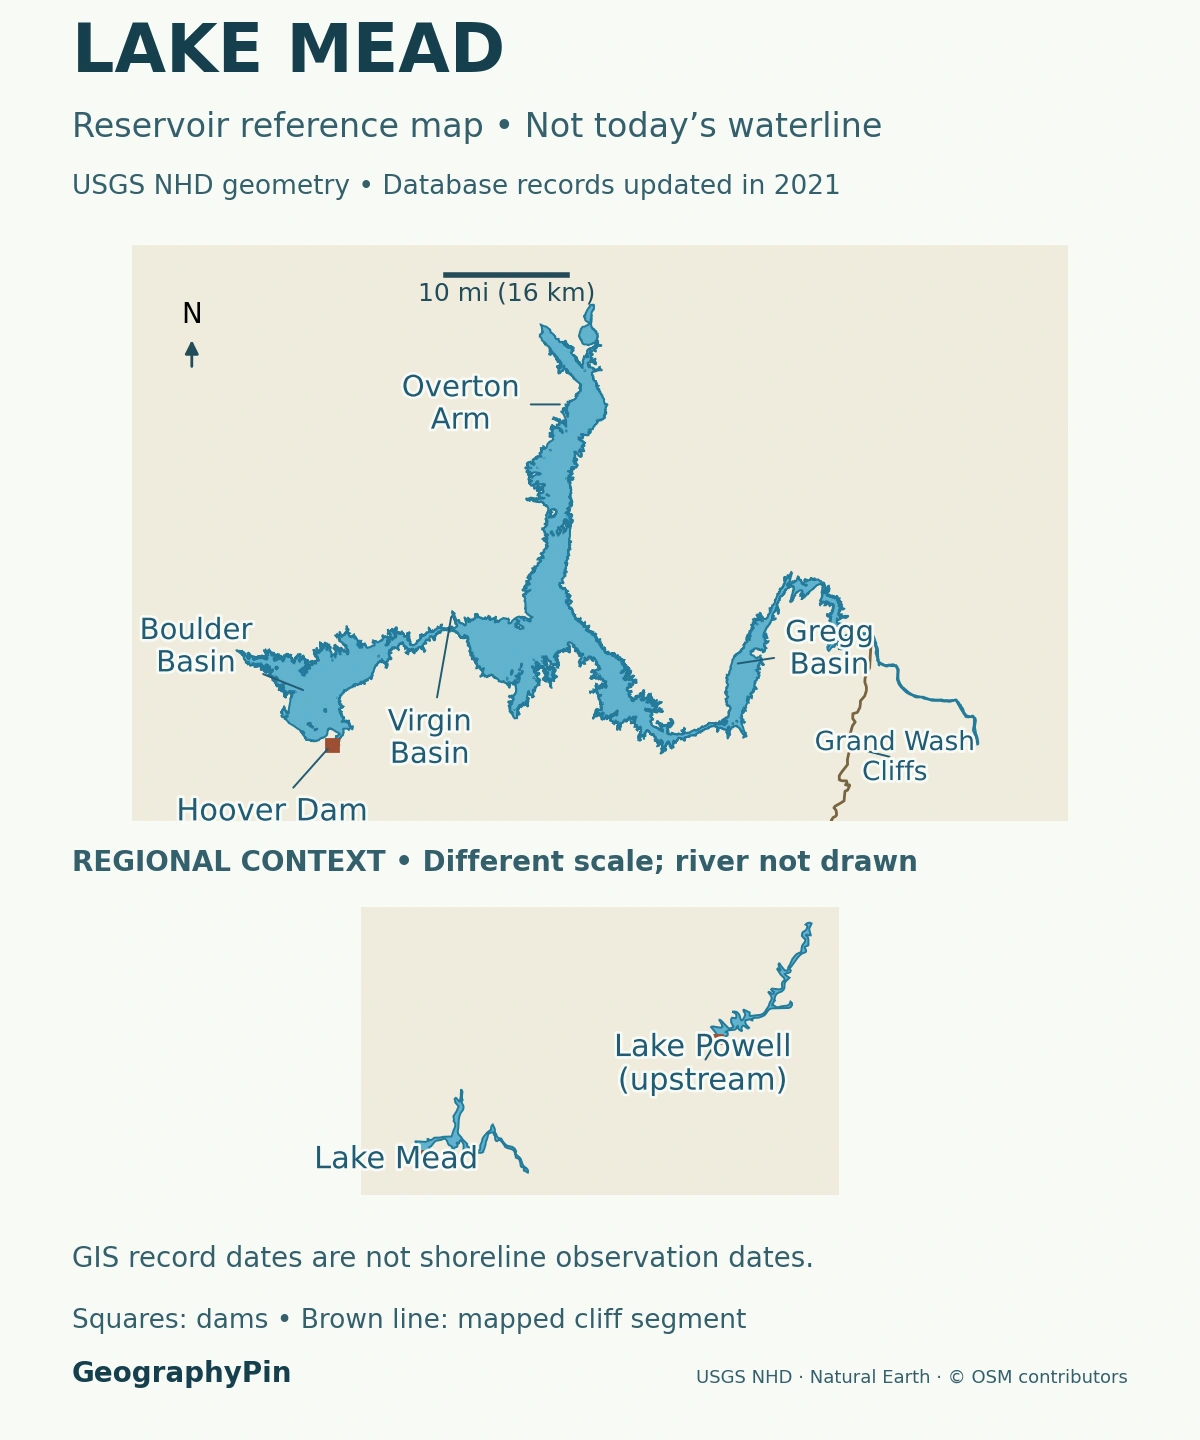
Lake Mead is not the whole recreation area
Lake Mead National Recreation Area includes both Lake Mead and Lake Mohave, as well as extensive surrounding desert, mountains and canyons. Its total area must not be quoted as the water surface of Lake Mead. Davis Dam impounds Lake Mohave; Hoover Dam impounds Lake Mead.
The locator shows the reservoir’s branching geographical setting and Hoover Dam. Its mapped outline is a reference outline, not a survey of the waterline on the date of the measurements below. Falling or rising water can substantially change the appearance of shallow arms and bays.
2. A Reservoir Flooded an Older Canyon Landscape
The lake is artificial, but the terrain it occupies is much older. The National Park Service places this landscape near the transition between the Basin and Range province and the Colorado Plateau. Ancient sedimentary rocks, volcanic rocks, mountains and eroded valleys form the setting into which the reservoir expanded.
Water began backing up behind Hoover Dam in 1935
Reclamation’s construction history identifies February 1, 1935, as the day a gate closed the last diversion tunnel and the Colorado River began accumulating behind the dam. Water was still released to meet downstream needs. Impoundment was a process, not the instantaneous creation of a full reservoir.
Lake Mead therefore differs from a natural lake occupying a glacial hollow or volcanic crater. Its water is retained by a dam across an existing river valley. The reservoir follows the flooded relief, producing wide basins, narrow connections and side arms rather than a simple circular shoreline.
That shape also changes how measurements should be interpreted. A rise of one foot does not spread over a fixed rectangle: the water can cover additional ground as it climbs the surrounding slopes. A reference map alone cannot convert a change in height into an exact change in stored water.
3. Water Level, Storage and Percent Full Mean Different Things
“Lake Mead water level” usually means the elevation of the water surface. It does not mean the depth from the surface to the bottom, and it is not the same as the amount of water stored.
| Measure | What it describes | What it does not describe |
|---|---|---|
| Water-surface elevation | Height relative to a specified vertical reference | Depth at a swimming spot or boat ramp |
| Storage | Water volume, commonly reported in acre-feet | The area of exposed shoreline |
| Percent full | Storage divided by a stated capacity, multiplied by 100 | Elevation divided by the dam’s height |
A vertical reference is not the bottom of the lake
Reclamation’s Hoover Dam metadata identifies the vertical datum as USGS 1912, commonly called the local Power House datum. The figures here preserve the agency’s reporting convention. Converting feet to meters changes the unit, not the datum; it does not transform a reading into a different survey reference.
Storage uses a different kind of unit. One acre-foot is enough water to cover one acre to a depth of one foot, approximately 1,233.5 cubic meters. “Million acre-feet,” often shortened to MAF, is a volume rather than an elevation.
Reclamation develops elevation–capacity relationships from reservoir surveys. Those relationships account for basin geometry and sedimentation; they are not obtained by assuming storage is proportional to water-surface elevation.
4. A Dated Example of Lake Mead’s Water Level
The following snapshot is an example from the Bureau of Reclamation’s daily operational report for November 12, 2026. It is not a live reading. The report warns that its automatic data have not been checked for errors.
| Measure | Reported value or identified calculation |
|---|---|
| Water-surface elevation | 1,040.71 feet (317.21 meters), in Reclamation’s reporting datum |
| Storage | 7.027 million acre-feet (about 8.67 cubic kilometers) |
| Capacity used for comparison | 26.12 million acre-feet (about 32.22 cubic kilometers) |
| Derived percent full | About 26.9%, calculated as 7.027 ÷ 26.12 × 100 |
The capacity definition belongs beside the percentage
The report places that capacity at 1,219.6 feet (371.73 meters), the bottom of exclusive flood-control space. It is not an interchangeable denominator for every historical “maximum capacity” figure. A percentage is only interpretable when its storage date and capacity basis are known.
The chart gives separate end-of-month elevations for January through October 2026. The October value is 1,038.85 feet (316.64 meters). A monthly endpoint is neither the month’s average nor necessarily its lowest reading; it should not be confused with the later daily snapshot.
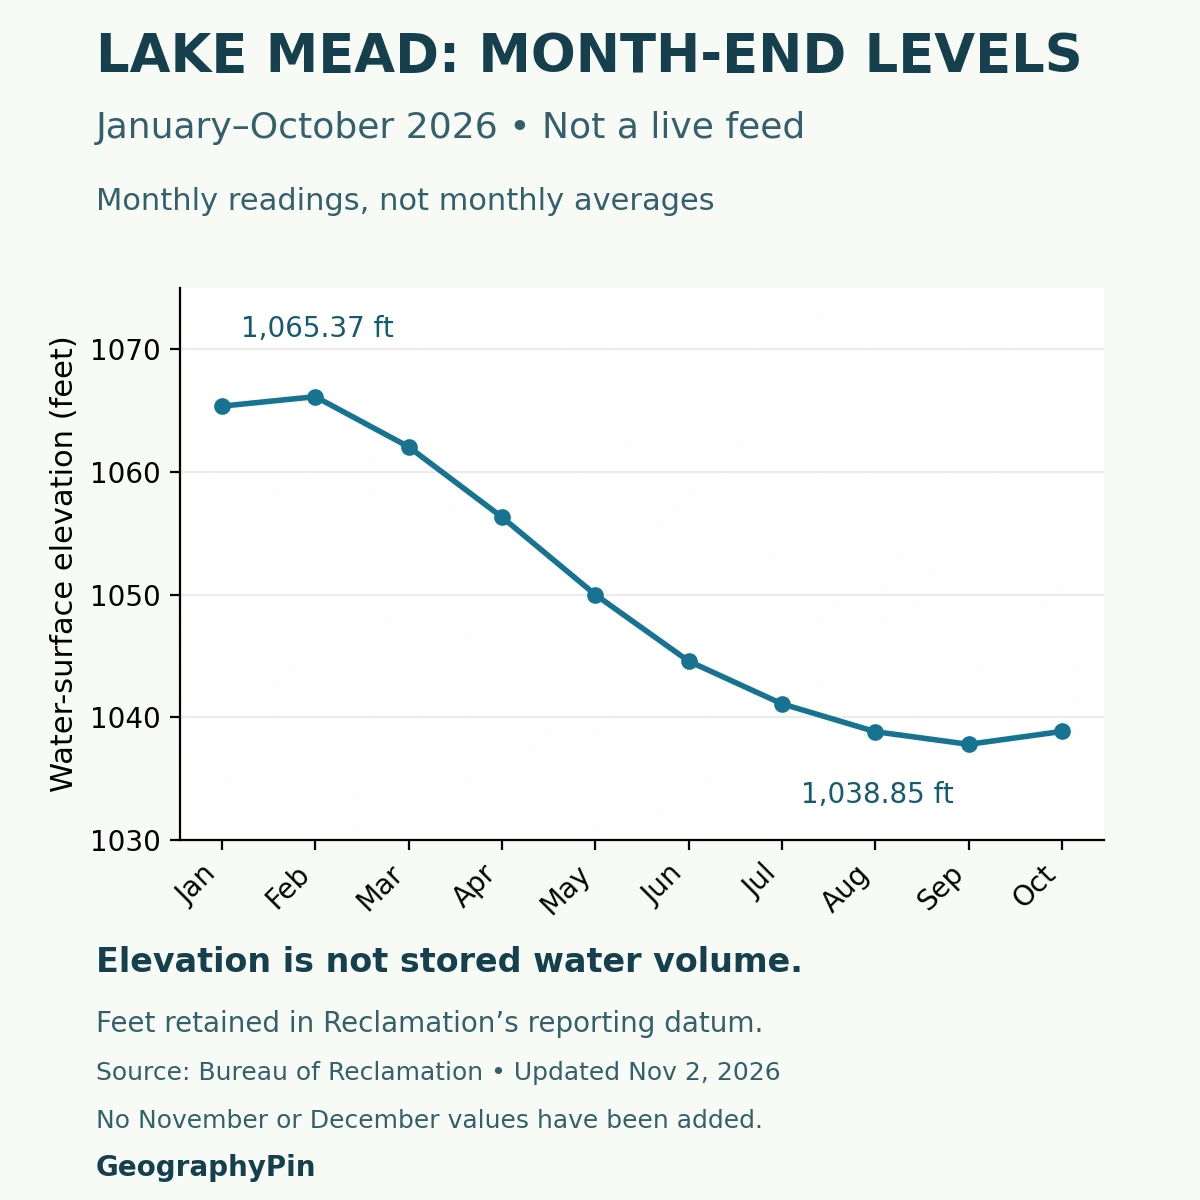
There are no November or December month-end points in this series. Connecting the recorded points helps show their sequence, but does not turn them into continuous daily observations or a forecast.
5. Why Lake Mead’s Level Changes
A reservoir rises or falls according to its water balance. Water arriving through the Colorado River and other inflows adds to storage; releases through Hoover Dam, withdrawals and evaporation remove water. Exchanges with the surrounding banks also enter operational accounting.
Reclamation explains that Mead’s inflow includes releases from Glen Canyon Dam upstream and additional water entering between Glen Canyon and Hoover Dams. Rain falling beside Lake Mead is therefore only one part of a much larger system. A local storm does not by itself reveal the reservoir’s longer-term balance.
Evaporation is a loss, not the whole explanation
USGS measurements show that evaporation depends partly on heat stored in the lake. Water warms during spring and summer, then releases stored energy later in the year. Evaporation can consequently remain substantial after peak summer sunlight has passed.
An evaporation depth is not the same as the net annual fall in lake level. Inflows may replace some of that water, while releases and withdrawals remove additional volumes. Nor should a study-period evaporation estimate be presented as a fixed loss repeated identically every year.
A rising line over a short interval means storage or elevation increased over that interval. It does not, by itself, demonstrate that a prolonged water-supply problem has ended. Conversely, a monthly chart cannot identify every individual storm, operating decision or withdrawal responsible for the change.
6. Reading Official Reports and Planning a Visit
For a newer observation, use Reclamation’s daily elevations and contents report. Check the month, day, units and column heading before copying a number. A storage column labeled “1000 A.F.” must be multiplied by one thousand to express acre-feet.
A measurement, a projection and a ramp notice answer different questions
Observed water levels describe a recorded condition. Reclamation’s operating studies project possible future conditions under assumptions about inflows and operations. They should not be labeled as measurements, and an older projection should not replace a newer observation.
For a visit, the National Park Service’s alerts and conditions answer a different question: what access is available? The park notes that changing levels and maintenance can affect launch ramps. A reservoir elevation alone does not guarantee that a named ramp is open or usable.
Check official weather and local notices as well. The map and dated chart explain geography and measurements; neither is a navigation chart, a boating clearance or a live safety report.
For the broader distinction between natural waterbodies and impoundments, see what is a lake?
What Did We Learn Today?
Lake Mead occupies an older canyon landscape flooded behind Hoover Dam. Its elevation, storage and percent full are related but not interchangeable. Dates, units, vertical datum and capacity definitions make the numbers meaningful. A mapped reservoir outline, a historical chart and a current access notice serve different purposes.
Sources & Data Notes
The daily snapshot and monthly series have different observation dates and are labeled separately. Operational values can be revised. Percent full is a calculation using the stated capacity, not a separately measured percentage. Metric values are rounded arithmetic conversions, with no conversion of vertical datum. Nothing on this page automatically updates when Reclamation publishes a new reading.
- Reclamation: Hoover Dam location and reservoir relationship
- Bureau of Reclamation: daily elevations and contents, November 12, 2026 snapshot
- Bureau of Reclamation: end-of-month Lake Mead elevations, updated November 2, 2026
- Reclamation RISE: Hoover Dam location and USGS 1912 datum
- Reclamation glossary: acre-foot and reservoir terminology
- Reclamation: Lake Mead sedimentation surveys and elevation–capacity relationships
- Reclamation: diversion tunnels and the start of impoundment
- National Park Service: geodiversity and the wider recreation area
- National Park Service: Hoover and Davis Dams
- Reclamation, 2022: evaporation and reservoir operations technical memorandum
- USGS: Lake Mead and Lake Mohave evaporation research
- National Park Service: current alerts and conditions
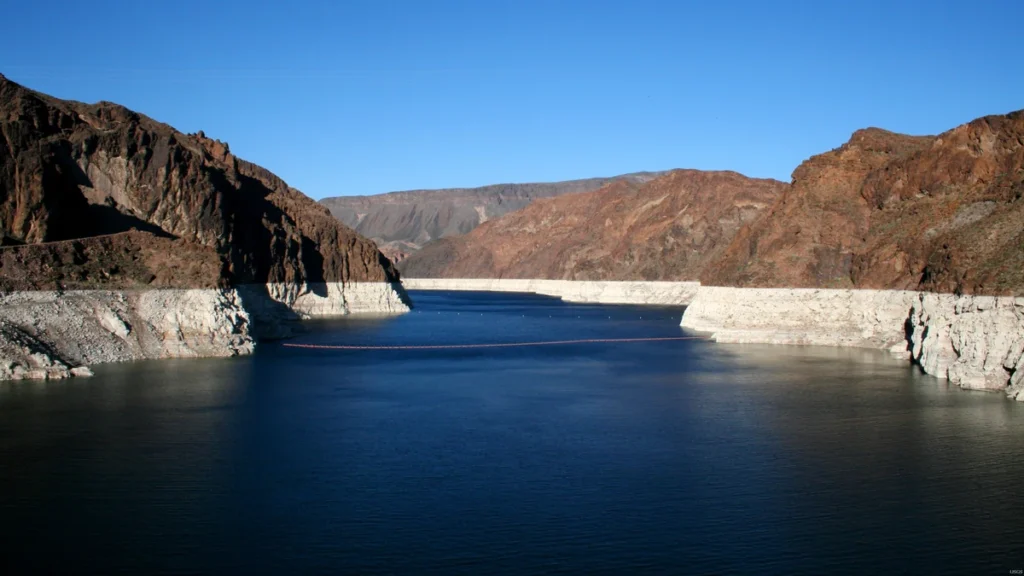
Featured photograph: Lake Mead by Alicia Burtner, USGS, public domain. Cropped, resized and converted to WebP. The source does not supply an exact capture date; this archival photograph is not evidence of the November 2026 waterline. No synthetic alterations or GeographyPin watermark were added.
Map methods: USGS National Hydrography Dataset waterbody polygons provide a reference extent. Their database maintenance dates do not establish when the shoreline was observed. UTM zone 11N and equal axis scaling preserve geographic relationships in the main panel. Broad basin labels were checked against the USGS Lake Mead reference map; no basin divisions are drawn. Actual mapped dams and a selected Grand Wash Cliffs segment come from OpenStreetMap. The separate-scale inset uses Natural Earth public-domain lake outlines. Neither panel supplies a current shoreline, depth chart or boating route.
Chart methods: Ten reported month-end values were transcribed and checked against the 2026 source row. November and December were left out because no month-end values were supplied. Lines connect the observations; no daily values, future levels or capacity curve were invented.