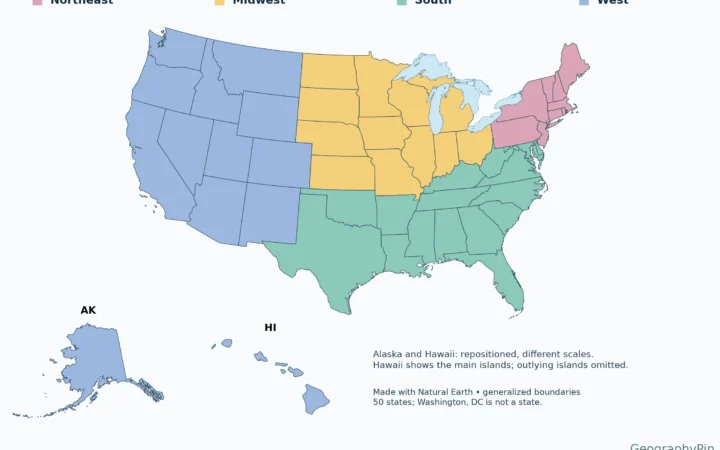
The Rust Belt is not an official list of states. Its core follows the old manufacturing cities of the southern Great Lakes and reaches inland to Pittsburgh and the upper Ohio Valley. State lists can help you locate it, but the industrial history is more local.
One broad research definition counts Illinois, Indiana, Michigan, New York, Ohio, Pennsylvania, West Virginia and Wisconsin. There is no official Rust Belt boundary. The historical core is easier to see by following industrial cities such as Detroit, Cleveland and Buffalo along the Great Lakes, then Pittsburgh in the upper Ohio Valley.
How to use this article: Find the industrial core on the map, then compare the lake ports with the inland steel valleys. The four-county job table shows recent changes.
The core of the Rust Belt
Start with cities, then read the state lines
The industrial core runs along the southern Great Lakes and into the upper Ohio Valley. Detroit, Cleveland and Buffalo anchor the lake corridor, while Pittsburgh anchors the inland branch. The linework on this map helps place that history, rather than declaring every community in a colored state part of the Rust Belt.
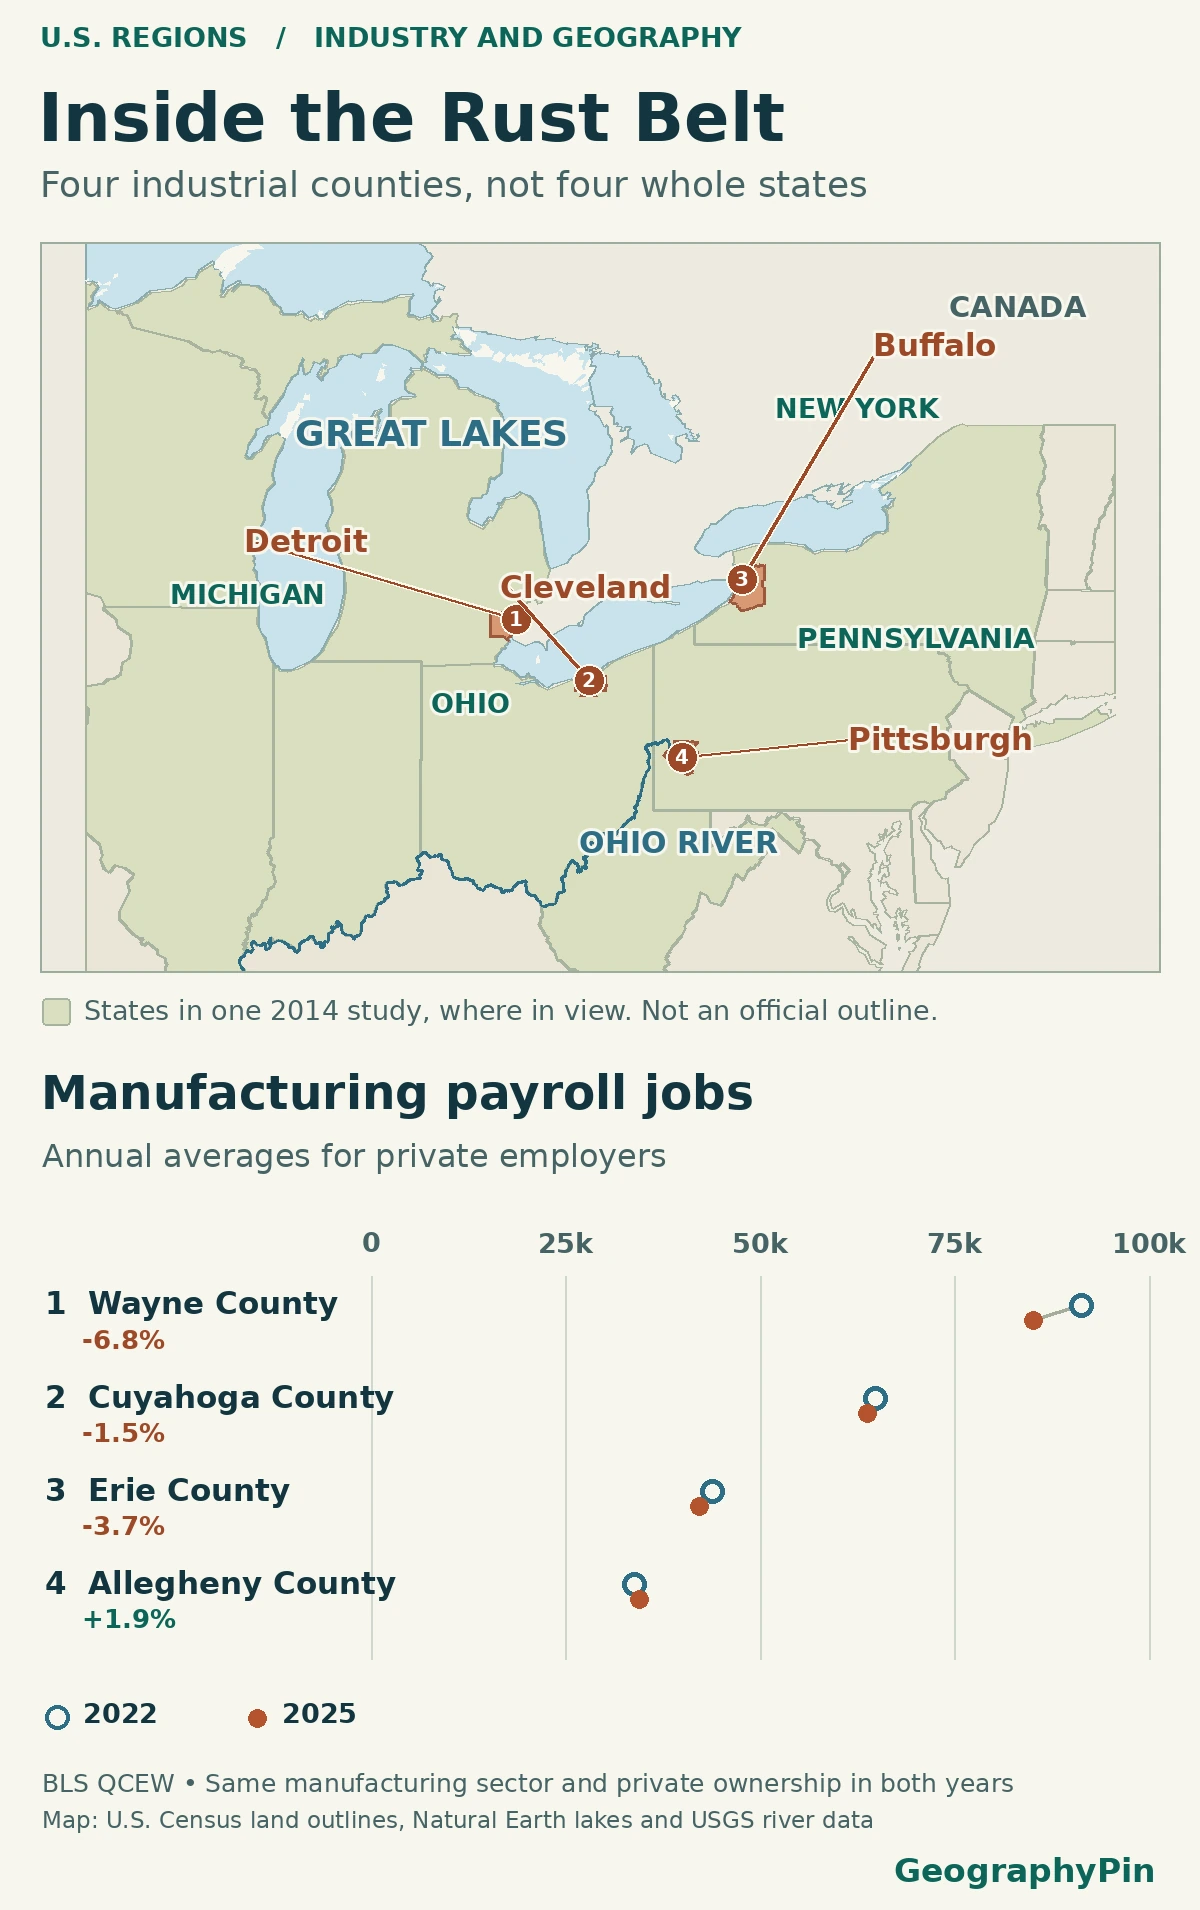
A broad, eight-state research definition includes Illinois, Indiana, Michigan, New York, Ohio, Pennsylvania, West Virginia and Wisconsin. It is useful for comparing complete state totals. But the same outline includes New York City as well as Buffalo; it does not show that the two cities formed part of the same lake-centered industrial corridor.
The Great Lakes manufacturing corridor
Follow the lakes from Detroit to Buffalo
Detroit is on the Detroit River, which links Lake St. Clair to Lake Erie. The National Park Service traces part of the city’s automotive rise to its skilled workers in metal and machine trades and its existing coachbuilding industry. The city’s motor industry was not simply a copy of the steel towns farther east.
Cleveland sits at the Cuyahoga River mouth on Lake Erie, where iron ore delivered by lake and coal brought from inland helped feed heavy industry. At the eastern end of the lake, Buffalo’s industrial waterfront extended beyond the city into neighboring Lackawanna. The former Bethlehem Steel site was on the Erie County shore there. Farther west, Gary’s steelworks grew alongside the southern shore of Lake Michigan. These sites help explain why a map drawn around port districts and factory towns is narrower than one drawn around state borders.
The upper Ohio Valley branch
Find Pittsburgh where two rivers form the Ohio
Pittsburgh is not on a Great Lake. The Allegheny and Monongahela meet at Pittsburgh to form the Ohio River. Historic mills and coke plants spread along those valleys; Homestead Works stood upstream on the Monongahela. Coal, making coke from it, and access to river and rail transport all helped build a different industrial geography from the Lake Erie shore.
West Virginia is easiest to misread on a state-based Rust Belt map. Its Northern Panhandle reaches into the upper Ohio Valley between Ohio and Pennsylvania, and the former Weirton Steel works show why its Ohio River towns fit an industrial-corridor definition. Including the entire state is a different choice. Nor does the fact that Pittsburgh sits at the head of the Ohio River make every city downstream part of the same industrial region.
What changed in four manufacturing counties?
Separate the job count from its share of local employment
Detroit marks the city on the map, but the payroll figures count jobs at workplaces across Wayne County. The corresponding figures for the other three places also cover their named counties, not city limits, residents by occupation or full metropolitan regions. The county comparison captures both Pittsburgh and nearby mill towns in Allegheny County and both Buffalo and Lackawanna in Erie County.
| City and county | 2022 jobs | 2025 jobs | Jobs gained or lost | Share of private jobs |
|---|---|---|---|---|
| Detroit Wayne County, Michigan | 91,380 | 85,201 | -6,179 | 14.40% → 13.39% |
| Cleveland Cuyahoga County, Ohio | 64,784 | 63,799 | -985 | 10.50% → 10.61% |
| Buffalo Erie County, New York | 43,884 | 42,269 | -1,615 | 11.52% → 10.78% |
| Pittsburgh Allegheny County, Pennsylvania | 33,878 | 34,527 | +649 | 5.66% → 5.69% |
Wayne County reported about 6,200 fewer manufacturing jobs in 2025 than in 2022, despite a small rise in total private jobs. Allegheny County had 649 more manufacturing jobs, and its manufacturing share edged up from 5.66% to 5.69%. Cuyahoga moved in opposite directions on the two measures: 985 fewer manufacturing jobs, but a higher manufacturing share because total private employment fell faster.
Two annual snapshots tell you what changed in the reported job counts, not why it changed or what happened in every year in between. Four examples also cannot tell you whether manufacturing rose or fell across the entire Rust Belt.
Wayne County’s published annual averages give a longer, uneven view. The Bureau of Labor Statistics reported 102,897 private manufacturing jobs there in 2005, 68,451 in 2010, and 85,201 in 2025. The 2025 count was below 2005 but above 2010. These are selected county benchmarks, not Detroit city counts or a continuous series.
Why Rust Belt maps draw different edges
The eight-state outline comes from a Federal Reserve Bank of Atlanta working paper. A Federal Reserve Bank of Cleveland study used a narrower test: it selected historically manufacturing-heavy metropolitan areas based on their 1969 manufacturing earnings relative to the U.S. average and their location in the industrial heartland. One rule counts whole states; the other selects metros. Their maps need not agree even when both are used correctly.
A Bureau of Labor Statistics paper used the Rust Belt as a case study of variation across metro labor markets in 1992–2000. Its period and geography differ from the four-county comparison above. The Rust Belt can tell you where to look for industrial history; it is not, by itself, a forecast of local job loss or a substitute for choosing a comparable set of places.
Frequently Asked Questions
Does a steelworker who commutes into the county count there?
Normally, yes, if the job is reported by a covered employer at a workplace in that county. These figures follow reported worksites, not home addresses.
Does the manufacturing count include mining coal or carrying steel by rail?
No. The BLS manufacturing total covers establishments classified in NAICS sectors 31–33. Coal mining establishments and freight rail establishments fall in other industries, even though they helped supply the same mills.
Is western New York in the Census Midwest?
No. The U.S. Census places all of New York in the Northeast, even though Buffalo is on the Great Lakes. The Rust Belt is a historical industrial region that crosses that standard Census boundary.
What Did We Learn Today?
The Rust Belt follows a history of manufacturing across state lines, not an official boundary. A whole-state outline gives one frame for research, while port and river cities show the industrial geography more closely. And fewer factory jobs do not always mean a smaller manufacturing share: what happens to other jobs matters too.
Sources & Data Notes
The GeographyPin map uses U.S. Census Bureau cartographic boundaries, Natural Earth public-domain lake geometry and the USGS National Linked Data Index for the Ohio River. The chart displays changes in the number of jobs, while the table also shows changes in their share of all private jobs. The eight-state comparison uses the Atlanta Fed working paper’s study definition; compare the Cleveland Fed’s metropolitan selection, the BLS Faberman paper on 1992–2000 metros and the Census Bureau’s separate regions and divisions. For industry groupings, see the 2022 NAICS sector definitions. Historical case sources are the National Park Service’s MotorCities, Cuyahoga industrial history, Indiana Dunes early development and Rivers of Steel, along with the New York DEC’s Lackawanna site account, the Library of Congress Weirton Steel record, the EPA Detroit River map and USGS description of the Ohio River’s origin. The BLS QCEW county annual CSV files were checked November 20, 2026, for Wayne County, MI (26163), Cuyahoga County, OH (39035), Erie County, NY (36029) and Allegheny County, PA (42003). We divided annual average employment in NAICS 31–33 by annual average employment for all industries (code 10), both with private ownership code 5; shares display two decimal places. Reported jobs are not unique people, self-employment is generally outside the program, and data can be revised. Prepared for final factual and editorial review by Zurab Koniashvili (Z.K. Atlas).
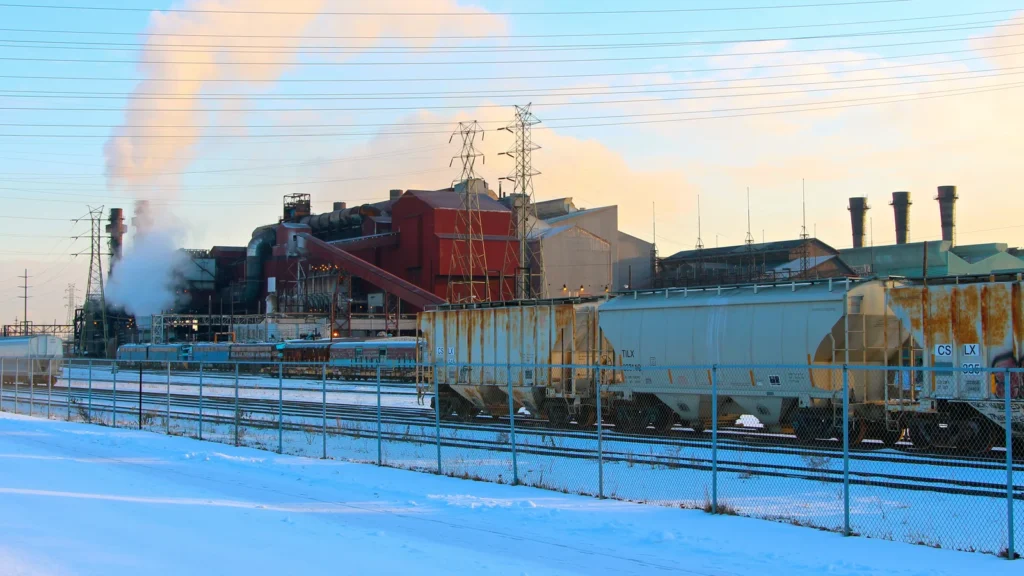
Featured image: Industrial Valley, Cleveland OH, Roy Luck, December 19, 2016, CC BY 2.0. Cropped, resized and converted to WebP. Commons source/licence review. The comparison graphic uses BLS QCEW annual employment and U.S. Census cartographic boundaries. County examples do not define an official regional boundary.
Wayne County benchmarks are from BLS QCEW annual-by-area files, FIPS 26163, private ownership (5), all sizes (0) and county manufacturing sector (31–33). BLS notes that classification or administrative changes can affect comparisons.