Nairobi challenges two common assumptions about African cities: that a place near the Equator must be uniformly hot, and that a large capital must be physically separate from substantial wildlife habitat. Its upland setting, river valleys and proximity to Nairobi National Park tell a more interesting geographic story.
Nairobi is Kenya’s inland capital in the country’s south-central uplands, just south of the Equator. Its roughly 5,900-foot (1,800 m) elevation moderates the tropical setting. Rivers cross the city toward the Athi system, while Nairobi National Park borders the urban landscape to the south. The city’s wider connections extend beyond Nairobi County.
Explore the landscape: Locate Nairobi on the map, explore its upland climate, follow its downstream connection, then compare the city and national park in a satellite image.
1. Where is Nairobi?
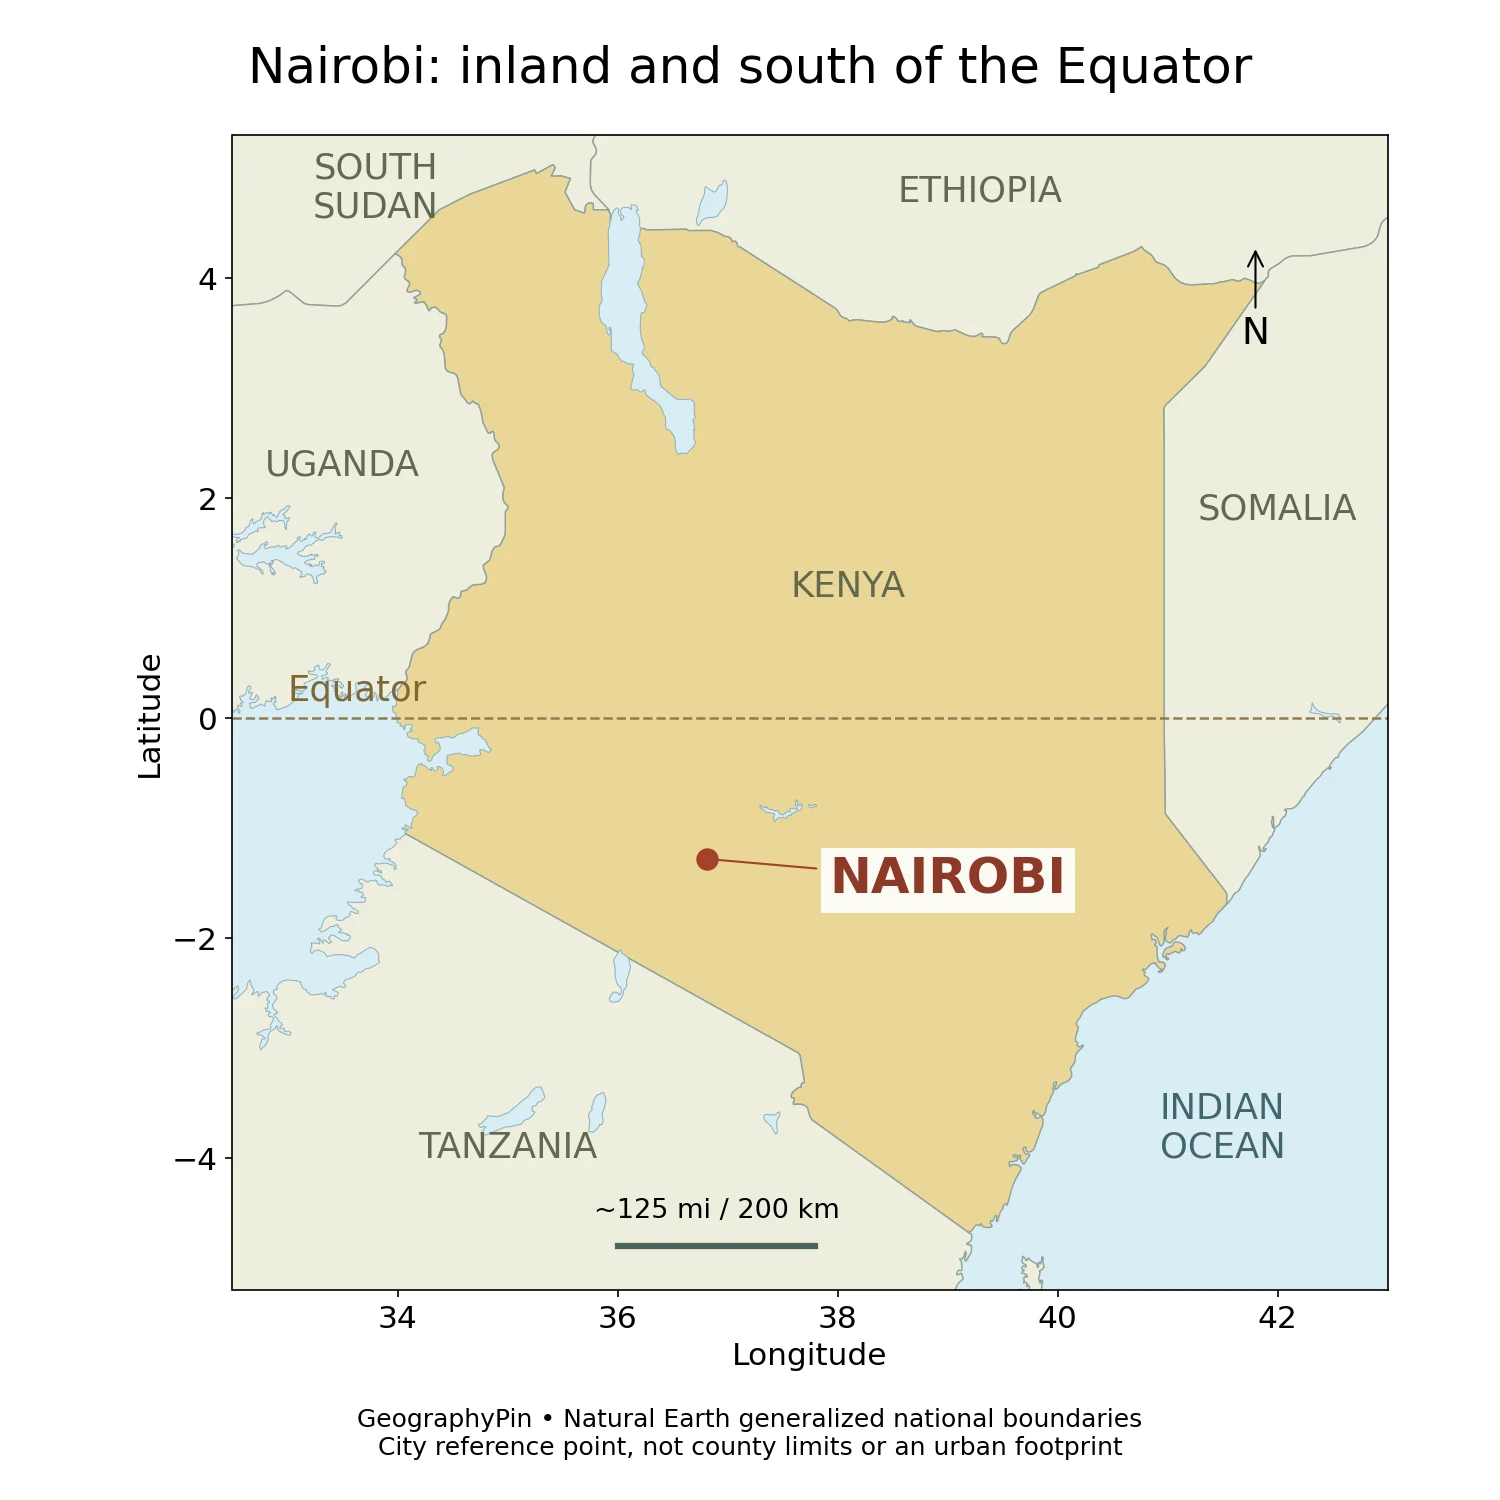
Nairobi lies in south-central Kenya, in East Africa. It is inland rather than on the Indian Ocean coast. The county’s development plan places it about 87 miles (140 km) south of the Equator, near the eastern side of the East African Rift landscape.
The Equator on the map is useful because it separates latitude from elevation. Nairobi is close to that global reference line, but it is also high above sea level. A world map that shows only latitude cannot explain its full climate or terrain.
The Ngong Hills lie to the west of the city. At a broader scale, Mount Kenya lies to the north and Kilimanjaro to the southeast. These landmarks provide regional orientation; they should not be mistaken for mountains inside the capital. Nairobi’s immediate landscape is made up of uplands, valleys, plains and urban development rather than a single isolated peak.
Nairobi County borders Kiambu to the north and west, Kajiado to the south and Machakos to the east. Those neighbors matter because travel, employment, settlement and drainage connect the capital to places beyond its administrative boundary. For a wider political overview, see our African countries and capitals guide.
2. Why a city near the Equator can feel cool
Elevation changes the equatorial picture
A useful rounded elevation for Nairobi is about 5,900 feet (1,800 m). The county plan gives nearby reference values rather than one height that applies to every street. Valleys and higher neighborhoods differ, so the rounded figure describes the city’s general upland setting, not an exact elevation for an address.
That height helps explain why proximity to the Equator does not translate into coastal-style heat. Nairobi has an upland climate, and evenings can be noticeably cool. Latitude helps determine the annual pattern of sunlight, while elevation and regional circulation influence the temperatures and rainfall experienced at ground level.
This also changes how “season” should be understood. Differences in day length are relatively modest near the Equator. The rhythm of wetter and drier periods is often more informative than importing a temperate four-season picture with a cold, snowy winter and a long-day summer.
Two broad rainy periods, not a fixed calendar
The county plan describes a bimodal rainfall pattern: a longer rainy period in roughly March–June and a shorter one around October–December. These are broad seasonal windows. Onset, duration and intensity vary, and the dates should not be read as a guarantee that every week within them is wet.
Rainfall interacts with the city’s surface. Water reaching a vegetated slope, a compacted yard and a paved road does not necessarily follow the same path. Where runoff reaches channels faster than it can be carried away, flooding can result. That mechanism is more useful than assuming that an upland city cannot flood because it is far above the sea.
3. The valleys and rivers crossing Nairobi
An inland capital connected to the Indian Ocean
The Nairobi River is part of the Athi River system. The county’s planning document describes rivers crossing Nairobi and joining the larger Athi downstream to the east. UNEP independently identifies the Nairobi River as an Athi tributary and describes the wider river system continuing to the Indian Ocean.
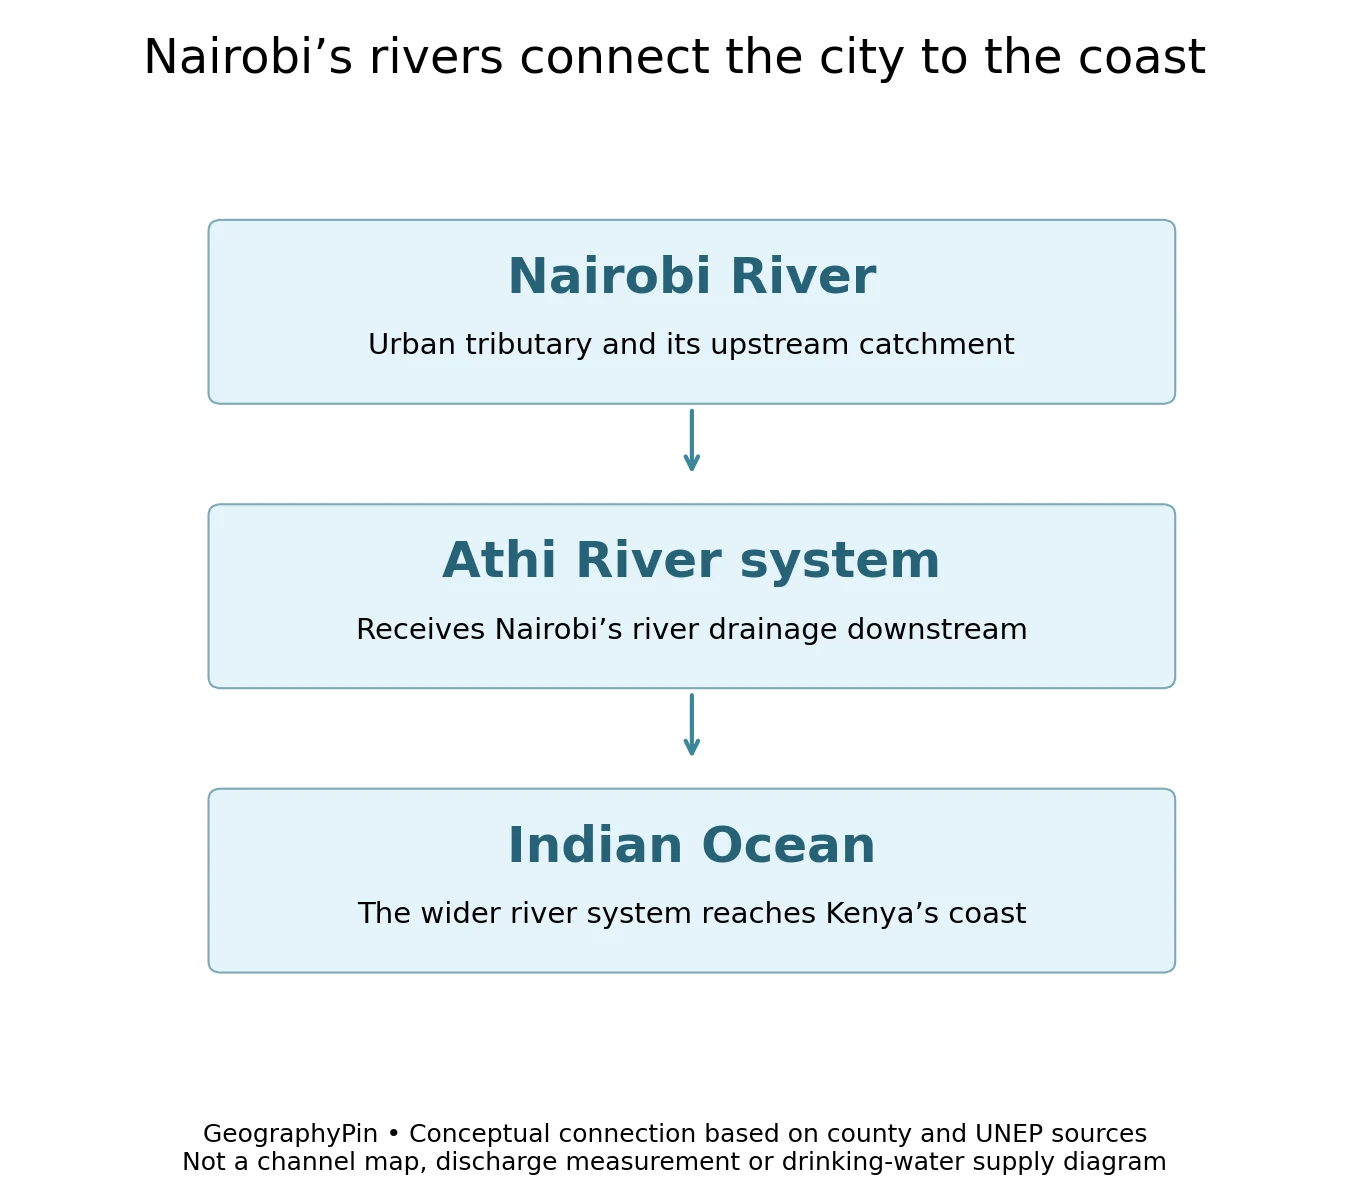
This connection is easy to miss on a street map. A channel that appears small beside a major road belongs to a much larger drainage network. Water and material carried out of the urban area can continue into downstream landscapes rather than stopping at the edge of the county.
Nairobi’s terrain is not uniformly flat. The county plan describes valleys cutting through parts of the eastern and northern landscape, with Karura Forest associated with steep-sided valleys. Elsewhere, gentler plains contrast with those incised channels. Roads and neighborhoods therefore occupy different positions within a landscape of slopes and drainage paths.
The underlying geology also matters. Volcanic rocks and sediments form an important part of the regional foundation, and the county plan describes aquifers within layered geological units. Surface rivers and groundwater are connected aspects of the water environment, but they are not the same thing. A river map does not show the depth or productivity of an aquifer beneath it.
UNEP’s discussion of Nairobi river restoration emphasizes looking at the whole basin and what enters the rivers, rather than treating restoration as simply removing visible litter from one stretch. That is a geographic lesson: the condition of a downstream channel reflects activities distributed across its catchment.
4. City growth beside a national park
Urban land and protected habitat are close neighbors
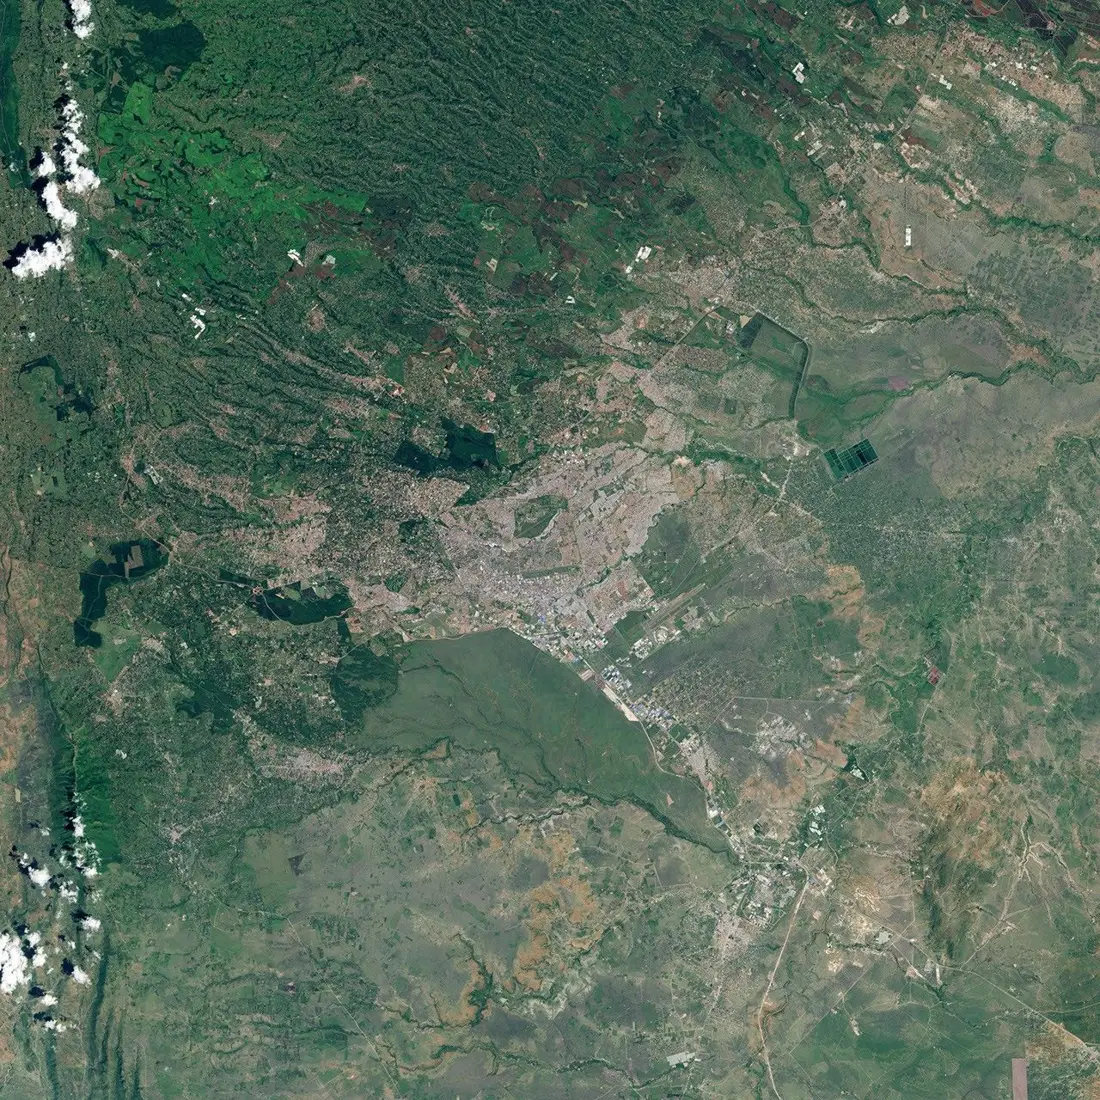
Nairobi National Park lies beside the capital’s southern urban landscape. Its proximity is one of the clearest examples of why “city” and “nature” cannot always be placed in separate geographic boxes. The juxtaposition of protected habitat and dense development is central to the city’s geography.
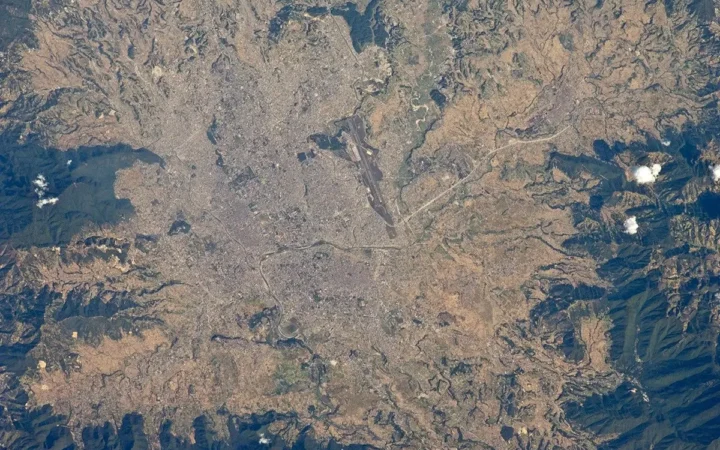
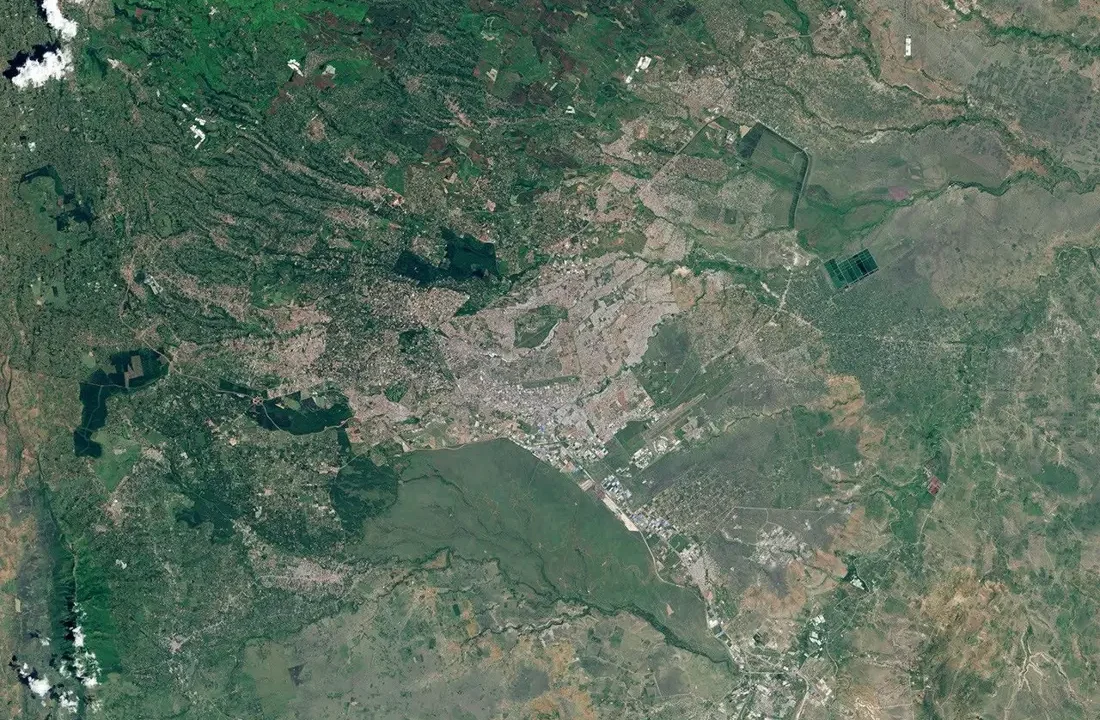
The satellite image shows a strong contrast between dense development and a more open area beside it. It helps readers understand the spatial relationship, but it should not be used to draw precise park boundaries or count present-day buildings. The acquisition date matters: this view records conditions in 2016, not today.
NASA published it alongside a 1986 image to illustrate urban expansion over three decades. The accompanying explanation also warns that the greener appearance of the later scene reflects a wetter climatic period. Greenness alone is therefore not proof that urban land has reverted to natural habitat or that forest cover increased by a particular amount.
Protected land near a growing city creates questions that extend beyond scenery: how adjoining land is developed, how transport corridors are arranged and how water moves through the surrounding landscape. The photograph makes those relationships tangible without turning a general profile into a travel itinerary or a claim about current wildlife numbers.
5. Population, county boundaries and the wider metropolis
A dated census count, not a real-time total
The county’s development plan reports 4,397,073 people in Nairobi County in the 2019 Kenya Population and Housing Census. Its footnote identifies this as the night-time population enumerated during the census. That figure should not be relabeled as the current population or as the number of people present in the business district during a working day.
The same planning document also includes population projections for later years. A projection and a census count answer different questions: one estimates a later situation under assumptions, while the other records an enumeration for a defined reference time. Keeping the 2019 date attached avoids presenting a modeled future figure as an observed total.
| Geographic view | What it helps explain | What it does not define |
|---|---|---|
| Central urban area | The concentration of streets, offices and services | All residents of the county |
| Nairobi County | A defined administrative and planning area | Every settlement economically connected to the capital |
| River catchment | Where runoff reaches a connected channel network | A political boundary or commuter region |
A practical example is the contrast between a dense neighborhood and protected or less built-up land. Both may be relevant to a city-scale description, but averaging them together can hide very different local conditions. Population density is meaningful only when its area and population reference match.
6. From railway depot to inland capital
Transport helped turn an upland site into a capital
Nairobi’s growth was not simply the inevitable result of pleasant weather. The county plan traces its foundation to a colonial railway depot in 1899, on the railway linking the Kenyan coast with the interior. Its position along the Mombasa–Kampala corridor gave the settlement a transport role before it became a major metropolis.
It replaced Mombasa as the colonial capital in 1907 and remained Kenya’s capital after independence in 1963. These administrative functions reinforced the earlier transport function: government offices, commercial activity and services increasingly concentrated in the inland city.
Today, the county plan identifies Nairobi as a transport and communications hub, with Jomo Kenyatta International Airport adding international connections to its inland location. National government institutions, diplomatic missions and businesses give the capital a reach that cannot be explained by its physical footprint alone.
This history connects the profile’s physical and human geography. The upland site, rivers and regional corridor help explain the setting; railway investment and the concentration of administrative functions help explain why a large city developed there. Neither terrain alone nor a list of population figures tells the whole story.
Frequently Asked Questions
Is Nairobi on the Equator?
No. It lies south of the Equator, about 87 miles (140 km) away according to the county development plan.
Why is Nairobi cooler than many people expect?
Its upland elevation, roughly 5,900 feet (1,800 m), moderates its near-equatorial setting. Local terrain and weather still cause variation.
Where does the Nairobi River flow?
It joins the Athi River system, whose wider downstream network reaches the Indian Ocean. The conceptual diagram omits smaller tributaries and changes in downstream river names.
What was Nairobi County’s population in 2019?
The county plan reports 4,397,073 people enumerated in the 2019 census. This is a dated county total, not a current estimate for the wider metropolitan region.
Where is Nairobi National Park relative to the city?
It is a protected area beside the city’s southern urban landscape. That close proximity is geographically important, but a satellite photograph is not a legal boundary map.
What Did We Learn Today?
Nairobi is an upland, near-equatorial capital whose physical geography reaches well beyond its streets. Elevation moderates the climate, valleys connect urban rivers to the Athi system, and national park habitat stands beside dense development. County statistics, satellite images and drainage diagrams each reveal a different part of that picture when their dates and boundaries are kept clear.
Sources & Data Notes
Population is the county plan’s explicitly dated 2019 census figure, not its later projections. Elevation is rounded from the plan’s approximately 1,795–1,798 m reference values and does not apply to every neighborhood. Rainy periods are broad climatic patterns, not forecasts. No current pollution concentrations, wildlife totals or urban growth rates are asserted.
The original locator uses generalized Natural Earth country and lake geometry, with a city reference point rather than a municipal outline. The river diagram is conceptual. The NASA image dates from January 24, 2016, and was converted to a lightweight format without altering its geographic content; it is not evidence of present-day boundaries or vegetation conditions.
- Nairobi City County: Integrated Development Plan 2023–2027, especially pp. 1–4 and 8–9
- KNBS: 2019 census reports
- UNEP: Athi River and the Nairobi tributary
- UNEP: restoring Nairobi’s rivers
- NASA Earth Observatory: Nairobi Swells with Urban Growth, 2016
- NASA image-use guidelines
- Natural Earth public-domain data