Population density maps are useful only when the year, denominator and coverage are clear. This resource makes those details visible alongside the colors.
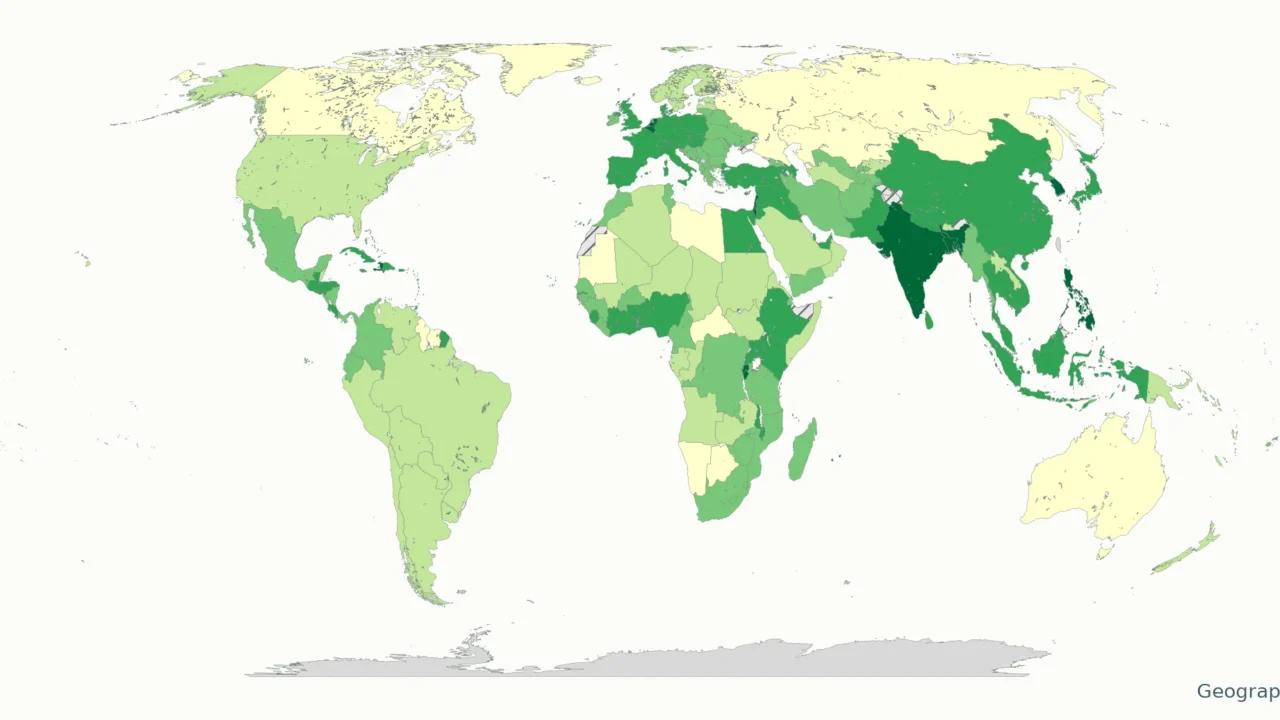
This world map shows each economy’s latest available World Bank population density, mostly for 2024. Density means people per unit of land area, not total population. Values appear in people per square mile and per square kilometer, with the source year shown for each entry.
How to use this article: Check the source inputs, reproduce the unit conversion, or inspect the data vintage before comparing places.
Maps fit the screen by default. Select 2× or 4× for details, swipe or scroll within the map, and choose Fit / Reset for the full view.
1. World Density Map and Downloads
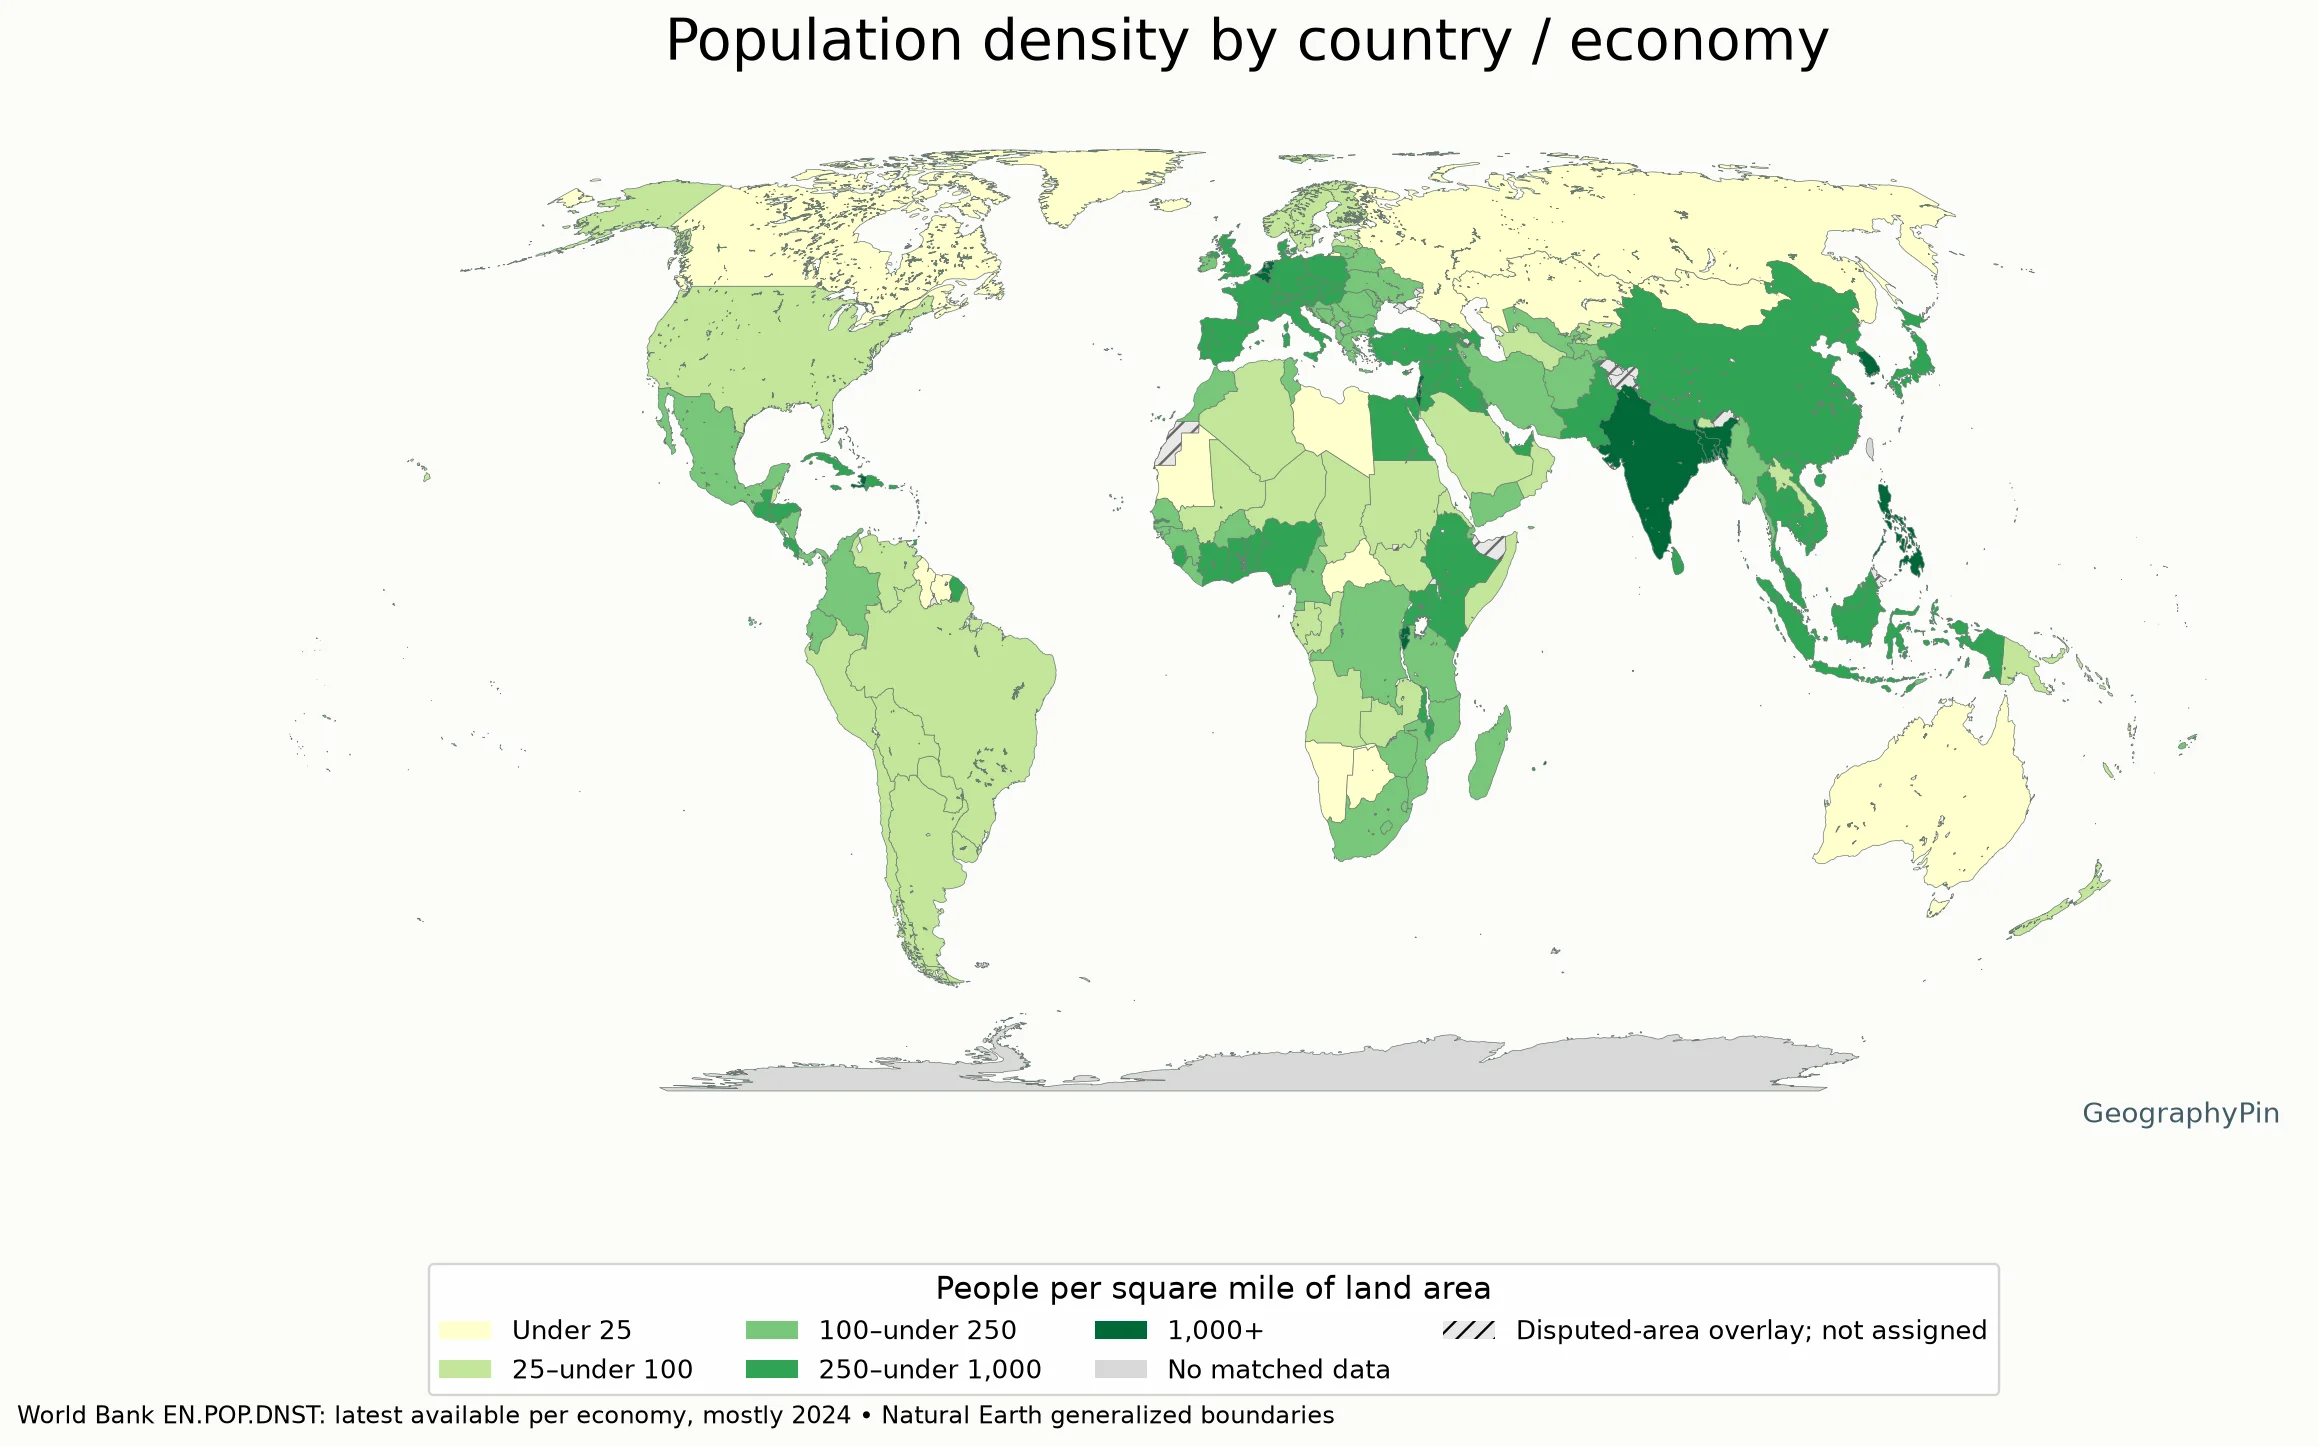
Map key: people per square mile of land
- Very light yellow: under 25
- Light green: 25 to under 100
- Medium green: 100 to under 250
- Dark green: 250 to under 1,000
- Deep green: 1,000 or more
- Grey: no exact matched data
- Hatched grey: source-defined disputed area; no density assigned
Download the complete density data (CSV). Each row records the source economy, reference year and both units. The source contains 217 nonaggregate economies, not 217 sovereign countries. Of those, 216 have observations in this extract: 214 for 2024, Nicaragua for 2023 and Channel Islands for 2021. No observation was returned for Kosovo.
The map is a visual index to that dataset, not a count of countries. It uses an exact identifier match to generalized Natural Earth polygons. Channel Islands and Gibraltar do not have exact matching polygons in this layer; their values remain available in the table and CSV. Some territories are separate source economies, while political boundaries and statistical reporting areas do not always coincide.
2. Read the Colors Without Losing the Year
The five classes are editorial display choices: under 25; 25 to under 100; 100 to under 250; 250 to under 1,000; and 1,000 or more people per square mile. They are not World Bank categories or thresholds for overcrowding. A darker color means a larger national or territorial average in this dataset, not that every part of the place is densely settled.
The same class covers a range of values. A place close to a class boundary can have a different color from another with a very similar density. Use the table for numerical comparison rather than estimating a ratio from the shade.
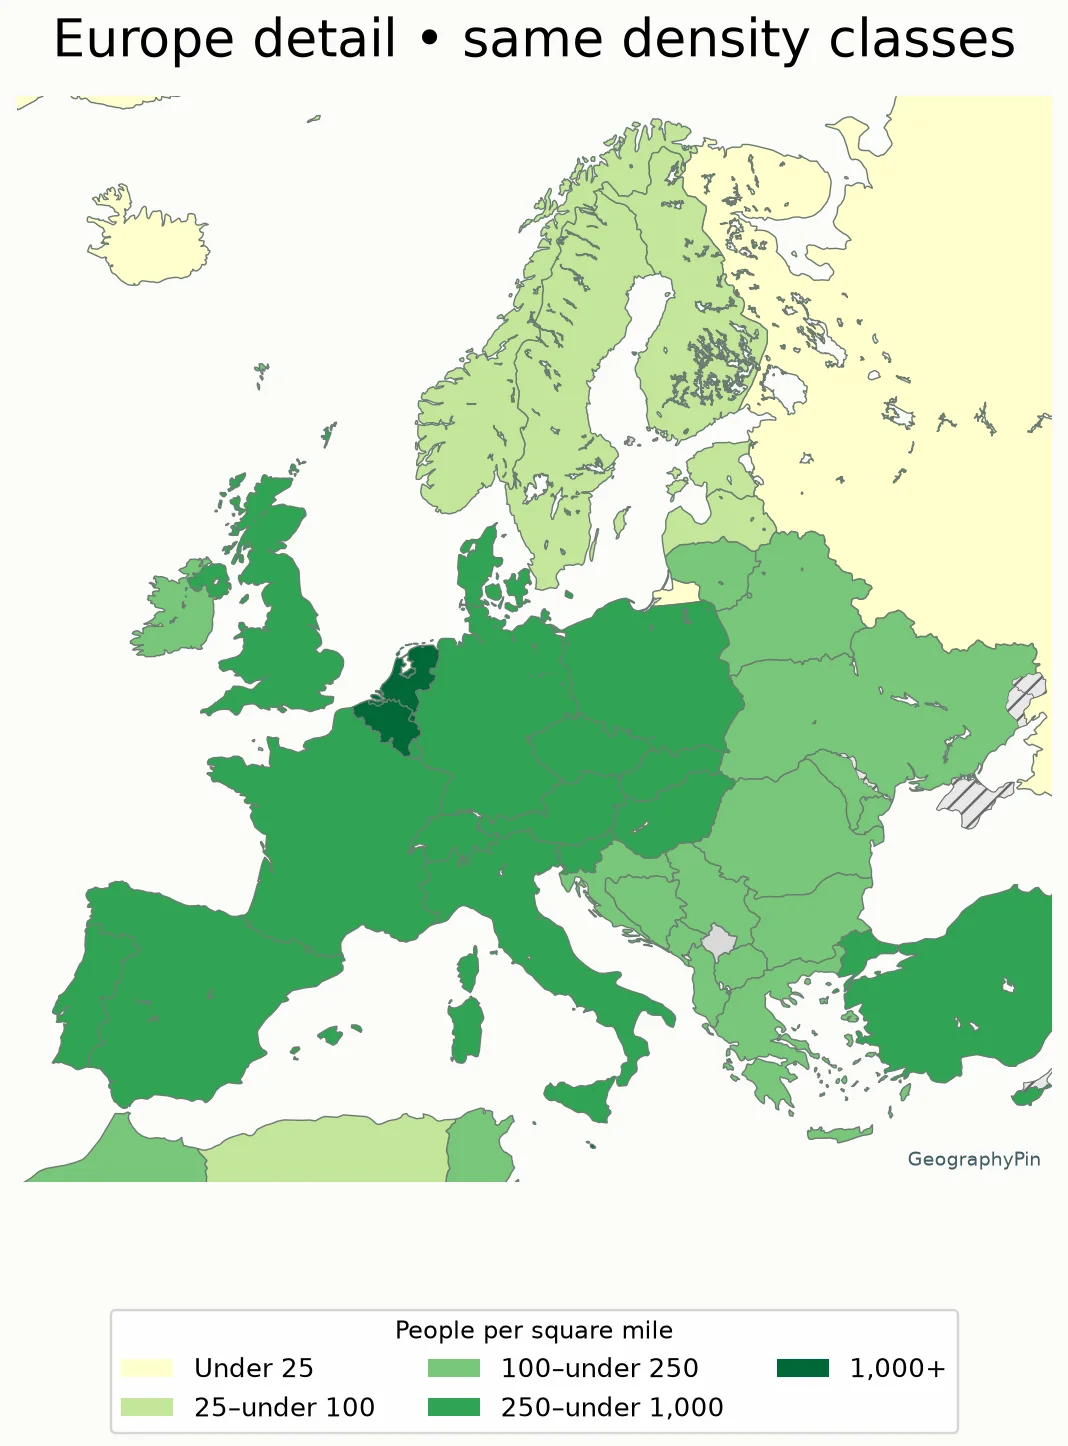
Map key: people per square mile of land
- Very light yellow: under 25
- Light green: 25 to under 100
- Medium green: 100 to under 250
- Dark green: 250 to under 1,000
- Deep green: 1,000 or more
- Grey: no exact matched data
- Hatched grey: source-defined disputed area; no density assigned
Large countries can dominate a world map visually even when their averages are low. Very small, densely populated economies may barely be visible. That is a map-scale limitation, not evidence that their populations are missing from the dataset.
3. Country and Economy Values
Values below are rounded to one decimal place for display. The CSV retains the unrounded numerical values returned by the source and the calculated unit conversion. Names follow the source, so this is a statistical reference rather than an endorsement of any disputed status.
Open the complete alphabetical density table
| Country/economy | Year | People/sq mi | People/km² |
|---|---|---|---|
| Afghanistan | 2024 | 169.4 | 65.4 |
| Albania | 2024 | 224.7 | 86.8 |
| Algeria | 2024 | 50.9 | 19.7 |
| American Samoa | 2024 | 608.6 | 235.0 |
| Andorra | 2024 | 453.5 | 175.1 |
| Angola | 2024 | 78.7 | 30.4 |
| Antigua and Barbuda | 2024 | 551.6 | 213.0 |
| Argentina | 2024 | 43.2 | 16.7 |
| Armenia | 2024 | 278.6 | 107.6 |
| Aruba | 2024 | 1,553.9 | 600.0 |
| Australia | 2024 | 9.2 | 3.5 |
| Austria | 2024 | 288.1 | 111.2 |
| Azerbaijan | 2024 | 319.7 | 123.4 |
| Bahamas, The | 2024 | 103.8 | 40.1 |
| Bahrain | 2024 | 5,143.3 | 1,985.8 |
| Bangladesh | 2024 | 3,453.4 | 1,333.4 |
| Barbados | 2024 | 1,697.4 | 655.4 |
| Belarus | 2024 | 116.5 | 45.0 |
| Belgium | 2024 | 1,007.2 | 388.9 |
| Belize | 2024 | 47.4 | 18.3 |
| Benin | 2024 | 332.2 | 128.3 |
| Bermuda | 2024 | 3,100.1 | 1,197.0 |
| Bhutan | 2024 | 53.8 | 20.8 |
| Bolivia | 2024 | 29.6 | 11.4 |
| Bosnia and Herzegovina | 2024 | 160.1 | 61.8 |
| Botswana | 2024 | 11.5 | 4.4 |
| Brazil | 2024 | 65.7 | 25.4 |
| British Virgin Islands | 2024 | 677.0 | 261.4 |
| Brunei Darussalam | 2024 | 227.4 | 87.8 |
| Bulgaria | 2024 | 153.7 | 59.3 |
| Burkina Faso | 2024 | 222.9 | 86.1 |
| Burundi | 2024 | 1,416.8 | 547.0 |
| Cabo Verde | 2024 | 337.3 | 130.2 |
| Cambodia | 2024 | 258.8 | 99.9 |
| Cameroon | 2024 | 159.6 | 61.6 |
| Canada | 2024 | 12.2 | 4.7 |
| Cayman Islands | 2024 | 803.5 | 310.2 |
| Central African Republic | 2024 | 22.2 | 8.6 |
| Chad | 2024 | 41.8 | 16.1 |
| Channel Islands | 2021 | 2,181.1 | 842.1 |
| Chile | 2024 | 69.0 | 26.6 |
| China | 2024 | 388.7 | 150.1 |
| Colombia | 2024 | 123.5 | 47.7 |
| Comoros | 2024 | 1,200.5 | 463.5 |
| Congo, Dem. Rep. | 2024 | 124.8 | 48.2 |
| Congo, Rep. | 2024 | 48.0 | 18.5 |
| Costa Rica | 2024 | 262.8 | 101.5 |
| Cote d’Ivoire | 2024 | 260.1 | 100.4 |
| Croatia | 2024 | 178.9 | 69.1 |
| Cuba | 2024 | 274.0 | 105.8 |
| Curacao | 2024 | 909.8 | 351.3 |
| Cyprus | 2024 | 380.7 | 147.0 |
| Czechia | 2024 | 366.1 | 141.3 |
| Denmark | 2024 | 387.0 | 149.4 |
| Djibouti | 2024 | 130.6 | 50.4 |
| Dominica | 2024 | 228.3 | 88.2 |
| Dominican Republic | 2024 | 614.1 | 237.1 |
| Ecuador | 2024 | 189.1 | 73.0 |
| Egypt, Arab Rep. | 2024 | 303.2 | 117.1 |
| El Salvador | 2024 | 792.3 | 305.9 |
| Equatorial Guinea | 2024 | 174.7 | 67.5 |
| Eritrea | 2024 | 75.8 | 29.3 |
| Estonia | 2024 | 83.2 | 32.1 |
| Eswatini | 2024 | 187.1 | 72.3 |
| Ethiopia | 2024 | 304.8 | 117.7 |
| Faroe Islands | 2024 | 103.3 | 39.9 |
| Fiji | 2024 | 131.2 | 50.7 |
| Finland | 2024 | 47.9 | 18.5 |
| France | 2024 | 329.4 | 127.2 |
| French Polynesia | 2024 | 207.3 | 80.0 |
| Gabon | 2024 | 25.5 | 9.9 |
| Gambia, The | 2024 | 706.4 | 272.7 |
| Georgia | 2024 | 172.8 | 66.7 |
| Germany | 2024 | 619.0 | 239.0 |
| Ghana | 2024 | 391.9 | 151.3 |
| Gibraltar | 2024 | 10,186.2 | 3,932.9 |
| Greece | 2024 | 209.1 | 80.7 |
| Greenland | 2024 | 0.4 | 0.1 |
| Grenada | 2024 | 882.5 | 340.7 |
| Guam | 2024 | 803.2 | 310.1 |
| Guatemala | 2024 | 444.9 | 171.8 |
| Guinea | 2024 | 155.5 | 60.0 |
| Guinea-Bissau | 2024 | 202.8 | 78.3 |
| Guyana | 2024 | 10.2 | 3.9 |
| Haiti | 2024 | 1,106.3 | 427.2 |
| Honduras | 2024 | 250.6 | 96.8 |
| Hong Kong SAR, China | 2024 | 18,559.4 | 7,165.8 |
| Hungary | 2024 | 271.4 | 104.8 |
| Iceland | 2024 | 9.9 | 3.8 |
| India | 2024 | 1,263.9 | 488.0 |
| Indonesia | 2024 | 388.0 | 149.8 |
| Iran, Islamic Rep. | 2024 | 146.2 | 56.4 |
| Iraq | 2024 | 274.7 | 106.1 |
| Ireland | 2024 | 202.9 | 78.3 |
| Isle of Man | 2024 | 380.8 | 147.0 |
| Israel | 2024 | 1,197.1 | 462.2 |
| Italy | 2024 | 516.3 | 199.4 |
| Jamaica | 2024 | 679.0 | 262.2 |
| Japan | 2024 | 880.9 | 340.1 |
| Jordan | 2024 | 337.0 | 130.1 |
| Kazakhstan | 2024 | 19.8 | 7.6 |
| Kenya | 2024 | 251.6 | 97.2 |
| Kiribati | 2024 | 429.6 | 165.9 |
| Korea, Dem. People’s Rep. | 2024 | 570.0 | 220.1 |
| Korea, Rep. | 2024 | 1,373.3 | 530.2 |
| Kosovo | — | No data | No data |
| Kuwait | 2024 | 711.8 | 274.8 |
| Kyrgyz Republic | 2024 | 97.5 | 37.7 |
| Lao PDR | 2024 | 87.2 | 33.7 |
| Latvia | 2024 | 77.7 | 30.0 |
| Lebanon | 2024 | 1,469.9 | 567.5 |
| Lesotho | 2024 | 199.4 | 77.0 |
| Liberia | 2024 | 150.9 | 58.3 |
| Libya | 2024 | 10.9 | 4.2 |
| Liechtenstein | 2024 | 654.8 | 252.8 |
| Lithuania | 2024 | 119.5 | 46.1 |
| Luxembourg | 2024 | 681.1 | 263.0 |
| Macao SAR, China | 2024 | 53,433.1 | 20,630.6 |
| Madagascar | 2024 | 142.3 | 54.9 |
| Malawi | 2024 | 594.9 | 229.7 |
| Malaysia | 2024 | 280.3 | 108.2 |
| Maldives | 2024 | 4,587.2 | 1,771.1 |
| Mali | 2024 | 52.0 | 20.1 |
| Malta | 2024 | 4,674.9 | 1,805.0 |
| Marshall Islands | 2024 | 537.3 | 207.4 |
| Mauritania | 2024 | 13.0 | 5.0 |
| Mauritius | 2024 | 1,613.3 | 622.9 |
| Mexico | 2024 | 174.4 | 67.3 |
| Micronesia, Fed. Sts. | 2024 | 418.1 | 161.4 |
| Moldova | 2024 | 216.3 | 83.5 |
| Monaco | 2024 | 48,010.5 | 18,536.9 |
| Mongolia | 2024 | 5.9 | 2.3 |
| Montenegro | 2024 | 120.1 | 46.4 |
| Morocco | 2024 | 221.0 | 85.3 |
| Mozambique | 2024 | 114.1 | 44.0 |
| Myanmar | 2024 | 216.3 | 83.5 |
| Namibia | 2024 | 9.5 | 3.7 |
| Naoero | 2024 | 1,473.5 | 568.9 |
| Nepal | 2024 | 535.7 | 206.8 |
| Netherlands | 2024 | 1,384.1 | 534.4 |
| New Caledonia | 2024 | 40.8 | 15.8 |
| New Zealand | 2024 | 52.0 | 20.1 |
| Nicaragua | 2023 | 146.9 | 56.7 |
| Niger | 2024 | 55.3 | 21.3 |
| Nigeria | 2024 | 661.7 | 255.5 |
| North Macedonia | 2024 | 187.4 | 72.3 |
| Northern Mariana Islands | 2024 | 250.9 | 96.9 |
| Norway | 2024 | 39.6 | 15.3 |
| Oman | 2024 | 44.2 | 17.1 |
| Pakistan | 2024 | 844.2 | 326.0 |
| Palau | 2024 | 99.6 | 38.5 |
| Panama | 2024 | 157.7 | 60.9 |
| Papua New Guinea | 2024 | 60.5 | 23.4 |
| Paraguay | 2024 | 45.3 | 17.5 |
| Peru | 2024 | 69.2 | 26.7 |
| Philippines | 2024 | 1,006.3 | 388.5 |
| Poland | 2024 | 309.4 | 119.4 |
| Portugal | 2024 | 302.4 | 116.7 |
| Puerto Rico (US) | 2024 | 935.1 | 361.1 |
| Qatar | 2024 | 644.2 | 248.7 |
| Romania | 2024 | 214.5 | 82.8 |
| Russian Federation | 2024 | 22.7 | 8.8 |
| Rwanda | 2024 | 1,553.9 | 599.9 |
| Samoa | 2024 | 203.1 | 78.4 |
| San Marino | 2024 | 1,437.9 | 555.2 |
| Sao Tome and Principe | 2024 | 635.5 | 245.3 |
| Saudi Arabia | 2024 | 42.5 | 16.4 |
| Senegal | 2024 | 248.9 | 96.1 |
| Serbia | 2024 | 194.8 | 75.2 |
| Seychelles | 2024 | 687.8 | 265.5 |
| Sierra Leone | 2024 | 310.1 | 119.7 |
| Singapore | 2024 | 21,572.0 | 8,329.0 |
| Sint Maarten (Dutch part) | 2024 | 3,302.2 | 1,275.0 |
| Slovak Republic | 2024 | 292.1 | 112.8 |
| Slovenia | 2024 | 273.7 | 105.7 |
| Solomon Islands | 2024 | 75.8 | 29.3 |
| Somalia, Fed. Rep. | 2024 | 78.5 | 30.3 |
| South Africa | 2024 | 136.7 | 52.8 |
| South Sudan | 2024 | 49.0 | 18.9 |
| Spain | 2024 | 253.2 | 97.8 |
| Sri Lanka | 2024 | 917.6 | 354.3 |
| St. Kitts and Nevis | 2024 | 464.8 | 179.5 |
| St. Lucia | 2024 | 763.2 | 294.7 |
| St. Martin (French part) | 2024 | 1,276.9 | 493.0 |
| St. Vincent and the Grenadines | 2024 | 669.9 | 258.7 |
| Sudan | 2024 | 69.9 | 27.0 |
| Suriname | 2024 | 10.2 | 4.0 |
| Sweden | 2024 | 67.2 | 26.0 |
| Switzerland | 2024 | 590.3 | 227.9 |
| Syrian Arab Republic | 2024 | 348.0 | 134.4 |
| Tajikistan | 2024 | 197.6 | 76.3 |
| Tanzania | 2024 | 200.9 | 77.6 |
| Thailand | 2024 | 363.3 | 140.3 |
| Timor-Leste | 2024 | 244.0 | 94.2 |
| Togo | 2024 | 400.3 | 154.6 |
| Tonga | 2024 | 374.7 | 144.7 |
| Trinidad and Tobago | 2024 | 691.1 | 266.8 |
| Tunisia | 2024 | 204.7 | 79.0 |
| Turkiye | 2024 | 287.8 | 111.1 |
| Turkmenistan | 2024 | 41.3 | 15.9 |
| Turks and Caicos Islands | 2024 | 127.1 | 49.1 |
| Tuvalu | 2024 | 960.9 | 371.0 |
| Uganda | 2024 | 646.0 | 249.4 |
| Ukraine | 2024 | 169.2 | 65.3 |
| United Arab Emirates | 2024 | 400.7 | 154.7 |
| United Kingdom | 2024 | 741.7 | 286.4 |
| United States | 2024 | 96.3 | 37.2 |
| Uruguay | 2024 | 50.1 | 19.4 |
| Uzbekistan | 2024 | 214.8 | 82.9 |
| Vanuatu | 2024 | 69.6 | 26.9 |
| Venezuela, RB | 2024 | 83.4 | 32.2 |
| Viet Nam | 2024 | 834.5 | 322.2 |
| Virgin Islands (U.S.) | 2024 | 776.8 | 299.9 |
| West Bank and Gaza | 2024 | 2,273.7 | 877.9 |
| Yemen, Rep. | 2024 | 199.1 | 76.9 |
| Zambia | 2024 | 74.3 | 28.7 |
| Zimbabwe | 2024 | 111.4 | 43.0 |
4. Method, Units and Missing Data
Source inputs
World Bank indicator EN.POP.DNST divides midyear population by land area. The denominator excludes inland water, continental-shelf claims and exclusive economic zones. This article uses the published indicator rather than measuring country polygons and treating that cartographic area as the statistical denominator.
Unit conversion
To convert people per square kilometer to people per square mile, multiply by 2.589988110336. The land unit changes; the population and reporting territory do not. A square mile is larger than a square kilometer, so the numerical density per square mile is higher.
Data vintage and interpretation
The data request selects the most recent nonempty observation for each economy. That does not guarantee one common year. Regional and income-group aggregates are removed using the World Bank economy metadata; missing values are not changed to zero. The downloaded snapshot identifies its source update as October 8, 2026, but its observations are older. It is not a map of measured 2026 population density.
Population estimates and reporting coverage have limitations, especially during displacement or where census coverage is weak. World Bank metadata describes its population concept and treatment of refugees. The map cannot correct those underlying statistical limitations. It should not be used to infer the precise territorial extent of a population estimate from a shaded outline.
5. What This Map Cannot Tell You
National averages do not locate individual settlements, distinguish a crowded city from empty rural land, or measure housing conditions. Two places with the same average can have very different settlement patterns. Density is also not total population: a smaller place can have fewer residents but more people per unit of land.
For city-level planning, use a suitable local dataset with its own date and boundary definition. For a time comparison, retrieve the same indicator for a common set of years instead of comparing this mixed-year latest-value snapshot with an unrelated map. Do not compare land-area density with total-area density without accounting for the different denominator.
For the underlying concept and common denominator mistakes, see our population density explainer.
What Did We Learn Today?
The map compares land-area population density, not population totals. Most values are for 2024, but the year column matters. Exact numbers, missing data and tiny territories are easier to interpret in the table than through the colors alone.
Sources & Data Notes
Natural Earth lake surfaces are removed from the country display polygons so inland water is not colored as populated land. This affects only the picture, not the World Bank population-density values or their land-area denominator. Generalized lake and administrative outlines can differ slightly at shorelines.
Data: World Bank World Development Indicators, EN.POP.DNST (CC BY 4.0; unit conversions and map presentation by GeographyPin), downloaded November 11, 2026. Sources credited by the indicator include FAO and World Bank population estimates. Maps: public-domain Natural Earth 1:50 million country and disputed-area layers, Equal Earth projection for the world and EPSG: 3035 for the detail. Disputed areas are masked and not assigned map densities; the overlay is not an exhaustive contemporary legal-boundary statement. Numeric values remain source-defined economy averages. These are generalized reference maps, not boundary-survey products.