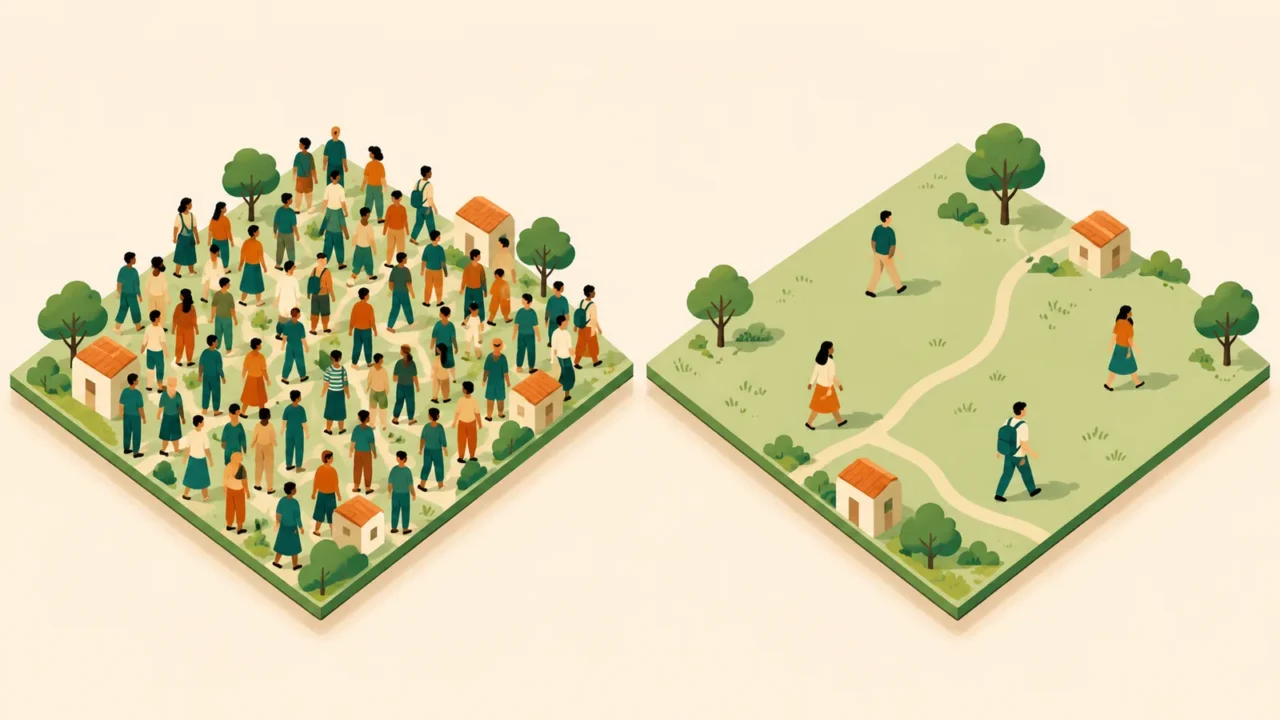
Population density looks like a simple division problem until two sources give different answers for the same place. The difference may come from the people counted, the land included, or the date and boundary used.
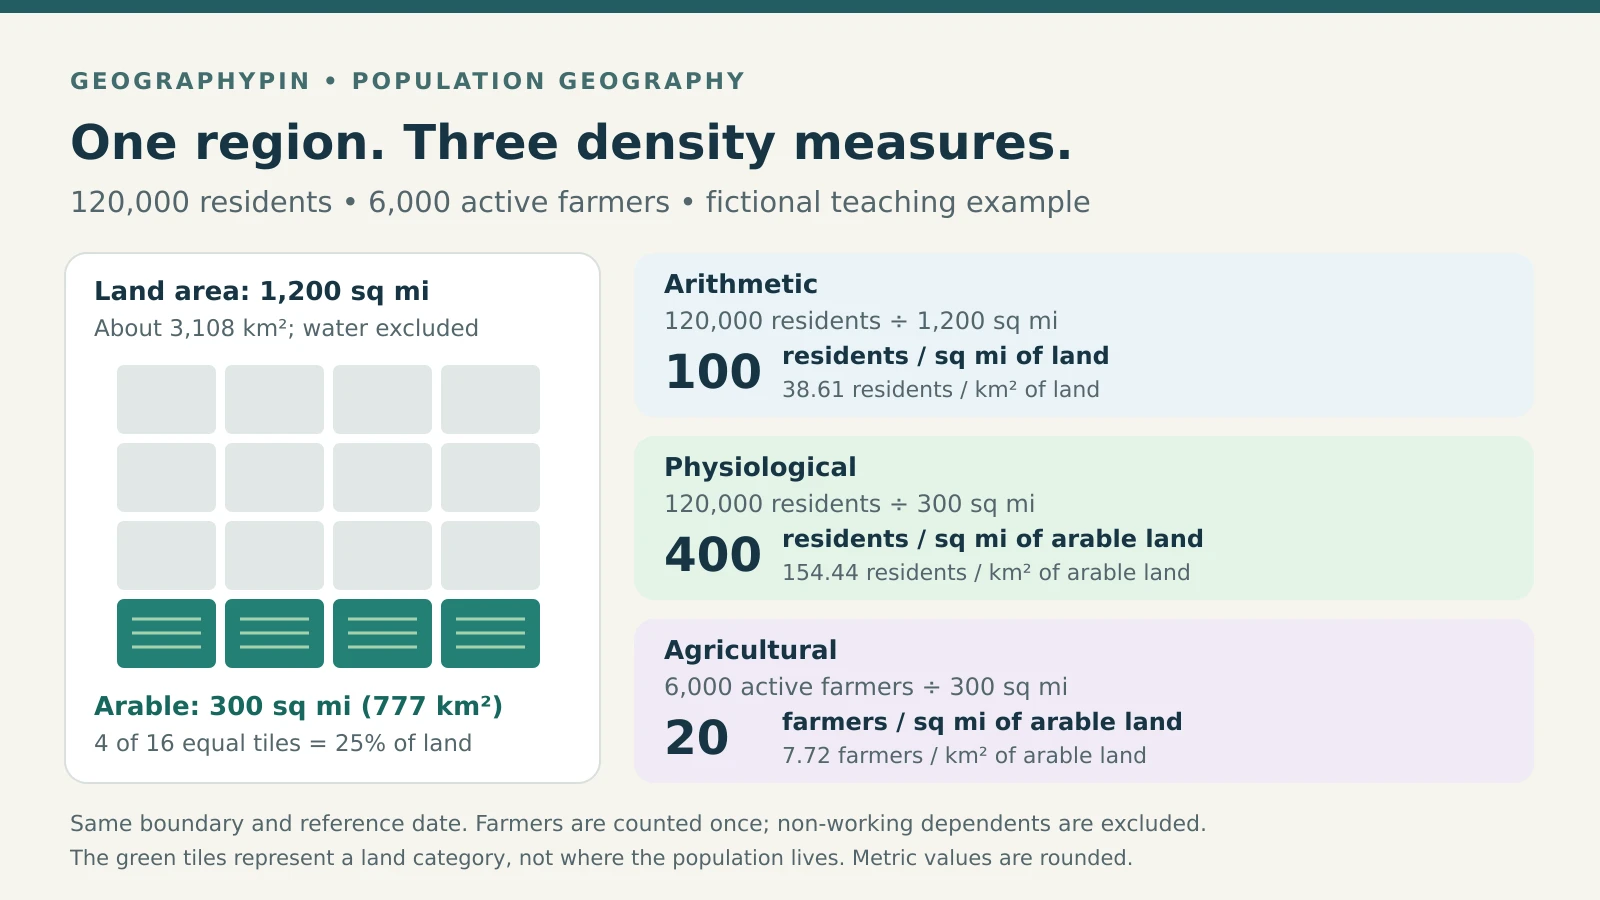
Arithmetic density divides total population by the chosen area; physiological density divides total population by arable land; agricultural density divides farmers, or a defined agricultural population, by arable land. The first describes overall concentration, while the others relate people to farmland. This worked example uses land-only area and counts active farmers, excluding their non-working dependents.
How to use this article: Check who counts as a farmer, follow the example inputs, or compare land-only and total-area results.
Compare the three formulas
Density expresses a count per unit of area, usually people per square mile or square kilometer. In human geography, it helps compare settlement patterns, but the formula must match the question.
| Measure | Calculation | What it compares |
|---|---|---|
| Arithmetic | All residents ÷ land area | Residents and the whole land area |
| Physiological | All residents ÷ arable land | Residents and crop-growing land |
| Agricultural | Active farmers ÷ arable land | Farmers and crop-growing land |
Arithmetic density is the broad average commonly labeled simply “population density.” Physiological density keeps the same population but changes the denominator, the quantity below the division line. Agricultural density changes the numerator, the count above it.
Who counts in agricultural density?
The geography text People, Places, and Cultures, hosted by Oklahoma State University, uses farmers per unit of arable land. We follow that convention: each actively farming person counts once, and non-working dependents do not count.
A broader agricultural-population series is different. For example, FAO’s archived statistical definition includes people dependent on agriculture, hunting, fishing and forestry, including non-working dependents. Do not substitute that population, rural residents, farm households or the number of farms for a farmer count without changing the label and explaining the convention.
Calculate all three for the same region
Start with one consistent set of inputs
Imagine a fictional region with 120,000 residents, including 6,000 active farmers. Its land area is 1,200 square miles (about 3,108 square kilometers), of which 300 square miles (777 square kilometers) are arable. All inputs refer to the same boundary and reference date.
Use the unrounded areas for calculations. The square-mile figures below are exact within the example; metric results are rounded to two decimal places.
| Measure | Division | Result |
|---|---|---|
| Arithmetic | 120,000 ÷ 1,200 | 100 residents/sq mi of land (38.61/km²) |
| Physiological | 120,000 ÷ 300 | 400 residents/sq mi of arable land (154.44/km²) |
| Agricultural | 6,000 ÷ 300 | 20 farmers/sq mi of arable land (7.72/km²) |

Why the answers differ
Arable land occupies one-quarter of the land area, so physiological density is four times arithmetic density. Nobody moved: only the denominator changed. Agricultural density is lower because it counts 6,000 farmers rather than all 120,000 residents.
When both measures use the same units and arable land is a positive subset of total land, physiological density cannot be lower than arithmetic density. A zero arable-area denominator makes the ratio undefined, not zero.
Check the data before comparing places
Land area is not always total area
The World Bank’s population-density indicator divides midyear population by land area, excluding inland water bodies. A source using total surface area, including inland water, can produce a lower number without either calculation being an arithmetic mistake.
Add 300 square miles (777 square kilometers) of water to the fictional region. Its total area becomes 1,500 square miles (about 3,885 square kilometers). Density over that surface is 80 residents per square mile (30.89 per square kilometer), rather than 100 over land alone. Label the denominator explicitly.
Also inspect “arable.” Textbook shorthand often means land suitable for crops, but the World Bank’s FAO-based series records specified land uses, including temporary crops and temporarily fallow land. It is not an estimate of every acre that could potentially be cultivated. Do not silently substitute all agricultural land or a harvested-area figure.
Match the population and its reference date
A census count relates to its census reference date. A later annual estimate or a multiyear survey estimate represents something different. Record the census date or estimate period, not just the webpage’s publication date, and check whether land-use data come from the same period.
Residents also differ from people present during the workday. The U.S. Census Bureau’s commuter-adjusted estimate adds workers employed in an area to its residents, then subtracts workers who live there. This accounts for work-related movement; it is not a live headcount of every visitor. Label a density based on it as commuter-adjusted rather than resident density.
Finally, population and area must cover the same territory. Do not divide a metropolitan population by city-proper land area, mix incompatible boundary years, or combine a partially enumerated population with a larger territorial area.
Understand what an average leaves out
Regional density can hide local concentration
Suppose 100,000 of our fictional residents live in a town occupying 100 square miles (259 square kilometers). That town has 1,000 residents per square mile (386.10 per square kilometer), although the whole region averages only 100. The regional figure does not describe the surroundings most residents experience.
The Census Bureau recommends attention to geographic scale when comparing density. Combining areas can conceal internal variation. To calculate density for several non-overlapping districts together, add their populations and divide by their combined area; do not simply average the district densities unless their areas are equal.
Density alone does not measure crowding or food security
Household crowding concerns how people share indoor space, often measured using occupants per room. Population per square mile cannot tell you how spacious homes are, how crowded a bus feels, or whether services meet residents’ needs.
Likewise, high physiological density identifies many residents relative to arable acreage, not an automatic food shortage. The ratio contains no information about yields, imports, diets or food distribution. Agricultural density alone cannot establish productivity either: a farmer count says nothing about output per worker or per acre. Choose additional evidence for those questions rather than treating density as a verdict.
To practice choosing denominators and interpreting demographic measures, try the population geography quiz.
What Did We Learn Today?
Read a density figure as a complete statement: which people, which area, which date and which boundary? The fictional region’s three answers are all correct under their stated definitions. Consistent inputs make the comparison useful; finer geographic detail and separate housing or agricultural evidence explain what those averages cannot.
Sources & Data Notes
All worked numbers and the diagram are fictional teaching examples, not country statistics. Metric conversions use one square mile = 2.589988110336 square kilometers. Agricultural density here counts active farmers, not dependents. Sources support definitions and methods; older examples and rankings in them are not reused.
- People, Places, and Cultures: 2.1 Population, hosted by Oklahoma State University: the three textbook measures.
- World Bank: population-density metadata and arable-land metadata: area and land-use conventions.
- FAO: Definitions and sources, agricultural population: an archived broader population definition.
- U.S. Census Bureau: Calculating Commuter-Adjusted Population Estimates.
- U.S. Census Bureau: Understanding Population Density: geographic scale and uneven settlement.
- 2022 ACS Subject Definitions: occupants per room.