A population-density map compares residents with land area, not just the number of people in each state. Consistent inputs make the state ranking meaningful.
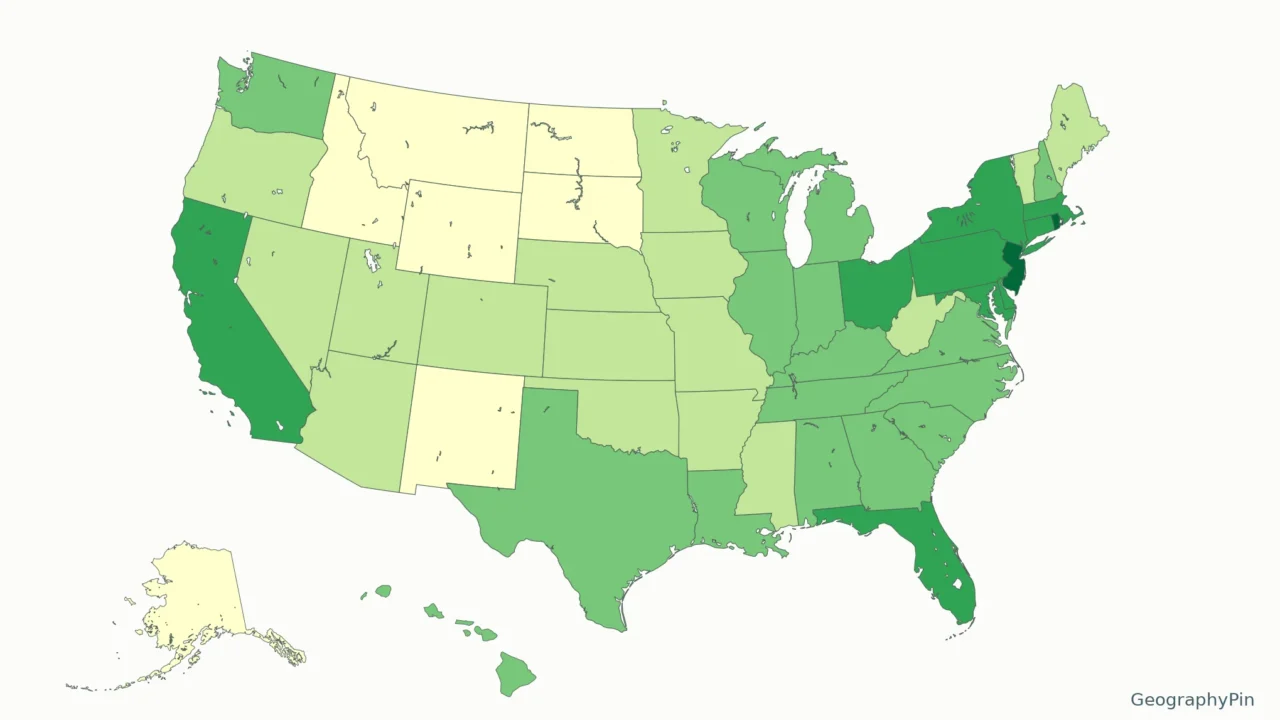
This US map uses July 1, 2025 Census resident-population estimates divided by 2025 Census land area. New Jersey ranks highest and Alaska lowest among the 50 states. Values are shown per square mile and per square kilometer; Washington, DC is listed separately because it is not a state.
How to use this article: Check the source inputs, reproduce the unit conversion, or inspect the data vintage before comparing places.
Maps fit the screen by default. Select 2× or 4× for details, swipe or scroll within the map, and choose Fit / Reset for the full view.
1. US State Density Map
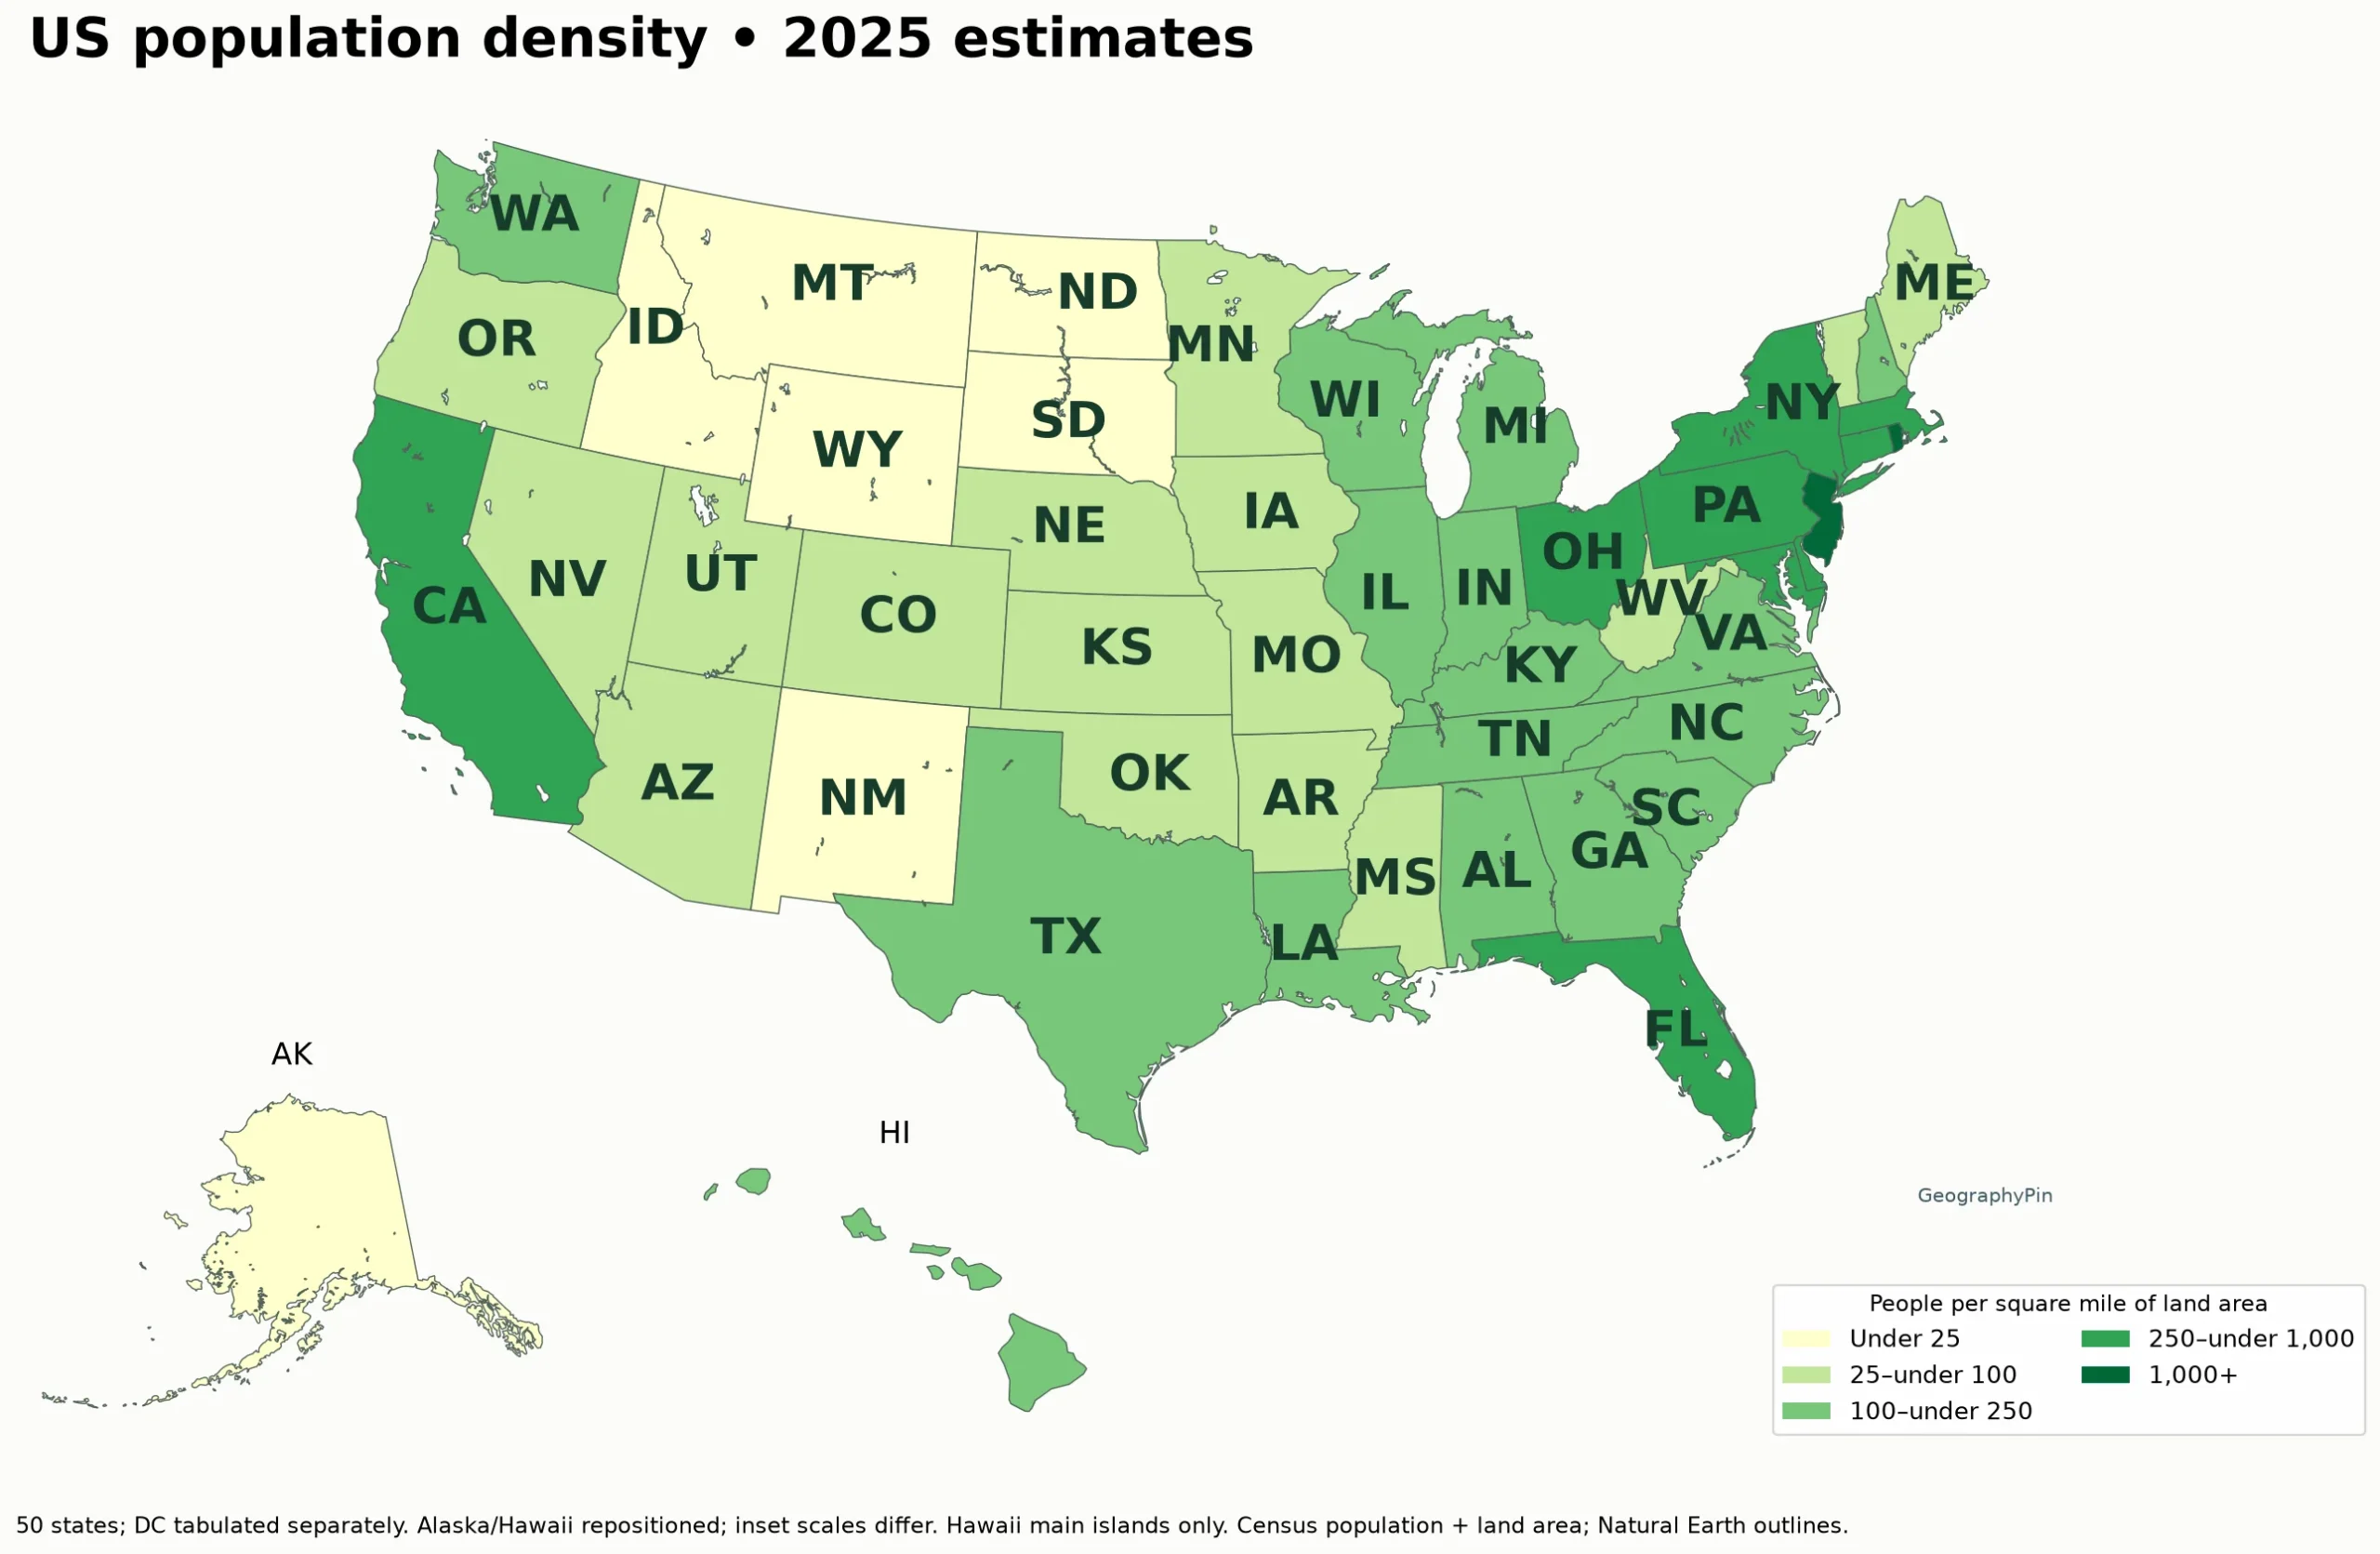
Map key: people per square mile of land
- Very light yellow: under 25
- Light green: 25 to under 100
- Medium green: 100 to under 250
- Dark green: 250 to under 1,000
- Deep green: 1,000 or more
Download all 50 states and the separate DC row. The CSV includes population, land area, density in both units and the state-only rank. The map uses the same five display classes as the world population density map, but its population source and reference year are different.
The classes are under 25; 25 to under 100; 100 to under 250; 250 to under 1,000; and 1,000 or more people per square mile. These are display bins, not official Census classifications. Use the numeric table when a precise comparison matters.
2. The Densest and Least Dense States
Under this calculation, New Jersey has the highest density among the 50 states: about 1,298.2 people per square mile (501.2 per square kilometer). Alaska has the lowest: about 1.3 per square mile (0.5 per square kilometer). Rhode Island, Massachusetts, Connecticut and Maryland follow New Jersey at the top of the state ranking.
Washington, DC is more densely populated than any state in this dataset, but it is a federal district. It appears separately in the download and below the state table, not as a 51st state or a competitor in the state ranking. Puerto Rico and other territories are outside this 50-state comparison.
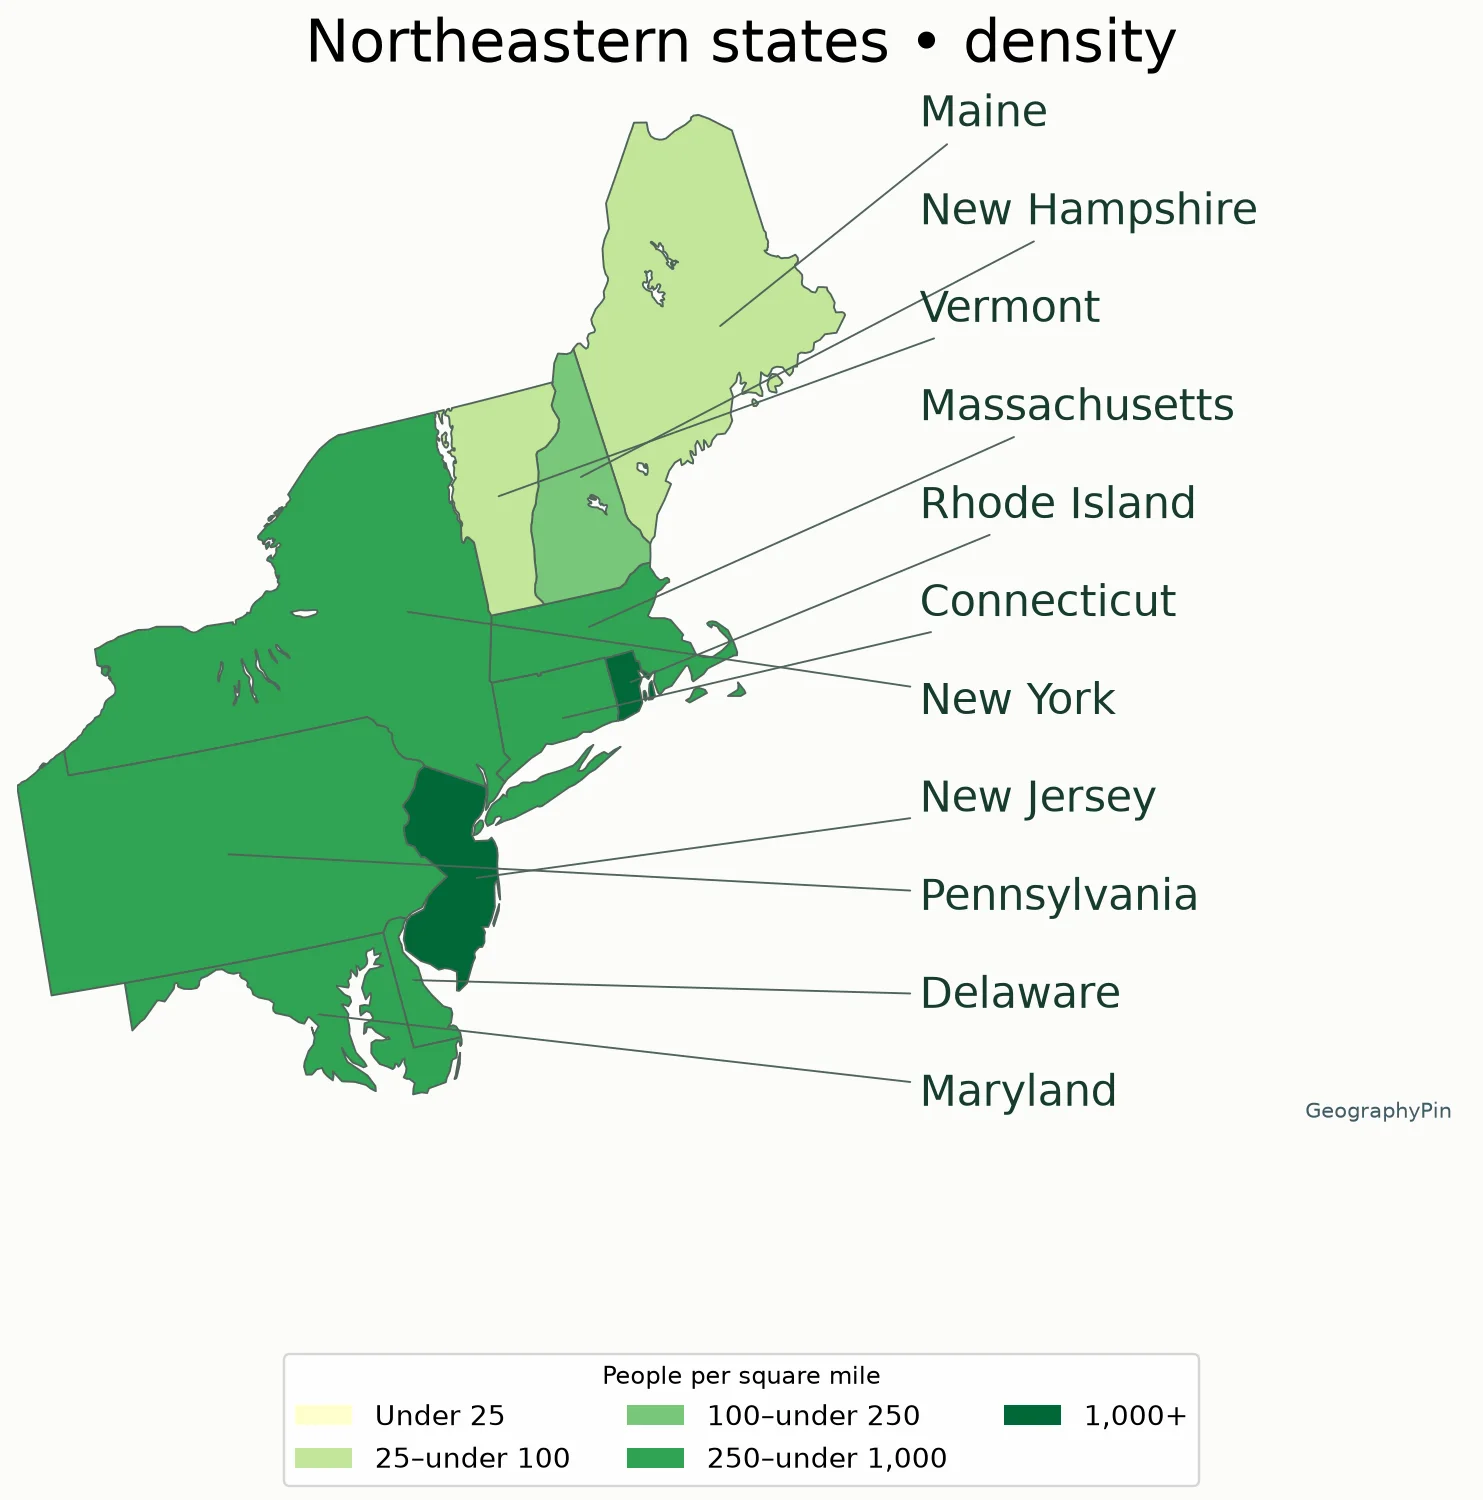
Map key: people per square mile of land
- Very light yellow: under 25
- Light green: 25 to under 100
- Medium green: 100 to under 250
- Dark green: 250 to under 1,000
- Deep green: 1,000 or more
3. All 50 States, Ranked by Density
All rows use the same July 1, 2025 population-estimate vintage and 2025 Census Gazetteer land-area source. Display values are rounded to one decimal place; ranks use unrounded calculations.
| State | Rank | People/sq mi | People/km² |
|---|---|---|---|
| New Jersey | 1 | 1,298.2 | 501.2 |
| Rhode Island | 2 | 1,078.0 | 416.2 |
| Massachusetts | 3 | 917.1 | 354.1 |
| Connecticut | 4 | 761.7 | 294.1 |
| Maryland | 5 | 645.2 | 249.1 |
| Delaware | 6 | 544.0 | 210.0 |
| Florida | 7 | 437.3 | 168.8 |
| New York | 8 | 424.5 | 163.9 |
| Pennsylvania | 9 | 291.9 | 112.7 |
| Ohio | 10 | 291.3 | 112.5 |
| California | 11 | 252.5 | 97.5 |
| North Carolina | 12 | 230.3 | 88.9 |
| Illinois | 13 | 229.1 | 88.5 |
| Virginia | 14 | 224.9 | 86.8 |
| Hawaii | 15 | 223.1 | 86.1 |
| Georgia | 16 | 195.8 | 75.6 |
| Indiana | 17 | 194.6 | 75.2 |
| South Carolina | 18 | 185.3 | 71.5 |
| Michigan | 19 | 178.9 | 69.1 |
| Tennessee | 20 | 177.4 | 68.5 |
| New Hampshire | 21 | 158.1 | 61.0 |
| Texas | 22 | 121.4 | 46.9 |
| Washington | 23 | 120.4 | 46.5 |
| Kentucky | 24 | 116.7 | 45.0 |
| Wisconsin | 25 | 110.3 | 42.6 |
| Louisiana | 26 | 106.9 | 41.3 |
| Alabama | 27 | 102.5 | 39.6 |
| Missouri | 28 | 91.2 | 35.2 |
| West Virginia | 29 | 73.5 | 28.4 |
| Minnesota | 30 | 73.2 | 28.3 |
| Vermont | 31 | 69.9 | 27.0 |
| Arizona | 32 | 67.1 | 25.9 |
| Mississippi | 33 | 63.0 | 24.3 |
| Oklahoma | 34 | 60.1 | 23.2 |
| Arkansas | 35 | 59.9 | 23.1 |
| Colorado | 36 | 58.0 | 22.4 |
| Iowa | 37 | 58.0 | 22.4 |
| Maine | 38 | 45.9 | 17.7 |
| Oregon | 39 | 44.5 | 17.2 |
| Utah | 40 | 42.8 | 16.5 |
| Kansas | 41 | 36.4 | 14.1 |
| Nevada | 42 | 29.9 | 11.5 |
| Nebraska | 43 | 26.3 | 10.1 |
| Idaho | 44 | 24.6 | 9.5 |
| New Mexico | 45 | 17.5 | 6.8 |
| South Dakota | 46 | 12.3 | 4.8 |
| North Dakota | 47 | 11.6 | 4.5 |
| Montana | 48 | 7.9 | 3.0 |
| Wyoming | 49 | 6.1 | 2.3 |
| Alaska | 50 | 1.3 | 0.5 |
District of Columbia, separately: 11,347.5 people per square mile (4,381.3 per square kilometer). Not included in the 50-state ranking.
4. How the Numbers Were Calculated
Source inputs
The numerator is POPESTIMATE2025 from the Census Bureau’s Vintage 2025 state population estimates. The denominator is ALAND from the 2025 Gazetteer state file, recorded in square meters. Water area is excluded. Population and area rows are joined using state FIPS identifiers, not approximate name matches.
Unit conversion
For each state, land area in square kilometers equals ALAND divided by 1,000,000. Land area in square miles equals ALAND divided by 2,589,988.110336. Divide the resident population estimate by the relevant land area. The downloadable CSV retains the unrounded calculations so the displayed values can be reproduced.
Data vintage and interpretation
For example, New Jersey’s 9,548,215 estimated residents divided by about 7,355.031 square miles of land gives about 1,298.188 people per square mile. Rounding that result to one decimal gives 1,298.2. The map’s polygon area is not used in this calculation.
Population-estimate vintages can revise earlier years. Gazetteer area files can also change with boundary corrections and improved measurements. Comparisons with an older source may differ even when both use the label 2025. Keep the population vintage and land-area edition attached to the result, rather than assuming every density table has the same inputs.
5. What a State Average Hides
A state average spreads residents over all counted land. It does not describe the density of every town, suburb or rural area. Alaska’s low average does not mean its settlements are evenly scattered. A densely populated state can still include forests, farmland and sparsely settled places.
Map size can also distort a quick impression. Alaska is geographically large but shown as a smaller inset. Small northeastern states can be difficult to see on a national map, so the regional detail and ranked table are essential companions. Neither a large shape nor a dark shade directly tells you total population.
For local comparisons, use Census tracts, counties or places with a consistent source and boundary date. Do not interpret these statewide values as a measure of crowding, housing affordability or environmental pressure without additional evidence.
For the underlying concept and common denominator mistakes, see our population density explainer.
What Did We Learn Today?
New Jersey is the densest state and Alaska the least dense under this 2025 land-area calculation. DC is reported separately. The ranking depends on resident population divided by land area, with one consistent population vintage and a documented area source.
Sources & Data Notes
Natural Earth lake surfaces are removed from the state display polygons so the Great Lakes are not colored as populated land and Michigan’s peninsulas remain distinct. This affects only the picture, not the Census ALAND denominator or calculated densities. Generalized shorelines can differ slightly.
Census sources: Vintage 2025 NST-EST2025-ALLDATA population file and 2025 Gazetteer state ALAND. Data downloaded November 11, 2026. Estimates refer to July 1, 2025; they are not 2026 population observations. Natural Earth 1:50 million state boundaries are generalized and used only for display. Main map EPSG: 5070; Alaska EPSG: 3338; Hawaii EPSG: 3759. Insets are repositioned and not at one shared scale. Calculations use official statistical land area, not geometry measurements.