A population pyramid can look like a triangle, a column, or a lopsided stack. Reading the labels before naming the shape prevents the biggest mistakes, especially confusing a percentage with a headcount or treating a snapshot as a forecast.
To read a population pyramid, find an age group on the vertical axis, then read each bar outward from the center against the horizontal scale. Check whether the bars show counts or percentages and what the percentages divide by. Compare groups and sides, but use additional evidence before explaining a bulge or predicting change.
How to use this article: Check the top age band, calculate one row, resolve the percentage denominator, or follow a cohort across time.
1. Check the labels before the shape
A population pyramid, also called an age-sex pyramid, is a pair of horizontal bar charts showing a population’s age distribution by sex. It is one of the tools used in human geography to describe who lives in a place.
The U.S. Census Bureau’s explanation places younger ages at the bottom, older ages at the top, males on the left, and females on the right. Those are common conventions, not a substitute for reading the legend.
- Place and date: Which population is included, and when was it measured or estimated?
- Horizontal units: People, thousands of people, or a percentage?
- Age bands: Single years, five-year groups, or broader categories?
- Data status: Census count, survey estimate, demographic estimate, or projection?
The two sides describe the source’s sex categories, not all gender identities. For example, the 2020 U.S. Census age-and-sex report states that its sex question offered male and female responses and did not collect gender data. Check the documentation for the particular dataset you use.
Treat the top age band differently
A row labeled 80+ means everyone aged 80 and older, not just ages 80–84. Its bar aggregates an open-ended interval even if it is drawn at the same height as a five-year row. Do not interpret an unusually wide top bar as a sudden increase in one five-year cohort.
2. Read a worked example
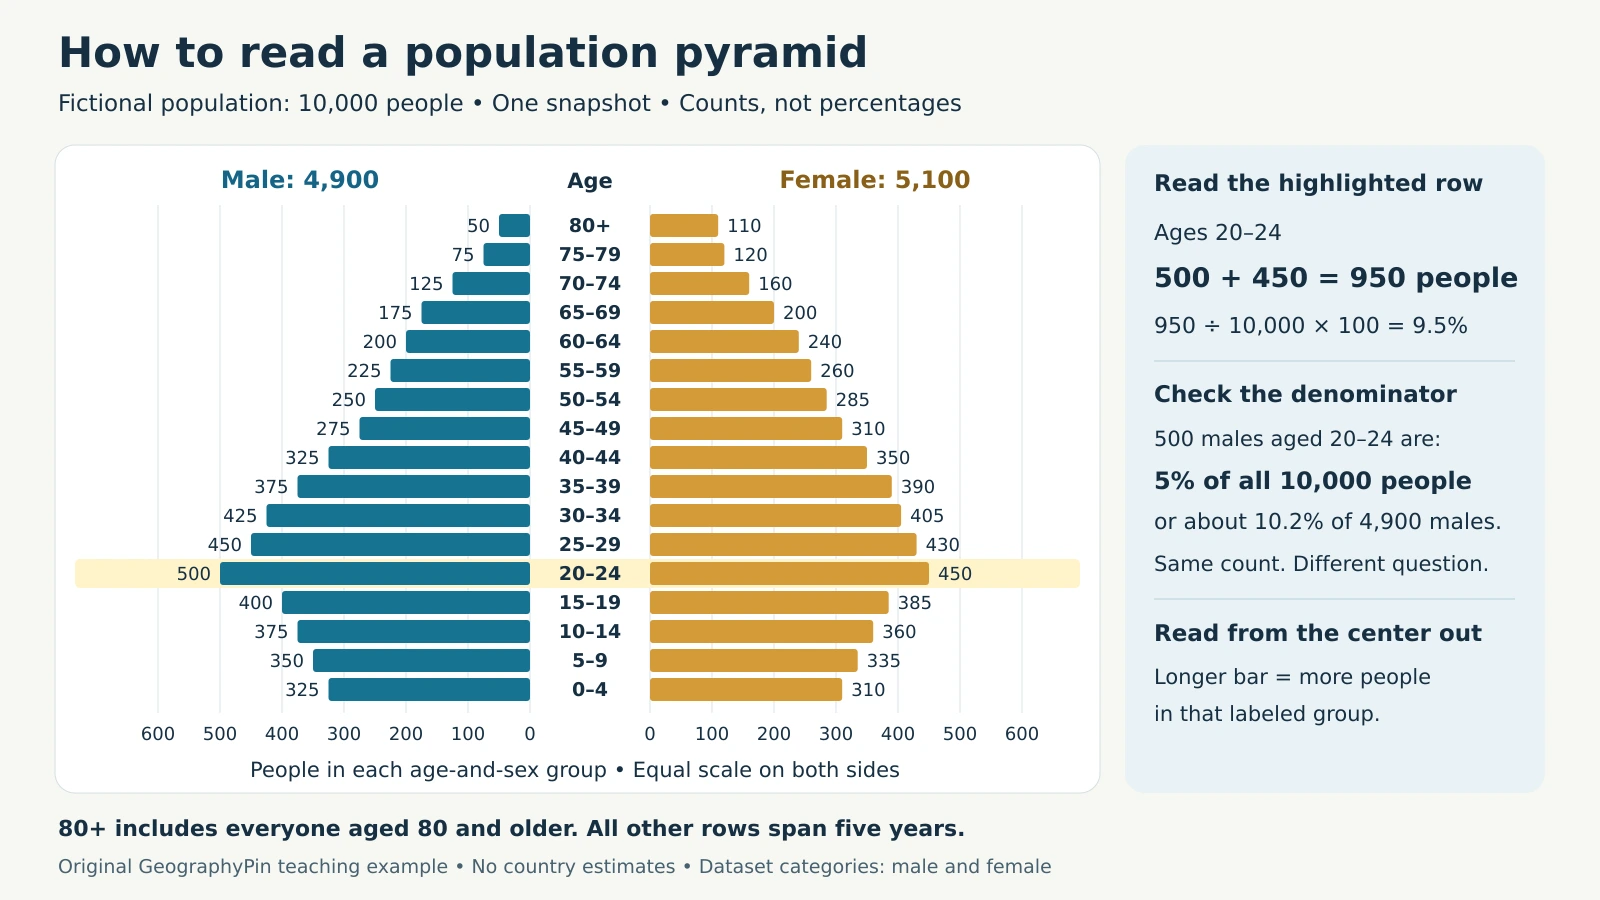
This original teaching example contains exactly 10,000 fictional people: 4,900 recorded as male and 5,100 as female. It represents one illustrative snapshot, not a real country, census, or forecast. The horizontal scale counts people, with identical units on both sides.

Download the fictional population-pyramid data (CSV). Fields include age limits, counts by sex, combined counts, and percentages of all 10,000 people. A blank upper limit identifies the 80+ group.
Read ages 20–24 from the center outward
The male bar reaches 500; the female bar reaches 450. Add them to find the entire age group: 500 + 450 = 950 people. Divide by the total population to express that group as a share: 950 ÷ 10,000 × 100 = 9.5%.
The male bar alone represents 5% of the whole population, and the female bar represents 4.5%. These percentages can be added because they share the same denominator. Some chart software displays negative numbers on the left to create the mirrored layout; those do not mean negative people.
| Age group | Male | Female | Total |
|---|---|---|---|
| 0–4 | 325 | 310 | 635 |
| 5–9 | 350 | 335 | 685 |
| 10–14 | 375 | 360 | 735 |
| 15–19 | 400 | 385 | 785 |
| 20–24 | 500 | 450 | 950 |
| 25–29 | 450 | 430 | 880 |
| 30–34 | 425 | 405 | 830 |
| 35–39 | 375 | 390 | 765 |
| 40–44 | 325 | 350 | 675 |
| 45–49 | 275 | 310 | 585 |
| 50–54 | 250 | 285 | 535 |
| 55–59 | 225 | 260 | 485 |
| 60–64 | 200 | 240 | 440 |
| 65–69 | 175 | 200 | 375 |
| 70–74 | 125 | 160 | 285 |
| 75–79 | 75 | 120 | 195 |
| 80+ | 50 | 110 | 160 |
| All ages | 4,900 | 5,100 | 10,000 |
Text equivalent: Ages 20–24 form the largest combined group, with 950 people. Ages 0–4 total 635, and ages 80+ total 160. Female counts exceed male counts from ages 35–39 upward in this fictional example; the table supplies every value represented in the chart.
To calculate the under-15 population, add the first three totals: 635 + 685 + 735 = 2,055, or 20.55%. The 15–19 band is excluded because under 15 means ages 0 through 14. Always match the requested age boundary to the available rows.
3. Check what each percentage divides by
Percentages make it easier to compare age structures across populations of different sizes. They do not show population size by themselves. A group containing 8% of 50,000 people has 4,000 members; a group containing 6% of 200,000 has 12,000.
Percent of everyone or percent of one sex?
The Census Bureau’s Population Analysis with Microcomputers describes both percentage conventions. A chart may divide each bar by the population of both sexes combined, or divide each side by that sex’s own total.
- Whole-population denominator: The example’s 500 males aged 20–24 are 500 ÷ 10,000 × 100 = 5%.
- Male-only denominator: The same 500 people are 500 ÷ 4,900 × 100 ≈ 10.2% of all males.
With the first convention, every bar on both sides together sums to 100%, apart from rounding. Here the male side totals 49% and the female side 51%. With the second, each side separately totals 100%; adding the two sides gives 200%, not a combined population share.
Do not add male-only and female-only percentages to calculate an age group’s share of everyone. Use counts or first convert both values to a common denominator. Also check the axis limits before comparing two charts: automatic rescaling can make a smaller group look just as wide.
4. Interpret shapes without jumping to conclusions
Names such as expansive, stationary, and constrictive are useful classroom shorthand for broad shapes. They are not complete diagnoses of fertility, economic development, or future growth.
- Broad base: Younger groups are relatively numerous. Birth history, survival, and migration help explain why.
- Roughly column-shaped: Several successive age groups are similar in size. This alone does not prove zero growth or a technically stationary population.
- Narrow base: Recent child cohorts are smaller than some older groups. That does not establish that the total population is already shrinking.
A bulge in the middle might reflect a larger birth cohort, age-selective immigration, or several processes together. A notch might reflect fewer births in that cohort’s birth years, deaths, emigration, or problems in the data. The University of Wisconsin–Madison’s Applied Population Laboratory overview illustrates how migration and past birth patterns can leave recognizable features.
First describe what you see, then investigate the cause. In our example, ages 20–24 are larger than either adjacent group. Nothing in the invented values establishes whether a college, employment migration, or earlier births produced that difference.
Nor is the 0–4 bar an annual birth rate: it contains surviving resident children across five ages, including children who may have moved. A thin upper section is not a direct measure of life expectancy. Different birth-cohort sizes, migration, and mortality all affect the people present.
5. Compare cohorts and future scenarios
Follow birth cohorts, not a fixed row
A birth cohort is a group born during the same period. Five years after the example’s snapshot, surviving people who were aged 20–24 will be aged 25–29. Comparing ages 20–24 at both dates instead compares different birth cohorts.
Even an age-aligned comparison does not track the same named individuals. People die, arrive, and leave; changes in boundaries, coverage, or methods can also affect the total. A larger 25–29 group five years later does not mean the original 950 people somehow multiplied within their cohort.
Treat the future as conditional
Age structure helps planners anticipate changing needs, but a pyramid alone cannot tell them exactly how many school places or jobs will be needed. Those decisions also require migration, participation, and local service information.
The UN’s World Population Prospects 2024 methodology projects population using assumptions about fertility, mortality, and migration, with scenarios and uncertainty estimates. A future pyramid visualizes an assumed demographic path; it is not a guaranteed outcome implied by today’s silhouette.
6. Write a defensible interpretation
A useful interpretation separates observation from explanation. For this example, you could write:
“In this fictional population of 10,000, ages 20–24 are the largest age group at 950 people, or 9.5%. Children under 15 account for 20.55%. The chart describes one snapshot and does not establish why the young-adult group is larger or how the population will change.”
Before making a real-world comparison, check that dates, boundaries, age bands, category definitions, percentage denominators, and axis scales are compatible. Keep counts and shares distinct, and investigate missing values or unusual jumps in the source notes.
For further practice with population measures and migration, try the population geography quiz.
What Did We Learn Today?
A sound reading starts with the labels and one row, then builds toward a comparison. Shared denominators make percentages additive; open-ended age bands need special care. Cohorts move through age groups, while migration and deaths change their membership. Shapes suggest questions to investigate, and future pyramids depend on assumptions.
Sources & Data Notes
The chart and table use original fictional counts, not national statistics. All percentage calculations use 10,000 people unless a sex-specific denominator is stated. Counts and whole-population shares are exact; the 10.2% male-only share is rounded. The 80+ interval has no upper age limit. The sources below support the reading conventions and methodological cautions.
- U.S. Census Bureau: New Census Bureau Visualization Shows Broad Variations in Age Structure By State and County
- U.S. Census Bureau: Population Analysis with Microcomputers, Volume I, especially “Graphing Population Age Structures.”
- U.S. Census Bureau: Age and Sex Composition: 2020
- UW Applied Population Lab: What Population Pyramids Reveal About The Past, Present And Future
- United Nations: World Population Prospects 2024 methodology report