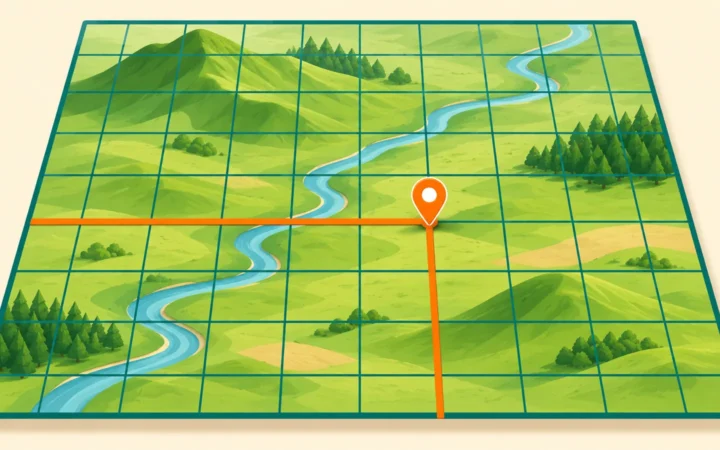
A map can show where a park is. A geographic information system can combine that park with paths, entrances and other information to investigate a more useful question: which places can reach it, and under what assumptions?
GIS stands for geographic information system. It combines location-based data with tools for storing, checking, analyzing and displaying that information. A map is one possible result. The broader system connects shapes and coordinates to descriptive records, allowing questions about proximity, patterns and relationships that a static picture alone cannot answer.
How to use this article: You can connect a layer to its records, follow the park example, or check the evidence behind a result.
GIS Connects Where With What
The geographic part tells you where something is. The information part describes it: a road’s name, a stream’s monitoring record or the date a building was surveyed. The system keeps those pieces connected so that a location can be examined alongside its characteristics.
The U.S. Geological Survey’s GIS explanation emphasizes analysis and display of geographically referenced information. This means GIS is useful for asking questions, not simply decorating a map.
A working GIS also involves choices made by people: what to collect, how to classify it, which method to run and how to communicate the result. Software alone does not settle those questions. Massachusetts’ GIS overview explicitly includes hardware, software, data and staff.
The same general approach serves human and physical geography. Analysts can investigate settlement patterns, transport networks, vegetation, terrain or water systems, provided the observations and methods fit the question.
Layers Organize Different Kinds of Evidence
A feature has geometry and descriptive records
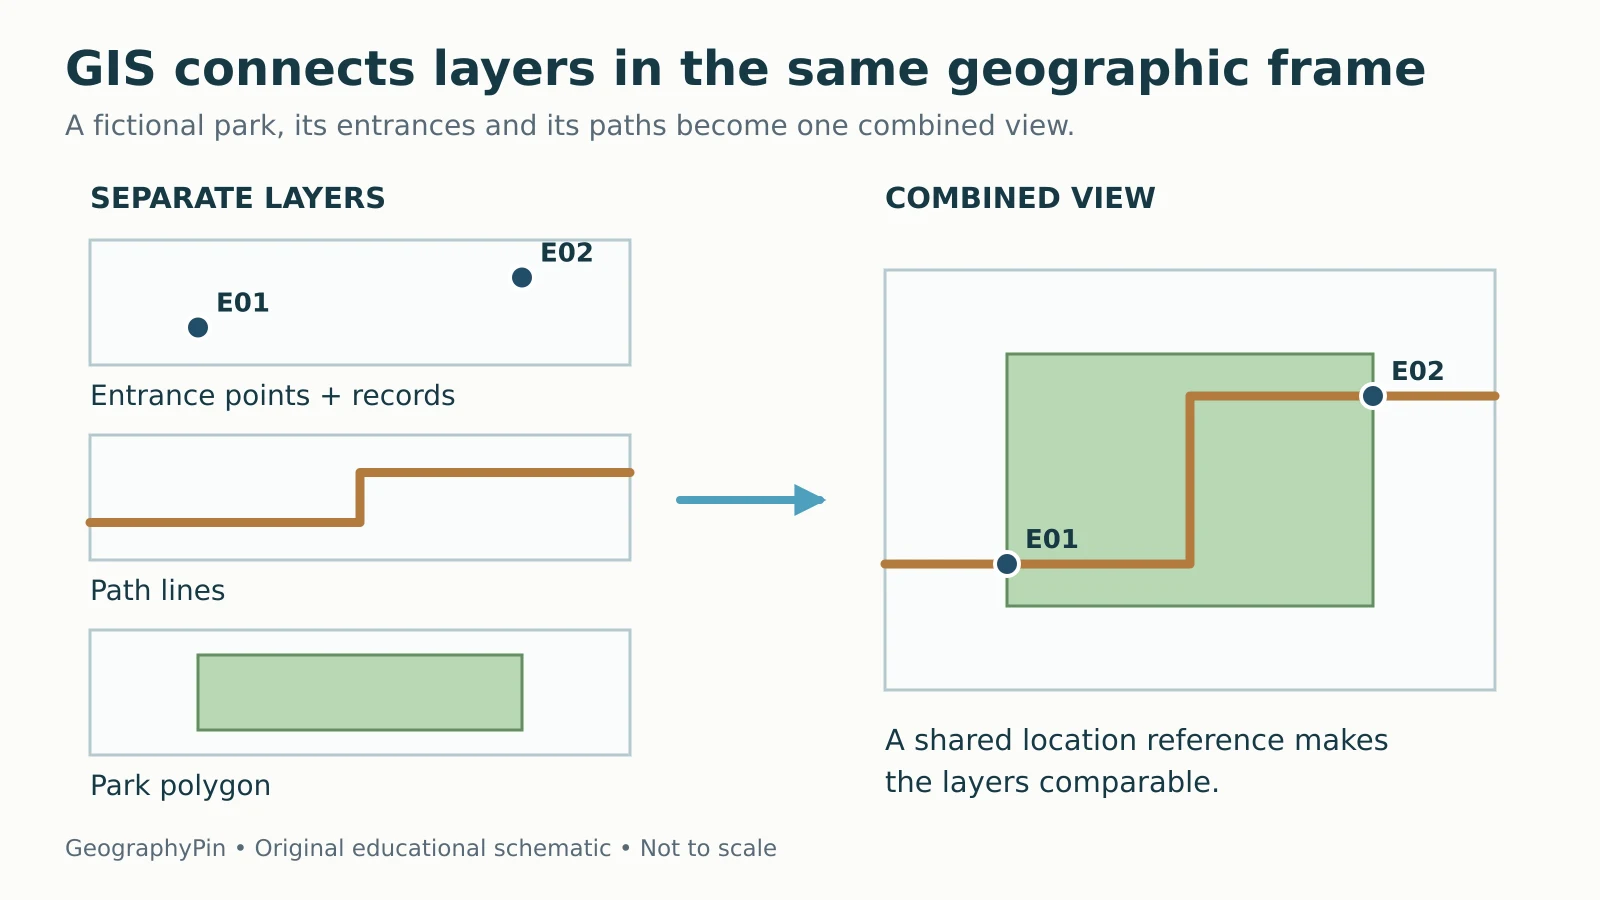
A vector layer represents features with points, lines or polygons. A park entrance might be a point, a footpath a line and the park boundary a polygon. Each feature can have attributes, such as an identifier, name or recorded access condition.
A separate table can be linked through a shared identifier. Joining records requires a reliable match: similar-looking names or incomplete addresses can connect the wrong information. Location alone does not tell you when a feature was last checked.
| Entrance ID | Geometry | Recorded access | Inspection date |
|---|---|---|---|
| E01 | Point location | Public entrance | 2026-05-01 (fictional) |
| E02 | Point location | Service access only | 2026-05-01 (fictional) |
These invented records show how two identical-looking point symbols can represent different access conditions.

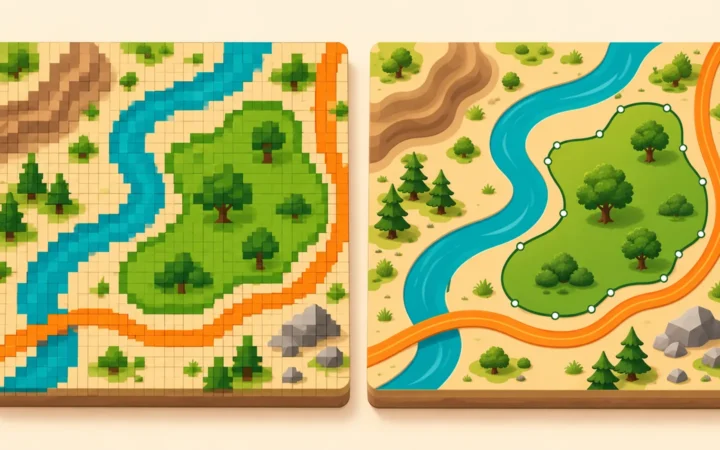
A raster layer instead stores values in a grid of cells. Aerial imagery and gridded elevation are common examples. A project can use both raster and vector data. QGIS’s introductory guide explains these two broad representations.
From a Question to an Analysis
A simple park-access workflow
Consider a fictional town asking which locations lie within a quarter mile of a public park entrance. First define the distance: a straight-line radius and a walk along available paths answer different questions. A quarter mile is 1,320 feet, about 402 meters.
A straight-line analysis can draw a buffer around each eligible entrance and find locations inside it. QGIS’s buffering lesson describes this general operation: defining an area within a chosen distance of a feature.
| Step | Decision or operation | Why it matters |
|---|---|---|
| Define | Public entrance; quarter-mile straight-line distance | Sets the meaning of the answer |
| Collect | Entrance points and locations to test | Provides the necessary observations |
| Check | Dates, access attributes, coordinates and units | Avoids combining incompatible evidence |
| Analyze | Buffer eligible entrances and select locations inside | Applies the stated rule consistently |
| Review | Inspect borderline and unexpected results | Catches data or method problems |
| Communicate | Map the result and state its assumptions | Lets others interpret and repeat it |
This result does not establish that someone can walk to the park in a given time. A river, fence, inaccessible gate or missing bridge may block a direct route. A walking-access study needs a suitable path network, allowed connections and a travel model. The entrance must also be usable at the relevant time.
Neither study is automatically “the correct map.” Each answers its own defined question. GIS makes the operation repeatable; the analyst still has to choose a defensible question.
Coordinates Let Layers Line Up
To combine layers correctly, their positions must be interpreted in the right coordinate reference systems, or CRSs. A pair of numbers is not self-explanatory. Latitude and longitude use angles, while many projected systems use linear coordinates such as meters.
GIS software can often display layers from different CRSs together by transforming coordinates. That requires the source information to be correct. Assigning a new CRS label to wrongly interpreted numbers is not the same operation as transforming correctly identified coordinates.
Measurement also needs a suitable method. A distance calculated as if longitude and latitude degrees were ordinary feet or meters is not a valid local distance calculation. The projection or geodesic method, units and region must fit the task. QGIS’s CRS introduction explains why reference systems and projections matter.
Start with GeographyPin’s coordinate-reading guide if these formats are unfamiliar. The map-projection explanation shows why flattening Earth always involves choices about distortion.
GIS, GPS and a Finished Map Are Different Things
| Term | Main role | Example |
|---|---|---|
| GIS | Organizes and analyzes geographically referenced data | Compare entrances with nearby locations |
| GPS | Provides positioning, navigation and timing signals | Help a receiver estimate a recorded position |
| Remote sensing | Observes something without direct physical contact | Collect imagery from an aircraft or satellite |
| Map | Communicates selected geographic information | Show the resulting access areas |
These can work together. A field receiver may use GPS signals to help collect locations. Remote sensing may provide imagery, and GIS can combine the information into a map. None is a synonym for the others.
A screenshot of a map is also different from the underlying GIS dataset. It may show symbols without the feature records, coordinate information or analysis settings needed to reproduce the result. Conversely, a useful GIS output can be a table or a set of selected records rather than a picture.
NOAA’s GIS overview gives real applications including oil-spill trajectories, historic hurricane tracks and coastal planning. Those applications involve data and scientific methods beyond the software’s ability to draw them.
What Makes a GIS Result Trustworthy?
Check the inputs and the assumptions
A polished map can still contain old, incomplete or misclassified data. Check the source, collection date, geographic coverage, resolution or scale, coordinate reference and known limitations. Metadata is the description that should explain these characteristics and how the data were produced.
Then check the analysis. Which features were included? How were missing values handled? Which distance rule, classification or time period was used? A result that changes sharply after a small assumption change needs that sensitivity explained.
Spatial overlap also does not establish cause. Two patterns can coincide because of other influences, shared reporting practices or the way areas were grouped. GIS helps reveal a relationship; it does not by itself prove why that relationship exists.
For sensitive location data, collection and sharing choices matter too. A public summary often does not need identifiable household points or individual movement histories. Use only the detail the legitimate task requires and follow the dataset’s access and reuse conditions.
A good first project therefore ends with more than a colorful map: it includes the question, data sources, method, limitations and a clear explanation of the result. Test the core terms afterward with the GeographyPin GIS quiz.
What Did We Learn Today?
GIS connects locations, descriptive records and analysis methods. Layers make different observations comparable, while coordinates and metadata explain how those observations should be interpreted. The park example shows the central discipline: define the question, choose a matching operation and communicate what the result establishes, without turning a straight-line buffer into a promise about real-world access.
Sources & Data Notes
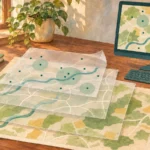
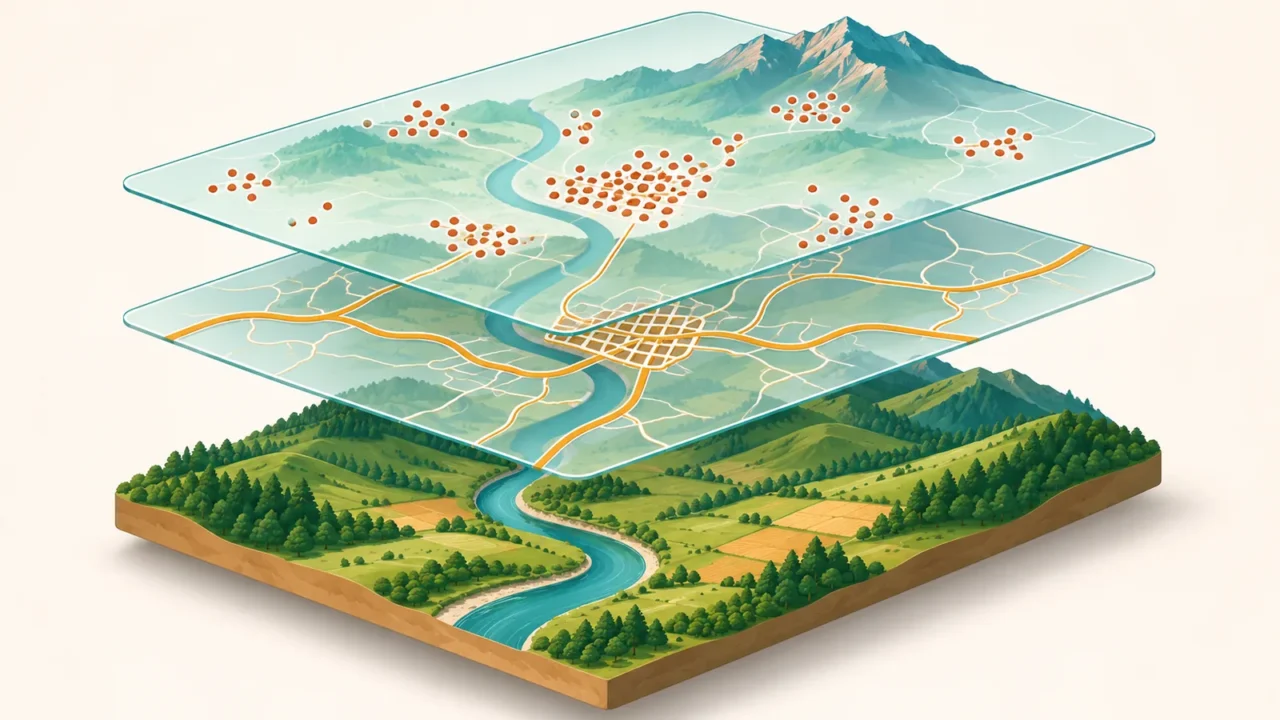
The park, entrances and records are fictional teaching examples, not observations about a real community. The quarter-mile conversion is rounded to about 402 meters. Sources describe general GIS concepts rather than a software-version-specific click sequence. The layer diagram is original and not to scale.
- USGS: What is a geographic information system?
- Massachusetts government: What is GIS?
- QGIS documentation: Introducing GIS
- QGIS documentation: Vector Spatial Analysis, Buffers
- QGIS documentation: Coordinate Reference Systems
- NOAA: What is a geographic information system?
- GPS.gov: Global Positioning System
- NOAA: What is remote sensing?