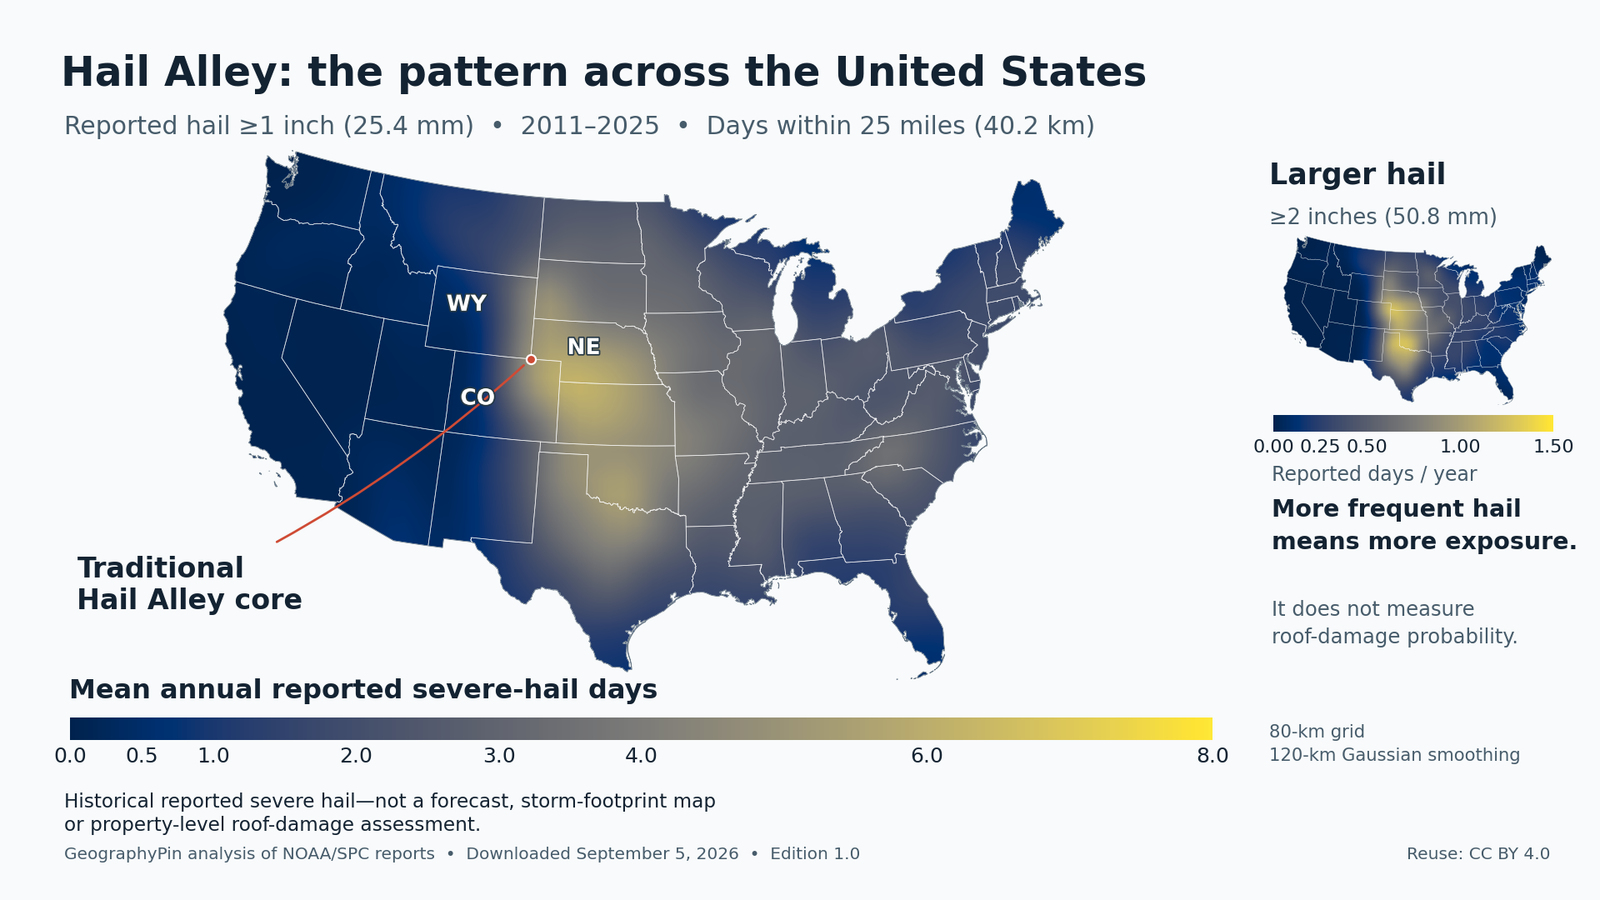
Hail Alley is an informal U.S. hail hotspot traditionally centered near the Colorado–Nebraska–Wyoming junction. It has no universally accepted border. Maps counting reported severe hail can show a broader maximum across the central and southern Great Plains; the location of that maximum depends on hail size, time period and counting method.
Hail Alley Map and Downloads
Map at a Glance
- Traditional core: Colorado–Nebraska–Wyoming High Plains.
- Broader frequent-hail region: portions of the Great Plains and Front Range.
- Main threshold: reported hail at least 1 inch (25.4 mm) across.
- Period: 2011–2025, a 15-year historical analysis.
- Metric: mean annual reported severe-hail days within 25 miles (40.2 kilometers).
- Scope: the 48 contiguous states and Washington, DC.
- Limit: historical reports, not a forecast or property-level roof-risk score.
Download the map and data
- High-resolution map: PNG
- Print-ready map: PDF
- Complete state summary: CSV
- Complete grid, including raw and smoothed values: CSV
- Methodology, field definitions and checksums
Reuse: the GeographyPin maps and derived data are available under CC BY 4.0, including editorial and educational use. Credit GeographyPin analysis of NOAA/SPC reports, link to this article and the license, and identify changes. Preserve the data period and disclaimer with reproduced maps so their meaning remains clear; do not imply endorsement.
Historical reported severe hail—not a forecast, storm-footprint map or property-level roof-damage assessment. A colored area shows the neighborhood-scale reporting pattern, not the precise path of hail across every building.
How to use this article: Check what the state values mean, compare regional peak months, inspect the counting method, or review safe checks after a hailstorm.
Where Is Hail Alley?
The traditional core lies on the High Plains around northeastern Colorado, southeastern Wyoming and western Nebraska. Think of the country near their shared junction, rather than every part of those three states. Mountain ranges, plains and cities within a single state can have very different hail histories.
University of Illinois Extension’s hail explanation uses this three-state junction and cites approximately seven to nine hail days annually. That familiar regional figure is not directly comparable with this map: it does not establish the same size threshold, 15-year period, observation radius or processing method. It should not be used to verify an individual grid value.
Broader uses of “Hail Alley” extend south and east through portions of the Plains, including Kansas, Oklahoma and Texas. Those areas matter especially when the question concerns severe or very large hail. Texas is part of the broader severe-hail belt, but it is outside the traditional three-state core.
There is no single official Hail Alley state list or surveyed perimeter. It is a statistical region rather than a legal boundary. This map therefore shows a continuous frequency surface and labels the traditional core without drawing an authoritative-looking polygon.
Hail Alley and Tornado Alley overlap, but measure different hazards
Both names describe informal hazard regions. Hail Alley concerns falling ice from thunderstorms; Tornado Alley concerns rotating columns of air reaching the ground. Their geographic patterns overlap in places, but a thunderstorm can produce severe hail without producing a tornado. A tornado map cannot substitute for a hail-frequency map.
What Does “Most Hail” Mean?
“Which state gets the most hail?” has several defensible answers because hail frequency, size and damage are different measurements. This article uses reported hail days near fixed grid points, not unadjusted state report totals.
| Measurement | What it counts | Main distinction |
|---|---|---|
| Any-size hail days | Days with hail, including small stones | Not measured by the main map |
| Severe-hail days | Dates with reported hail at least 1 inch | Main GeographyPin layer |
| Significant-hail days | Dates with reported hail at least 2 inches | A subset indicating larger hail |
| Individual reports | Separate observations | One storm can produce many |
| Unique storm days | Distinct dates in a defined area | Several storms on one date may count once |
| Claims, damage or losses | Building impacts or financial outcomes | Also depend on what was exposed and its vulnerability |
Here, “unique days” means deduplicated calendar dates at each grid point. It does not identify and count separate storm systems. Ten nearby reports on one date contribute one hail day; reports on ten separate dates can contribute ten.
Hail sizes and the two map thresholds
The NWS increased its severe-hail criterion from 0.75 inch to 1 inch in 2010. The first complete calendar year after that transition is 2011. NWS object comparisons help describe size, but an actual diameter measurement is more precise.
| Reference | Diameter | Use in this analysis |
|---|---|---|
| Pea | 0.25 inch (6.4 mm) | Below both thresholds |
| Penny | 0.75 inch (19.1 mm) | Former severe threshold; excluded |
| Quarter | 1 inch (25.4 mm) | Current severe threshold; main layer |
| Golf ball | 1.75 inches (44.5 mm) | Included in severe layer |
| Hen egg | 2 inches (50.8 mm) | Significant-hail threshold; both layers |
| Baseball | 2.75 inches (69.9 mm) | Included in both layers |
The 1-inch criterion is a warning and reporting definition, not the diameter at which every roof begins to suffer damage. The 2-inch layer also records hail occurrence, not confirmed building damage.
Severe-Hail Frequency by State
Kansas leads this edition’s area-weighted state comparison at 5.54 reported severe-hail days per year, followed by Nebraska at 5.35 and Oklahoma at 4.67. Those numbers describe sampled neighborhoods averaged across each state, using hail at least 1 inch within a projected 25-mile radius. They do not count every hailstorm anywhere in the state.
How to read the state values
The mean weights each grid cell by its mapped area inside the state. The local maximum is the highest unsmoothed value among cells intersecting that state; it is not the statewide experience. Significant-hail means use the same method with the 2-inch threshold. All values are annual averages for 2011–2025.
Values are rounded to two decimals; calculations and sorting use unrounded values. Positive values too small to round to 0.01 are shown as “<0.01”; 0.00 means no qualifying days at the sampled points. Peak months come from unrounded, area-weighted monthly hail-day values, with exact ties retained. Washington, DC intersects only one grid square, whose center is outside the District. Its value is included for completeness and must not be read as a DC-specific hail measurement.
| State or DC | Mean ≥1 inch | Local max ≥1 inch | Mean ≥2 inches | Peak month |
|---|---|---|---|---|
| Alabama | 1.97 | 3.67 | 0.23 | March |
| Arizona | 0.32 | 1.93 | 0.01 | September |
| Arkansas | 3.16 | 5.73 | 0.42 | April |
| California | 0.09 | 0.47 | <0.01 | August |
| Colorado | 2.29 | 9.47 | 0.41 | June |
| Connecticut | 1.94 | 2.33 | 0.12 | June |
| Delaware | 1.44 | 3.27 | 0.06 | August |
| District of Columbia | 4.53 | 4.53 | 0.27 | June |
| Florida | 1.17 | 3.73 | 0.07 | May |
| Georgia | 2.01 | 4.67 | 0.11 | June |
| Idaho | 0.28 | 1.13 | 0.01 | June |
| Illinois | 3.21 | 7.73 | 0.41 | May |
| Indiana | 2.87 | 4.40 | 0.34 | May |
| Iowa | 3.57 | 7.00 | 0.48 | June |
| Kansas | 5.54 | 8.40 | 1.01 | May |
| Kentucky | 2.51 | 4.40 | 0.31 | May |
| Louisiana | 1.91 | 3.73 | 0.19 | April |
| Maine | 0.79 | 2.93 | 0.04 | July |
| Maryland | 2.33 | 4.53 | 0.15 | June |
| Massachusetts | 1.78 | 2.93 | 0.14 | June |
| Michigan | 1.12 | 2.67 | 0.13 | July |
| Minnesota | 2.55 | 4.47 | 0.40 | July |
| Mississippi | 2.84 | 5.60 | 0.30 | April |
| Missouri | 3.64 | 7.73 | 0.55 | May |
| Montana | 1.27 | 3.60 | 0.16 | July |
| Nebraska | 5.35 | 8.07 | 0.97 | June |
| Nevada | 0.06 | 0.67 | <0.01 | July |
| New Hampshire | 2.17 | 2.93 | 0.08 | July |
| New Jersey | 1.76 | 2.80 | 0.03 | July |
| New Mexico | 0.94 | 4.20 | 0.15 | May |
| New York | 1.40 | 3.47 | 0.10 | June |
| North Carolina | 2.82 | 6.53 | 0.19 | May |
| North Dakota | 2.74 | 4.80 | 0.41 | July |
| Ohio | 2.60 | 3.87 | 0.26 | May |
| Oklahoma | 4.67 | 10.53 | 0.98 | May |
| Oregon | 0.22 | 1.33 | 0.02 | August |
| Pennsylvania | 1.98 | 4.00 | 0.12 | May |
| Rhode Island | 1.38 | 1.80 | 0.09 | June |
| South Carolina | 2.72 | 5.67 | 0.17 | May |
| South Dakota | 3.90 | 9.40 | 0.58 | July |
| Tennessee | 2.87 | 6.53 | 0.26 | May |
| Texas | 2.89 | 8.67 | 0.65 | May |
| Utah | 0.16 | 0.80 | <0.01 | June |
| Vermont | 1.53 | 2.60 | 0.06 | July |
| Virginia | 2.81 | 4.60 | 0.17 | May |
| Washington | 0.13 | 0.93 | 0.01 | July |
| West Virginia | 1.91 | 4.00 | 0.14 | June |
| Wisconsin | 2.28 | 5.27 | 0.30 | May |
| Wyoming | 1.47 | 8.67 | 0.18 | June |
A large state does not automatically come first because these are area-weighted frequencies, not raw report totals. However, weighting and counting days do not remove observation bias. Differences in population, roads and reporting effort remain.
Why the High Plains and Front Range Get Frequent Hail
Hail grows inside a thunderstorm when ice collects supercooled water—liquid droplets below freezing—and strong rising air keeps it within a favorable growth zone. Larger stones require conditions that allow substantial growth before they fall out or the updraft weakens.
The High Plains can bring together several ingredients: moisture feeding the storm, unstable air that can rise vigorously, lifting along terrain or weather boundaries, and wind shear. Wind shear is a change in wind speed or direction with height. It can help organize storms and keep their rising inflow separated from falling rain and cooled air, allowing some storms to persist.
The Midwestern Regional Climate Center’s hail overview explains the importance of these ingredients and of the distance between the freezing level and the ground. Higher terrain can shorten hail’s passage through above-freezing air, leaving less opportunity to melt before reaching the surface.
Elevation alone does not create hail. A high plateau without enough moisture, instability or storm development can have few hail-producing thunderstorms. Likewise, a low-elevation place can experience destructive hail when a sufficiently strong storm produces large stones. The Front Range’s hail exposure reflects the combination of storm environments and terrain, not altitude in isolation.
When Is Hail Most Common?
There is no single nationwide hail season. Favorable storm environments generally develop earlier in the South and become more common farther north and over the High Plains as spring gives way to summer.
Regional peak months
- Southeast: generally earlier in spring.
- Southern Plains: commonly April–May.
- Central Plains: commonly May–June.
- Northeastern High Plains and traditional Hail Alley core: commonly June–July.
These are broad climatological patterns, not fixed start and end dates. In its separate 2000–2023 local hail analysis, NWS Cheyenne found June first and July second, with reports from March through October. That local report-count result should not be confused with a national season or this edition’s gridded hail-day calculations.
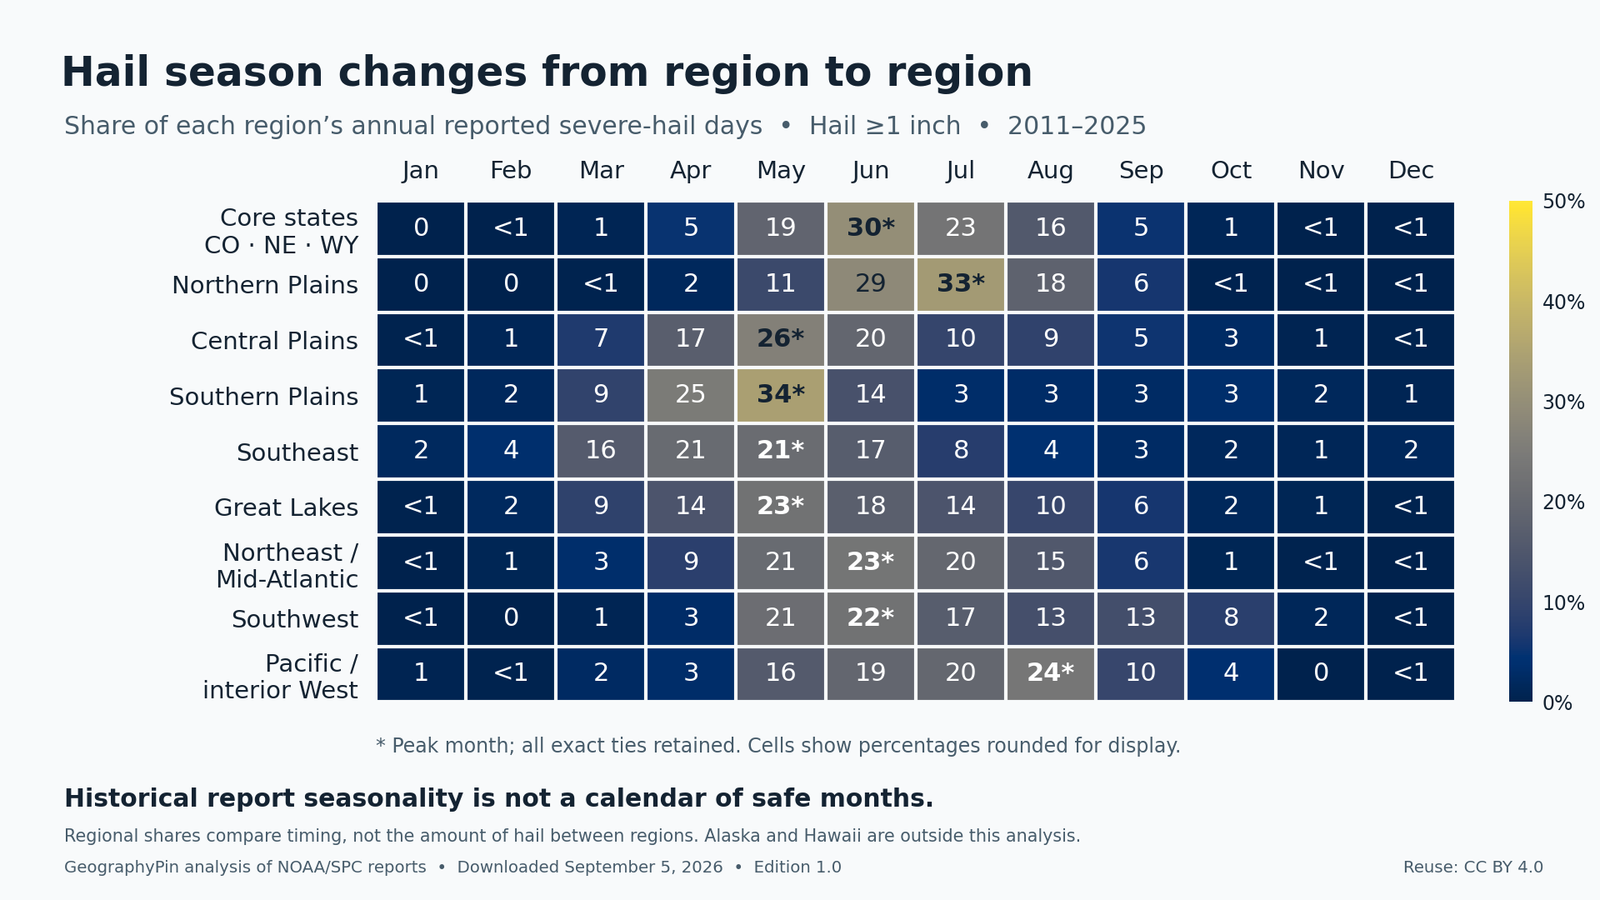
The heatmap below shows each region’s share of its annual, area-weighted severe-hail-day total in each month. Colors progress from dark blue for smaller shares toward yellow for larger shares. Equal colors in two regions do not imply equal hail frequency.
| Region | Jan | Feb | Mar | Apr | May | Jun | Jul | Aug | Sep | Oct | Nov | Dec |
|---|---|---|---|---|---|---|---|---|---|---|---|---|
| Core states: CO, NE, WY | 0 | <1 | 1 | 5 | 19 | 30* | 23 | 16 | 5 | 1 | <1 | <1 |
| Northern Plains | 0 | 0 | <1 | 2 | 11 | 29 | 33* | 18 | 6 | <1 | <1 | <1 |
| Central Plains | <1 | 1 | 7 | 17 | 26* | 20 | 10 | 9 | 5 | 3 | 1 | <1 |
| Southern Plains | 1 | 2 | 9 | 25 | 34* | 14 | 3 | 3 | 3 | 3 | 2 | 1 |
| Southeast | 2 | 4 | 16 | 21 | 21* | 17 | 8 | 4 | 3 | 2 | 1 | 2 |
| Great Lakes | <1 | 2 | 9 | 14 | 23* | 18 | 14 | 10 | 6 | 2 | 1 | <1 |
| Northeast and Mid-Atlantic | <1 | 1 | 3 | 9 | 21 | 23* | 20 | 15 | 6 | 1 | <1 | <1 |
| Southwest | <1 | 0 | 1 | 3 | 21 | 22* | 17 | 13 | 13 | 8 | 2 | <1 |
| Pacific and interior West | 1 | <1 | 2 | 3 | 16 | 19 | 20 | 24* | 10 | 4 | 0 | <1 |
Table downloads (4)
- Measurements that can produce different hail hotspots (7 × 3)View tableDownload CSV
- Common NWS hail-size references; diameter in inches and millimeters (7 × 3)View tableDownload CSV
- Reported hail days per year within 25 miles: 2011–2025, 48 states and DC; raw grid statistics (50 × 5)View tableDownload CSV
- Historical report seasonality: percentage of each region’s annual severe-hail-day total, 2011–2025 (10 × 13)View tableDownload CSV
* Peak month; ties use unrounded values. Percentages are rounded, so rows may not sum to 100. “<1” means a positive share below 0.5%; “0” means none in this sample. Dark blue represents smaller seasonal shares; yellow represents larger shares, on a fixed 0–50% scale.
Download the seasonality heatmap or download its monthly data.
In this edition, the Southern and Central Plains groups peak in May, the combined Colorado–Nebraska–Wyoming group in June, and the Northern Plains in July. The broad Southeast group peaks in May, narrowly ahead of April; Alabama’s individual state peak is March, while Arkansas, Louisiana and Mississippi peak in April. The core-state group includes whole states, not just the traditional junction. Region membership is defined in the methodology download; broad groups inevitably combine places with different local seasons.
Hail can occur somewhere in the United States during every month. Winter is not universally hail-free, and a region’s least active month is not a guarantee of safety.
How We Made This Map
This is GeographyPin analysis of NOAA/SPC reports, not an official NOAA map. The source is the finalized SPC severe-weather archive compiled from NWS Storm Data, with the analysis restricted to 2011–2025. No preliminary current-year reports are mixed into it.
One qualifying calendar date, counted once near each point
- Filter the source. Select the 15 complete years and usable contiguous-U.S./DC observations with hail diameters of at least 1 inch. Repeat the calculation at 2 inches for significant hail.
- Use a fixed spatial framework. Project coordinates into NAD83 / Conus Albers, EPSG:5070, and place points on a grid spaced about 50 miles (80 kilometers) apart.
- Count nearby dates. At each point, count each source calendar date once if one or more qualifying observations lie within 25 miles (40.2 kilometers). The source dates use fixed Central Standard Time, UTC−06:00, from midnight to midnight.
- Annualize. Divide each 15-year date count by 15. For example, 60 qualifying dates would equal 4 reported hail days per year; that is a calculation example, not an assertion about a particular location.
- Make the display readable. Apply a Gaussian smoother with a standard deviation of about 75 miles (120 kilometers). This blends neighboring grid values into a regional surface; it does not reconstruct the hail swath of a storm.
- Keep the underlying numbers. Export raw counts, raw annual means, smoothed means, monthly counts and source metadata. State and regional summaries use the raw grid with area weights.
The calculation retains 114,295 qualifying reports and samples 1,378 grid cells. The radius is measured in projected coordinates and approximates ground distance. Smoothing is normalized by the U.S. footprint to avoid treating the unmapped exterior as observed zero hail. Area weights use generalized state footprints, including mapped water; they are not land-only exposure weights. The complete methodology records the fixed grid origin, distance calculation, smoothing edges, region definitions, source checksums and field meanings.
Checking the pattern against SPC’s official climatology
We compared this edition with SPC’s official 1986–2015 hail-at-least-1-inch map, its downloadable 1-inch NetCDF grid, and the hail-at-least-2-inch map. Both comparisons support a broad Great Plains maximum, with substantial severe and significant hail extending south of the traditional core. The official maps also show why the three-state junction should not be assumed to contain the highest value for every hail-size threshold.
The periods and processing differ, so this is a check on broad regional structure, not proof that cell values should match. Both analyses use reports and their periods overlap, so the comparison is not an independent observational test. Our 15-year analysis is not a 30-year climate normal.
What the reports cannot show
Reports cluster near people, roads, storm chasers and active reporting networks. Rural or nighttime hail may go unreported. Sizes also cluster around familiar objects and warning thresholds. Counting dates reduces the influence of many reports from one event, but does not eliminate those biases.
A coordinate marks an observation, not the full area hit by hail. Missing reports do not prove that hail was absent. Border areas also lack equivalent observations from Canada and Mexico in this U.S. dataset. Smoothing and the coarse grid hide local variation, particularly in small jurisdictions.
The analysis does not use SPC’s monetary-loss fields, which SPC warns are highly suspect. It does not estimate insurance losses or infer that Hail Alley is moving because report counts have increased. Reporting practices have changed; climate-change attribution requires additional evidence.
What the Hail Alley Map Means for Roof Damage
Frequent hail exposure creates more opportunities for damaging impacts. It does not tell you whether a particular roof has been damaged, needs replacement or will suffer a loss next year. Even within a darker map area, a storm can miss one neighborhood and strike another.
Roof outcomes depend on hail diameter, hardness and density; wind and impact angle; storm duration and the number of impacts; and the roof’s material, installation, condition and age. A diameter measured elsewhere in a storm is not necessarily the size that struck your home. Nor does the same-size stone always deliver the same impact.
IBHS research on weathering and hazard exposure describes how hail strength, speed and impact angle influence damage. A stone can break apart on impact, while another transfers more energy to the surface. An older, deteriorated covering may also respond differently from a well-installed roof in good condition.
Can one-inch hail damage a roof?
Yes, one-inch hail may damage some vulnerable materials, while other roofs withstand larger hail. IBHS tests of repeated small-hail impacts also show why cumulative exposure matters: smaller impacts can degrade protective granules and increase vulnerability to later impacts. That finding does not mean every affected shingle immediately leaks or requires replacement.
No single diameter guarantees damage, and none guarantees that a roof is unharmed. The NWS severe-hail threshold helps define a weather hazard. An inspection asks a different question: what actually happened to this roof, and how does it affect the roof’s condition and function?
Impact-resistant roofing can improve performance, but it is not hail-proof. IBHS shingle performance ratings compare products under controlled impacts and show that products carrying impact-resistant labels do not all perform alike. Tests of new materials cannot guarantee the performance of every installed, weathered roof.
After a hailstorm: safe observations and a useful record
According to IBHS’s damage-identification guidance, dents on gutters, downspouts, flashing, air-conditioning equipment and outdoor objects can provide collateral evidence of hail. They do not automatically establish damage to the roof covering. Granule loss, discoloration and ordinary wear alone are inconclusive; weathering, defects, installation marks and other impacts can produce look-alike signs.
After a Hailstorm
- Wait until severe weather has passed. Avoid broken glass, downed power lines and damaged structures.
- Do not climb onto a wet, steep or damaged roof. Keep your own exterior checks at ground level.
- Photograph safely visible damage, including dents on accessible outdoor objects.
- Check ceilings and, only if safely accessible, the attic for leaks or water staining.
- Record the storm date, approximate time, and reported hail size and source.
- If damage is suspected, contact your insurer or agent and follow the policy’s instructions.
- Keep photographs and receipts for necessary temporary measures; leave hazardous work to professionals.
- Use an appropriately qualified local professional for an actual roof inspection.
The NAIC’s claims guidance emphasizes documentation and communication with the insurer. A policy may cover hail damage, but coverage, exclusions, deductibles, valuation and deadlines depend on the policy and jurisdiction.
Hail frequency is therefore not claims frequency, repair cost or expected financial loss. This map supplies regional hazard context; it cannot make an inspection finding or an insurance determination.
Historical Hail Maps Versus Current Warnings
An individual hailstorm is weather; a multi-year frequency analysis describes a historical pattern. That is why weather and climate describe different time scales.
For active conditions, consult the SPC Convective Outlooks displayed by the NWS and your local National Weather Service office. Follow current local warnings even outside the map’s highest-frequency areas. A historical average cannot tell you whether hail will reach your home today.
Frequently Asked Questions
Where is Hail Alley on the U.S. map?
Its traditional core is near the Colorado–Nebraska–Wyoming junction on the High Plains. A broader severe-hail belt extends through other parts of the Great Plains.
Which states are in Hail Alley?
Colorado, Nebraska and Wyoming form the traditional core description. Broader definitions include portions of other Plains states, but there is no universally accepted membership list.
Is Hail Alley an officially defined region?
No single official border defines it. An outline depends on the chosen hazard, threshold, dataset and time period.
Does Hail Alley include Texas?
Texas belongs to the broader severe-hail belt used in many descriptions. It is outside the traditional Colorado–Nebraska–Wyoming core, and its hail exposure varies considerably across the state.
Which state receives the most hail?
Kansas has the highest area-weighted mean in this 2011–2025 analysis of reported hail at least 1 inch within projected 25-mile neighborhoods: 5.54 days per year. That is not a ranking of all-size hailstorms, individual reports, or insurance losses.
What months have the greatest hail risk?
The usual broad progression is earlier spring in the Southeast, April–May in the Southern Plains, May–June in the Central Plains, and June–July around the traditional core. Local conditions and individual years vary.
Can damaging hail occur outside Hail Alley?
Yes. Lower historical frequency does not prevent a severe storm from producing damaging hail. Always use current local weather information.
Is this map a forecast?
No. It summarizes reports from 2011–2025. It neither predicts the next storm nor reconstructs an individual storm’s hail footprint.
Can 1-inch hail damage a roof?
It can damage some materials, especially when condition and repeated impacts increase vulnerability. Hail diameter alone cannot establish either damage or the absence of damage.
Does living in Hail Alley mean my roof will be damaged every year?
No. A nearby reported hail day is not a confirmed strike on your home, and a hail strike is not automatically roof damage. Annual averages also conceal variation between years.
What are safe signs of roof hail damage?
From the ground, document new dents on accessible exterior objects and safely visible damage; inside, look for leaks or staining. These observations justify further assessment, but none alone proves hail caused roof damage. Do not climb onto the roof.
Can the map and data be downloaded and reused?
Yes. The download panel provides PNG, PDF, CSV and GeoJSON files. They are available under CC BY 4.0. Credit GeographyPin, link to the article and license, and identify adaptations. Keep the period and disclaimer with reproduced maps.
What Did We Learn Today?
A useful Hail Alley map needs more than a shaded stripe: it needs a hail-size threshold, a time period and a clear counting method. Counting reported dates reduces the dominance of repeated observations from one event, while retaining significant limitations from uneven reporting. Regional seasons help explain the pattern, but neither a seasonal peak nor a historical hotspot diagnoses a roof or predicts the next storm.
Sources & Data Notes
The map and state table are based on finalized NOAA Storm Prediction Center hail reports from 2011 through 2025. The main measure is the average number of days per year with at least one report of hail measuring 1 inch (25.4 mm) or larger within 25 miles (40.2 kilometers) of a grid point. Hail measuring at least 2 inches (50.8 mm) is analyzed separately. Multiple nearby reports on the same date count as one hail day, so the results are not rankings of raw report totals.
Storm reports do not provide a complete footprint of every hailstorm. Reports are more likely near populated areas, roads, trained spotters and well-observed storms, while rural or nighttime hail may be missed. A report coordinate identifies where hail was observed—not every location affected by the storm. The map therefore shows broad historical patterns rather than a forecast, an address-level risk estimate or a roof-damage assessment.
The map’s continuous surface is smoothed to make regional patterns easier to see, while the state table uses area-weighted values from the underlying grid. The grid, projection and calculation are explained in How We Made This Map. This is an original GeographyPin analysis of NOAA/SPC reports, not an official NOAA map.
- NOAA Storm Prediction Center: Severe-weather reports and hail climatology
- University of Illinois Extension: Hail
- Midwestern Regional Climate Center: Hail
- National Weather Service Cheyenne: Hail Climatology
- Insurance Institute for Business & Home Safety: Is It Hail Damage?
- Insurance Institute for Business & Home Safety: Hail Impact-Resistant Shingle Ratings
- National Association of Insurance Commissioners: Navigating the Claims Process