A state can outrank another on land and fall behind it when water is counted. The difference is especially easy to see around the Great Lakes, but it matters on the coasts and among smaller states too.
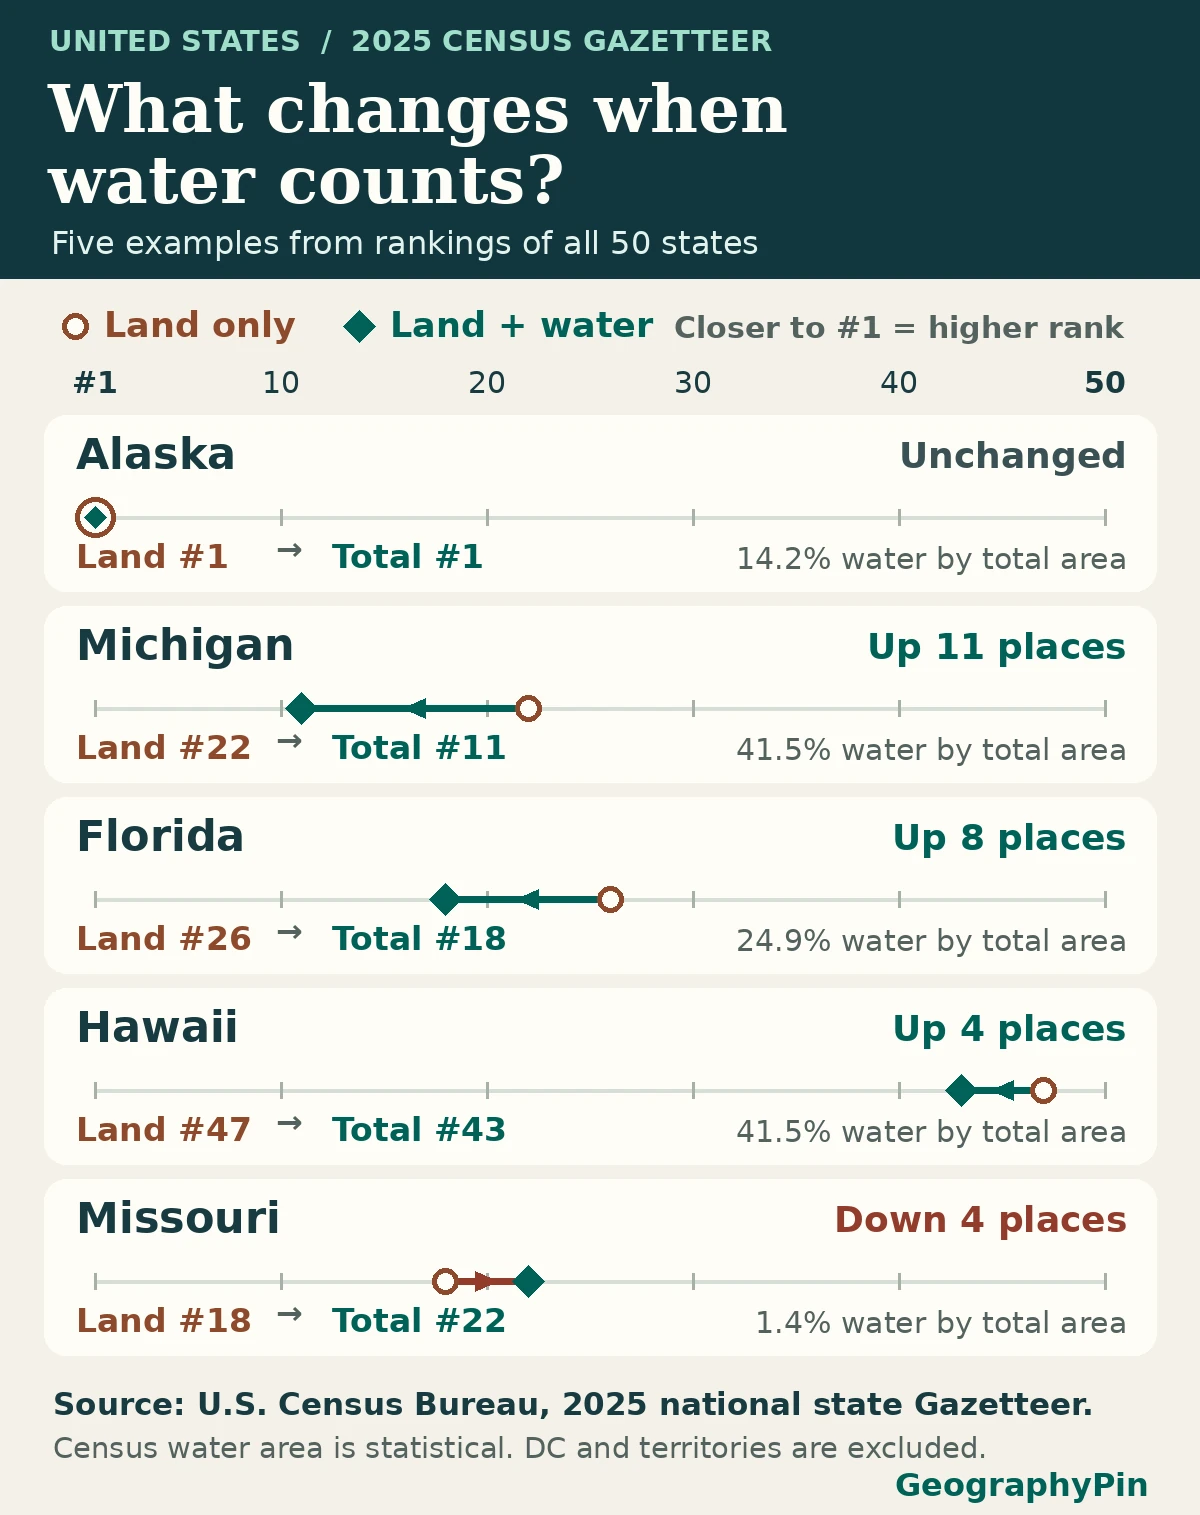
Alaska is the largest U.S. state by both land and total area, and Rhode Island is the smallest by both. In the 2025 Census Gazetteer, Michigan rises the most when water is counted, from 22nd to 11th. Total area adds the Census Bureau’s statistical water area to land area.
How to use this article: Look up any of the 50 states, work through Alaska’s addition, compare the largest rank shifts, or check what the water field measures.
The complete 50-state ranking by both measures
This comparison uses the Census Bureau’s 2025 national state Gazetteer. It includes the 50 states, including Alaska and Hawaii. The national file also contains Washington, D.C., and Puerto Rico; neither is a state, so both are excluded. Land area comes from the Census ALAND field. Total area adds the Census AWATER field to it.
Look up the two ranks for any state
The table starts with the largest land area. A smaller number in the total-rank column means the state moves closer to first place when water is included. Swipe horizontally on a phone to see water, total area and the water share. Both ranks are provided directly; neither depends on interactively sorting the table.
| State | Land rank | Total rank | Positions gained | Land area | Water area | Total area | Water share |
|---|---|---|---|---|---|---|---|
| Alaska | 1 | 1 | 0 | 571,390 mi² 1,479,893 km² 1,479,893,380,150 m² | 94,335 mi² 244,326 km² 244,326,118,163 m² | 665,725 mi² 1,724,219 km² 1,724,219,498,313 m² | 14.17% |
| Texas | 2 | 2 | 0 | 261,260 mi² 676,660 km² 676,660,157,338 m² | 7,339 mi² 19,008 km² 19,008,164,905 m² | 268,599 mi² 695,668 km² 695,668,322,243 m² | 2.73% |
| California | 3 | 3 | 0 | 155,860 mi² 403,677 km² 403,676,564,152 m² | 7,833 mi² 20,289 km² 20,288,505,023 m² | 163,694 mi² 423,965 km² 423,965,069,175 m² | 4.79% |
| Montana | 4 | 4 | 0 | 145,550 mi² 376,974 km² 376,973,522,036 m² | 1,493 mi² 3,867 km² 3,866,841,435 m² | 147,043 mi² 380,840 km² 380,840,363,471 m² | 1.02% |
| New Mexico | 5 | 5 | 0 | 121,313 mi² 314,199 km² 314,198,529,853 m² | 281 mi² 727 km² 726,526,491 m² | 121,593 mi² 314,925 km² 314,925,056,344 m² | 0.23% |
| Arizona | 6 | 6 | 0 | 113,655 mi² 294,366 km² 294,366,238,828 m² | 330 mi² 854 km² 853,868,947 m² | 113,985 mi² 295,220 km² 295,220,107,775 m² | 0.29% |
| Nevada | 7 | 7 | 0 | 109,860 mi² 284,537 km² 284,537,074,263 m² | 710 mi² 1,840 km² 1,839,852,286 m² | 110,571 mi² 286,377 km² 286,376,926,549 m² | 0.64% |
| Colorado | 8 | 8 | 0 | 103,637 mi² 268,419 km² 268,419,398,775 m² | 458 mi² 1,185 km² 1,185,110,804 m² | 104,095 mi² 269,605 km² 269,604,509,579 m² | 0.44% |
| Wyoming | 9 | 10 | −1 | 97,089 mi² 251,458 km² 251,458,188,895 m² | 721 mi² 1,868 km² 1,868,027,102 m² | 97,810 mi² 253,326 km² 253,326,215,997 m² | 0.74% |
| Oregon | 10 | 9 | +1 | 95,997 mi² 248,631 km² 248,630,742,196 m² | 2,382 mi² 6,169 km² 6,168,664,862 m² | 98,379 mi² 254,799 km² 254,799,407,058 m² | 2.42% |
| Idaho | 11 | 14 | −3 | 82,645 mi² 214,051 km² 214,050,683,201 m² | 923 mi² 2,391 km² 2,390,817,981 m² | 83,569 mi² 216,442 km² 216,441,501,182 m² | 1.10% |
| Utah | 12 | 13 | −1 | 82,596 mi² 213,922 km² 213,921,693,698 m² | 2,302 mi² 5,963 km² 5,963,352,640 m² | 84,898 mi² 219,885 km² 219,885,046,338 m² | 2.71% |
| Kansas | 13 | 15 | −2 | 81,759 mi² 211,754 km² 211,754,288,230 m² | 519 mi² 1,345 km² 1,345,197,050 m² | 82,278 mi² 213,099 km² 213,099,485,280 m² | 0.63% |
| Minnesota | 14 | 12 | +2 | 79,632 mi² 206,245 km² 206,245,435,043 m² | 7,311 mi² 18,937 km² 18,936,592,419 m² | 86,943 mi² 225,182 km² 225,182,027,462 m² | 8.41% |
| Nebraska | 15 | 16 | −1 | 76,815 mi² 198,951 km² 198,950,563,271 m² | 532 mi² 1,378 km² 1,378,346,850 m² | 77,347 mi² 200,329 km² 200,328,910,121 m² | 0.69% |
| South Dakota | 16 | 17 | −1 | 75,808 mi² 196,342 km² 196,341,986,509 m² | 1,308 mi² 3,387 km² 3,387,247,814 m² | 77,116 mi² 199,729 km² 199,729,234,323 m² | 1.70% |
| North Dakota | 17 | 20 | −3 | 68,994 mi² 178,694 km² 178,694,402,328 m² | 1,705 mi² 4,415 km² 4,414,688,315 m² | 70,699 mi² 183,109 km² 183,109,090,643 m² | 2.41% |
| Missouri | 18 | 22 | −4 | 68,746 mi² 178,052 km² 178,052,192,662 m² | 961 mi² 2,488 km² 2,487,934,091 m² | 69,707 mi² 180,540 km² 180,540,126,753 m² | 1.38% |
| Oklahoma | 19 | 21 | −2 | 68,597 mi² 177,665 km² 177,664,943,367 m² | 1,302 mi² 3,373 km² 3,372,936,372 m² | 69,899 mi² 181,038 km² 181,037,879,739 m² | 1.86% |
| Washington | 20 | 19 | +1 | 66,457 mi² 172,122 km² 172,121,688,057 m² | 4,844 mi² 12,546 km² 12,545,987,222 m² | 71,301 mi² 184,668 km² 184,667,675,279 m² | 6.79% |
| Georgia | 21 | 24 | −3 | 57,718 mi² 149,488 km² 149,487,720,450 m² | 1,706 mi² 4,417 km² 4,417,264,043 m² | 59,423 mi² 153,905 km² 153,904,984,493 m² | 2.87% |
| Michigan | 22 | 11 | +11 | 56,613 mi² 146,626 km² 146,625,947,203 m² | 40,101 mi² 103,860 km² 103,860,207,077 m² | 96,713 mi² 250,486 km² 250,486,154,280 m² | 41.46% |
| Iowa | 23 | 26 | −3 | 55,854 mi² 144,660 km² 144,660,389,024 m² | 419 mi² 1,085 km² 1,085,298,995 m² | 56,273 mi² 145,746 km² 145,745,688,019 m² | 0.74% |
| Illinois | 24 | 25 | −1 | 55,514 mi² 143,779 km² 143,779,367,883 m² | 2,400 mi² 6,215 km² 6,215,353,468 m² | 57,913 mi² 149,995 km² 149,994,721,351 m² | 4.14% |
| Wisconsin | 25 | 23 | +2 | 54,168 mi² 140,295 km² 140,295,112,685 m² | 11,328 mi² 29,341 km² 29,340,578,971 m² | 65,497 mi² 169,636 km² 169,635,691,656 m² | 17.30% |
| Florida | 26 | 18 | +8 | 53,658 mi² 138,974 km² 138,973,813,223 m² | 17,745 mi² 45,960 km² 45,960,479,273 m² | 71,404 mi² 184,934 km² 184,934,292,496 m² | 24.85% |
| Arkansas | 27 | 29 | −2 | 51,992 mi² 134,659 km² 134,658,642,291 m² | 1,206 mi² 3,123 km² 3,122,591,253 m² | 53,198 mi² 137,781 km² 137,781,233,544 m² | 2.27% |
| Alabama | 28 | 30 | −2 | 50,651 mi² 131,186 km² 131,186,429,591 m² | 1,769 mi² 4,581 km² 4,580,729,056 m² | 52,420 mi² 135,767 km² 135,767,158,647 m² | 3.37% |
| North Carolina | 29 | 28 | +1 | 48,624 mi² 125,936 km² 125,935,547,374 m² | 5,195 mi² 13,454 km² 13,453,873,497 m² | 53,819 mi² 139,389 km² 139,389,420,871 m² | 9.65% |
| New York | 30 | 27 | +3 | 47,124 mi² 122,049 km² 122,049,344,560 m² | 7,435 mi² 19,257 km² 19,256,566,831 m² | 54,559 mi² 141,306 km² 141,305,911,391 m² | 13.63% |
| Mississippi | 31 | 32 | −1 | 46,925 mi² 121,535 km² 121,534,611,855 m² | 1,511 mi² 3,914 km² 3,914,024,462 m² | 48,436 mi² 125,449 km² 125,448,636,317 m² | 3.12% |
| Pennsylvania | 32 | 33 | −1 | 44,742 mi² 115,882 km² 115,882,017,582 m² | 1,312 mi² 3,397 km² 3,397,072,484 m² | 46,054 mi² 119,279 km² 119,279,090,066 m² | 2.85% |
| Louisiana | 33 | 31 | +2 | 43,215 mi² 111,927 km² 111,927,154,861 m² | 9,160 mi² 23,724 km² 23,724,485,446 m² | 52,375 mi² 135,652 km² 135,651,640,307 m² | 17.49% |
| Tennessee | 34 | 36 | −2 | 41,225 mi² 106,772 km² 106,771,660,995 m² | 905 mi² 2,344 km² 2,344,243,062 m² | 42,130 mi² 109,116 km² 109,115,904,057 m² | 2.15% |
| Ohio | 35 | 34 | +1 | 40,859 mi² 105,824 km² 105,824,499,476 m² | 3,967 mi² 10,274 km² 10,273,857,263 m² | 44,826 mi² 116,098 km² 116,098,356,739 m² | 8.85% |
| Kentucky | 36 | 37 | −1 | 39,486 mi² 102,268 km² 102,267,794,436 m² | 920 mi² 2,383 km² 2,383,097,595 m² | 40,406 mi² 104,651 km² 104,650,892,031 m² | 2.28% |
| Virginia | 37 | 35 | +2 | 39,481 mi² 102,256 km² 102,256,455,003 m² | 3,293 mi² 8,530 km² 8,529,795,937 m² | 42,775 mi² 110,786 km² 110,786,250,940 m² | 7.70% |
| Indiana | 38 | 38 | 0 | 35,825 mi² 92,787 km² 92,786,782,808 m² | 596 mi² 1,544 km² 1,543,815,569 m² | 36,421 mi² 94,331 km² 94,330,598,377 m² | 1.64% |
| Maine | 39 | 39 | 0 | 30,845 mi² 79,889 km² 79,888,899,089 m² | 4,535 mi² 11,745 km² 11,744,562,992 m² | 35,380 mi² 91,633 km² 91,633,462,081 m² | 12.82% |
| South Carolina | 40 | 40 | 0 | 30,064 mi² 77,866 km² 77,865,991,519 m² | 1,959 mi² 5,074 km² 5,074,452,542 m² | 32,023 mi² 82,940 km² 82,940,444,061 m² | 6.12% |
| West Virginia | 41 | 41 | 0 | 24,041 mi² 62,267 km² 62,266,655,298 m² | 189 mi² 489 km² 488,773,392 m² | 24,230 mi² 62,755 km² 62,755,428,690 m² | 0.78% |
| Maryland | 42 | 42 | 0 | 9,711 mi² 25,151 km² 25,151,298,706 m² | 2,695 mi² 6,980 km² 6,979,771,758 m² | 12,406 mi² 32,131 km² 32,131,070,464 m² | 21.72% |
| Vermont | 43 | 45 | −2 | 9,217 mi² 23,873 km² 23,872,664,356 m² | 398 mi² 1,031 km² 1,030,573,104 m² | 9,615 mi² 24,903 km² 24,903,237,460 m² | 4.14% |
| New Hampshire | 44 | 46 | −2 | 8,954 mi² 23,191 km² 23,190,733,491 m² | 396 mi² 1,025 km² 1,025,349,624 m² | 9,350 mi² 24,216 km² 24,216,083,115 m² | 4.23% |
| Massachusetts | 45 | 44 | +1 | 7,801 mi² 20,204 km² 20,204,475,228 m² | 2,753 mi² 7,131 km² 7,130,575,380 m² | 10,554 mi² 27,335 km² 27,335,050,608 m² | 26.09% |
| New Jersey | 46 | 47 | −1 | 7,355 mi² 19,049 km² 19,049,443,028 m² | 1,364 mi² 3,533 km² 3,533,161,265 m² | 8,719 mi² 22,583 km² 22,582,604,293 m² | 15.65% |
| Hawaii | 47 | 43 | +4 | 6,423 mi² 16,634 km² 16,634,436,568 m² | 4,547 mi² 11,777 km² 11,777,362,694 m² | 10,970 mi² 28,412 km² 28,411,799,262 m² | 41.45% |
| Connecticut | 48 | 48 | 0 | 4,843 mi² 12,542 km² 12,542,101,087 m² | 701 mi² 1,816 km² 1,816,013,585 m² | 5,544 mi² 14,358 km² 14,358,114,672 m² | 12.65% |
| Delaware | 49 | 49 | 0 | 1,949 mi² 5,047 km² 5,046,707,808 m² | 540 mi² 1,399 km² 1,399,203,452 m² | 2,489 mi² 6,446 km² 6,445,911,260 m² | 21.71% |
| Rhode Island | 50 | 50 | 0 | 1,034 mi² 2,678 km² 2,677,770,297 m² | 511 mi² 1,324 km² 1,323,680,040 m² | 1,545 mi² 4,001 km² 4,001,450,337 m² | 33.08% |
Why the leaders stay in the same order
Add Alaska’s land and water from the source
Alaska is first in both rankings, followed in the same order by Texas, California, Montana and New Mexico. The fact that Alaska stays first does not mean that its water area is small. The Gazetteer gives Alaska 1,479,893,380,150 m² of land and 244,326,118,163 m² of water. Add the two integers for the total of 1,724,219,498,313 m², or about 665,725 square miles.
In the table, the numbers shown in square miles and square kilometres are rounded for reading. The calculations and both rankings start with square metres, so adding two already rounded display figures may differ by a unit from the displayed total.
How water moves Michigan, Florida, Hawaii and Missouri
See the largest gains and the largest fall
Michigan moves up eleven places, from 22nd by land to 11th by total area, the largest gain. Its roughly 40,101 square miles of Census water area include Great Lakes waters. Water is about 41.46% of its total in these figures. Florida gains eight places, from 26th to 18th; water accounts for about 24.85% of its total.
Hawaii moves from 47th to 43rd with about 41.45% water by this measure. Its water share is close to Michigan’s, but its rank rises only four places. A rank change depends on how far apart the states around it are, not just on its own share. Missouri falls the most, from 18th to 22nd, although no land is removed. Other states simply move past it under the total-area measure.
What Census water area measures
Read the water column as a statistical measure
The 2025 Gazetteer record layout says the water-area fields are for statistical purposes. Census geography distinguishes inland, Great Lakes, coastal and territorial water in its water-classification reference manual. Which types matter depend on the state. A coastal or Great Lakes state can include large mapped water areas, while an inland state’s water is not necessarily zero.
This is not a ranking of freshwater resources, water depth, kilometres of shoreline or legal control of offshore waters. You cannot turn a single water-area total into those measures, and the table does not itemize the four kinds of water separately.
Reproduce the ranks, conversions and water shares
Take the ALAND and AWATER columns from the same 2025 national file. Add them before converting or rounding. Sort both ALAND and their unrounded sum from largest to smallest; the lists contain no exact ties. This comparison defines a gain as land rank minus total rank, so Michigan’s shift is 22 − 11 = +11. Should a future release show an exact tie, retain the tie rather than breaking it with a rounded conversion. An absent value would need checking rather than treating it as zero.
Divide exact square metres by 1,000,000 for square kilometres or by 2,589,988.110336 for square miles. Water share is water area divided by total area, times 100. The two area rankings describe one file edition, not changes from a previous census; rerun the full table if you choose another release.
Frequently Asked Questions
Is Rhode Island the state with the least water?
No. It ranks last by total area, not by water area alone. The water column measures the area of a state’s mapped water and is separate from both its land and total rank.
Why might a Census website show slightly different decimal square miles?
This article converts directly from the exact square-metre values, while the file also publishes separate square-mile fields. Small differences between those decimal values do not alter the rank.
Does total area tell you where more people live per square mile?
Not by itself. Population is a separate measure. When comparing residents per unit of land, use land area as the denominator and state that choice.
What Did We Learn Today?
The same 50 states have two rankings because land and total area ask different questions. The 2025 Census data allow an exact comparison before rounding. A state can move up or down without any change in its land area, and the Census water field is a statistical measure, not a jurisdictional claim.
Sources & Data Notes
All 50 state records come from the September 2025 national state Gazetteer. We rank exact land square metres and exact land-plus-water sums, then render independent rounded conversions. Water percentages use the same sum as their denominator. The Census reference manual explains water categories, but is not a second source of state totals.
- U.S. Census Bureau, 2025 Gazetteer release directory
- U.S. Census Bureau, exact 2025 national state Gazetteer ZIP
- U.S. Census Bureau, 2025 Gazetteer record layouts
- U.S. Census Bureau, Area Measurement and Water Classification
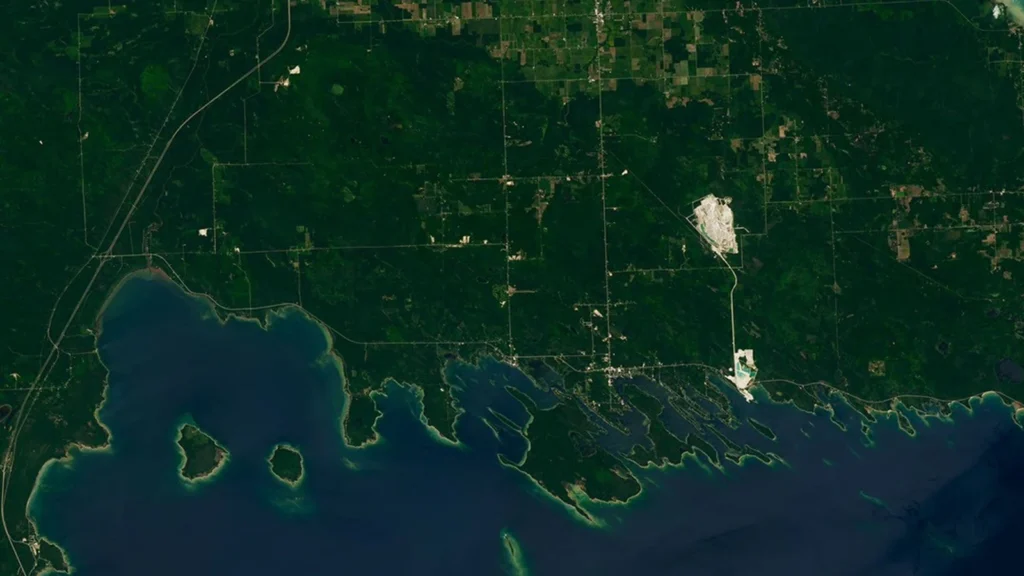
Photo: Michigan’s Les Cheneaux Islands: NASA Earth Observatory image by Lauren Dauphin using U.S. Geological Survey Landsat data, July 23, 2026 (cropped; U.S. government imagery). Map data: U.S. Census Bureau 2025 State Gazetteer Files.