Lake Havasu is more than the water beside a resort city. It is a widened, controlled reach of the Colorado River, held behind Parker Dam and connected to two major water-delivery systems. Reading the dam, the state shores and the pumping intakes together reveals a geography that a city-center map alone cannot explain.
Lake Havasu is a Colorado River reservoir on the Arizona–California boundary, formed behind Parker Dam. Lake Havasu City lies on its Arizona shore, but the reservoir extends beyond the city. It supplies the Colorado River Aqueduct toward Southern California and the Central Arizona Project toward central and southern Arizona.
How to use this article: Start with reading map lines, distinguish different measurements, or follow the California connection.
1. Find the reservoir and distinguish it from the city
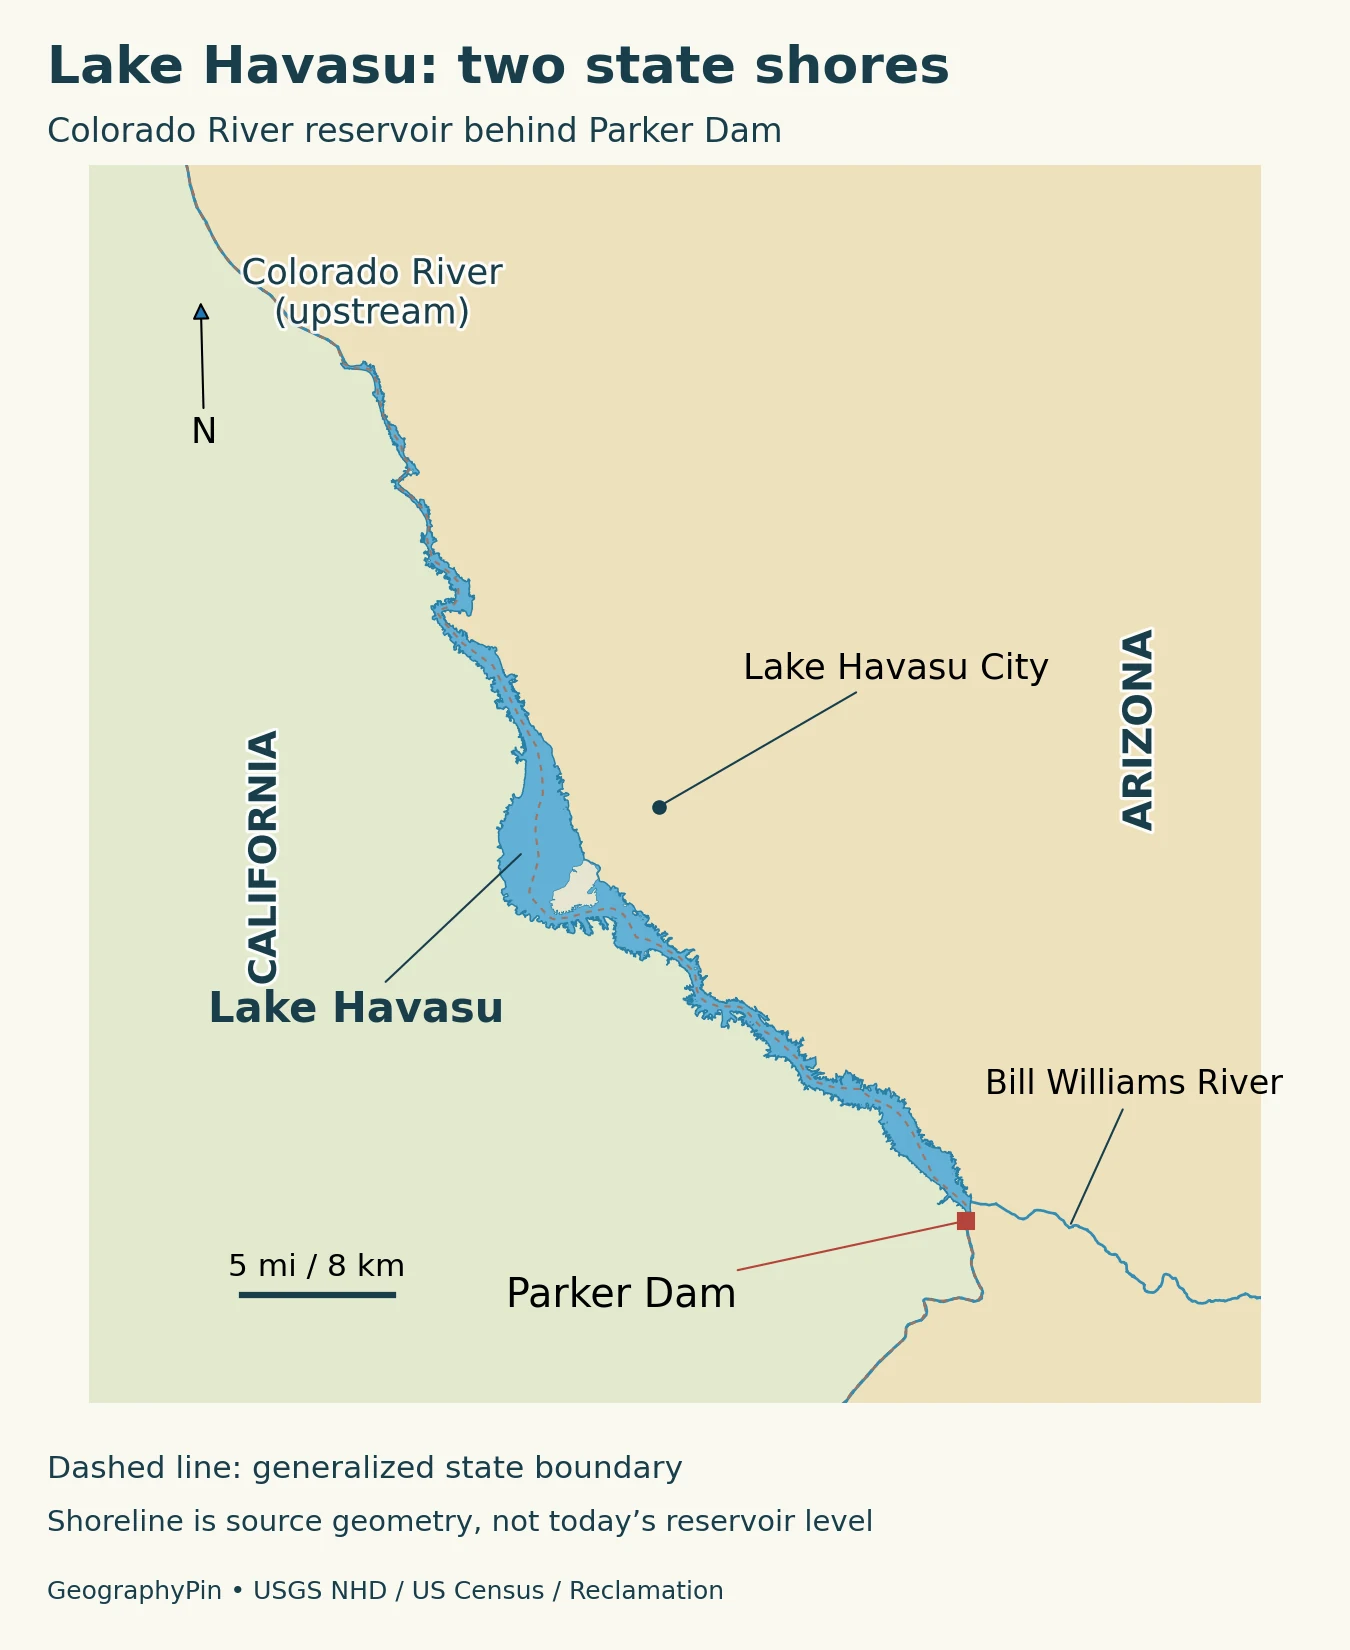
Lake Havasu occupies part of the lower Colorado River corridor, with Arizona generally along the eastern shore and California along the western shore. Parker Dam closes the downstream end. Water arriving along the Colorado River spreads through the reservoir before continuing downstream or being diverted into water-supply infrastructure.
Lake Havasu City is an Arizona community on the shore, not the name of the entire surrounding region. Its London Bridge is a city landmark, whereas Parker Dam is the structure that created the reservoir. The two help orient a map in different ways: one identifies a developed waterfront, and the other identifies the downstream control point.
Read three kinds of lines
The shoreline marks the water’s edge at the mapping source’s reference conditions. The state boundary is a political line. An aqueduct route represents infrastructure carrying water away from the river corridor. Those lines should not be treated as interchangeable: an irregular shoreline does not by itself establish land ownership, access rights or a precise legal boundary.
The Bill Williams River enters the Colorado River at Lake Havasu from the Arizona side. Its arm and river-mouth habitats add another component to the reservoir’s shape. A map focused only on the broad water surface near the city can miss this important tributary connection farther south.
2. Reservoir facts need a date and a water level
| Measurement | Reported value | What to notice |
|---|---|---|
| Reference water-surface elevation | 450 feet (137.16 meters) | Parker Reclamation Project Vertical Datum; not a live reading |
| Surface area at that level | About 19,800 acres (80 sq km) | 2022 survey, Table 5 in January 2026 report |
| Total capacity at that level | 590,260 acre-feet (0.728 cubic km) | Includes live and dead storage |
| Live storage at that level | 570,250 acre-feet (0.703 cubic km) | Above the lowest outlet |
| Dead storage | 20,010 acre-feet (24.7 million cubic meters) | Below the lowest outlet, elevation 400 feet (121.92 meters) RPVD |
Reclamation’s January 2026 study reports updated measurements from surveys collected in 2021–2022. At an elevation of 450 feet (137.16 meters) in the Parker project datum, its table gives total capacity of 590,260 acre-feet, approximately 0.728 cubic kilometers, and surface area of about 19,800 acres, or 80 square kilometers. These describe the reservoir at a specified level, not the amount of water currently stored.
The same report distinguishes live storage above the lowest outlet from dead storage below it. At that reference level, live storage is 570,250 acre-feet and dead storage is 20,010 acre-feet. Adding the two gives the stated total. A percentage-full figure is only meaningful if its storage definition and reference capacity are identified.
Why published numbers can differ
Older descriptive pages report different capacities. Differences can reflect survey revisions and the level or storage category being described. The 2026 report says the revised capacity is likely linked to sedimentation and improved survey accuracy and resolution; it does not support assigning the whole difference to sediment alone.
Surface elevation is not water depth. Elevation locates the water surface relative to a vertical reference system, while depth measures downward to the bottom at a particular place. A changing shoreline or a depth sounding therefore answers a different question from a reservoir-level reading.
3. Parker Dam changed a river reach into a reservoir
The Bureau of Reclamation built Parker Dam during 1934–1938. By holding back the Colorado River, it created a pool from which water could be diverted and used within a much larger managed river system. The long reservoir follows the river corridor rather than forming an isolated natural lake unrelated to upstream and downstream flow.
Water storage, diversion and power generation are connected functions, but they are not identical. Storage is the water held at a given time. Diversion moves water into another delivery system. Hydroelectric generation uses water passing through turbines. A reservoir description should say which function a number measures instead of using annual deliveries as though they were the volume sitting in the lake.
The dam’s depth is not the lake’s depth
Parker Dam is often described as exceptionally deep because much of its structure extends below the original riverbed to its foundation. Reclamation reports a structural height of 320 feet (98 meters), with most below that former bed. That is not a claim that Lake Havasu is 320 feet deep. Foundation depth, dam height and water depth are separate measurements.
This is also why a photograph of the visible dam can be misleading as a scale reference. The portion above the former riverbed is only part of the engineering structure. Conversely, a large structural dimension does not tell a swimmer, boater or researcher the depth at an arbitrary point in the reservoir.
4. Two water-delivery systems begin at Lake Havasu
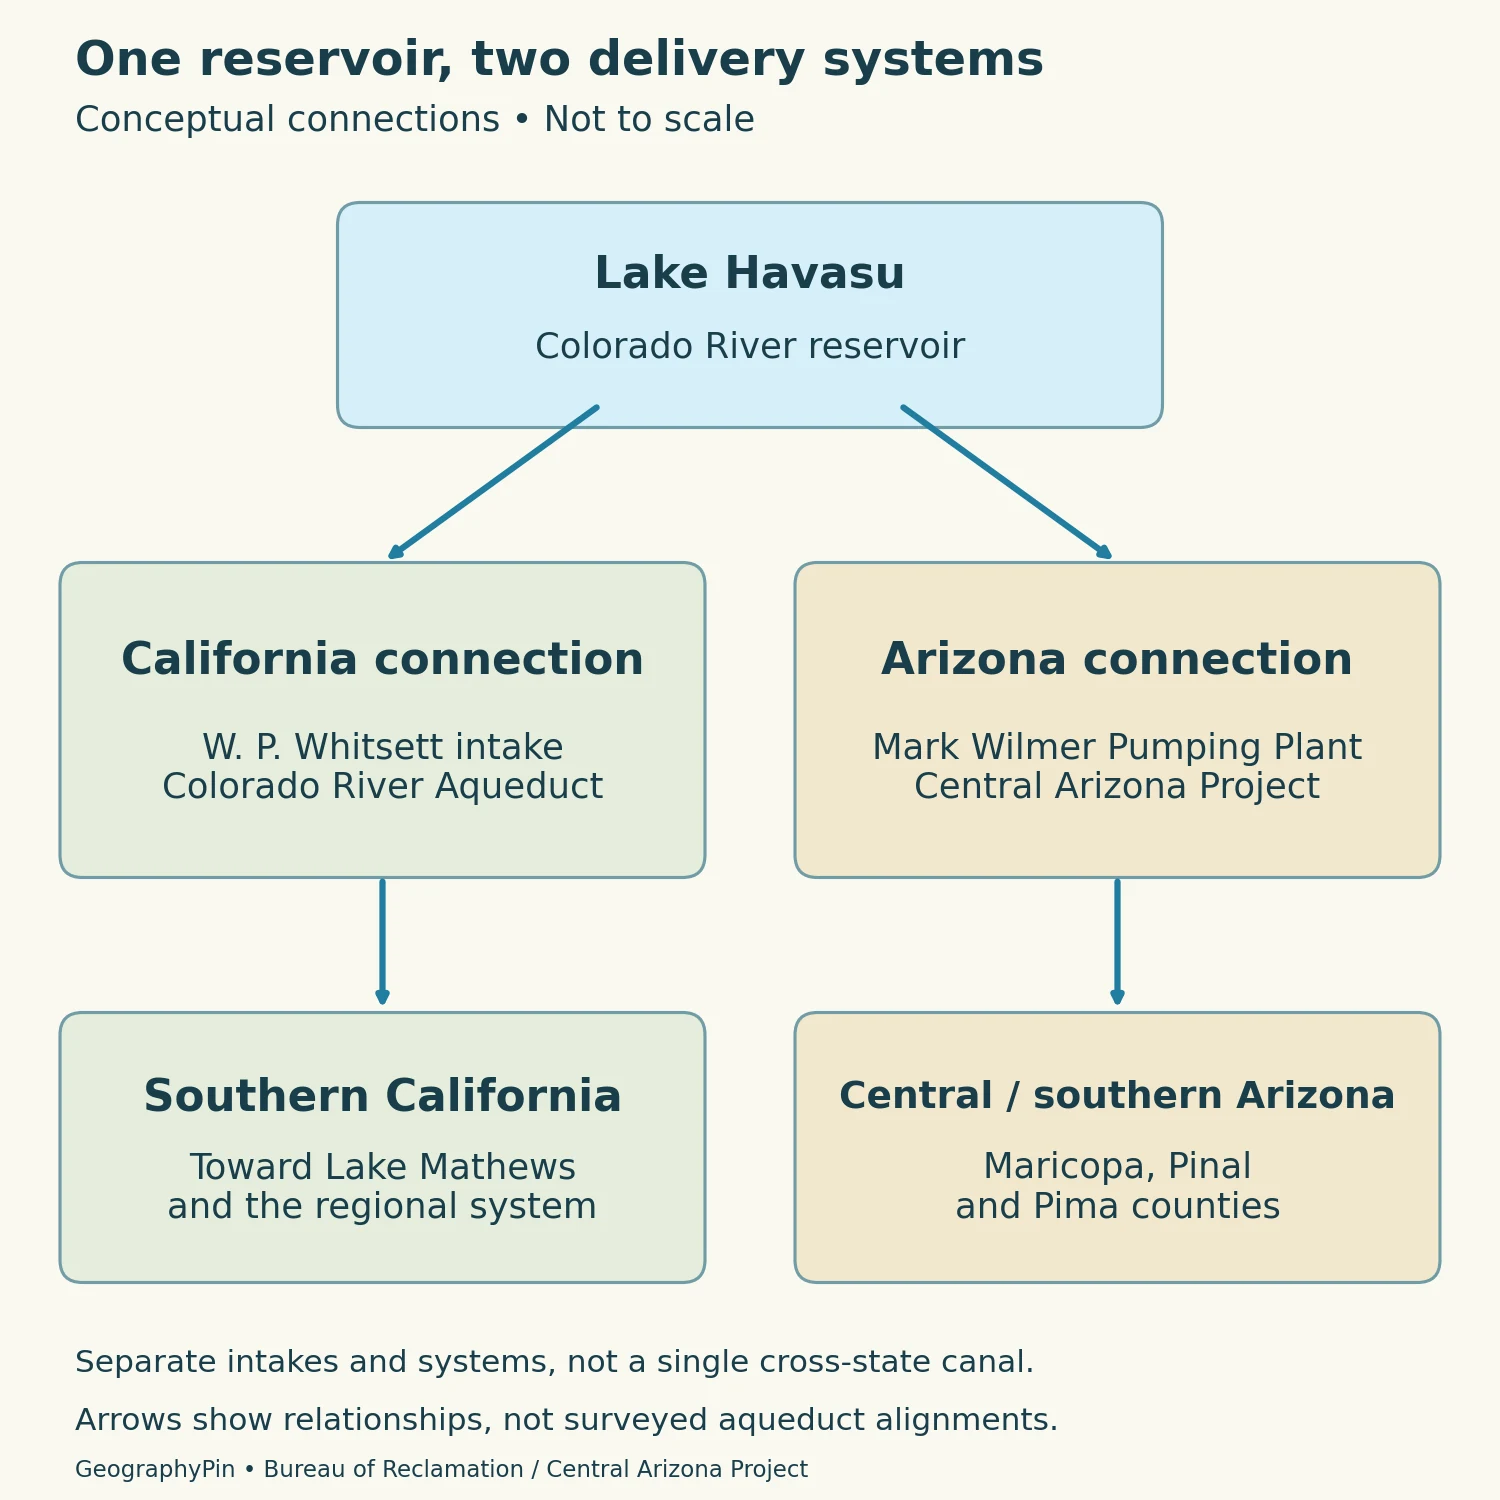
Lake Havasu serves as an intake location for two distinct systems. The Metropolitan Water District of Southern California pumps water into the Colorado River Aqueduct. The Central Arizona Project draws water into its own system for delivery in Arizona. They share a source reservoir, not a single continuous canal running through both service regions.
The California connection
Reclamation identifies the W. P. Whitsett Intake Pumping Plant on the lake upstream of Parker Dam. From the intake, the Colorado River Aqueduct extends toward Lake Mathews near Riverside, supplying Southern California. The name “Colorado River Aqueduct” refers to this engineered conveyance system, not to the natural downstream river channel.
The Arizona connection
The Central Arizona Project identifies Mark Wilmer Pumping Plant as the point where Colorado River water enters its system from Lake Havasu. Pumps, tunnels and other works convey that water toward users in Maricopa, Pinal and Pima counties. The system must lift water as it crosses the landscape; a canal route does not simply follow the nearest downhill stream valley.
This distinction helps explain why a reservoir in western Arizona matters to communities far from its shoreline. The regional water-supply geography extends across drainage divides through engineered works. A schematic destination arrow can explain that relationship, but it is not a surveyed canal alignment or a map of every customer receiving water.
5. River-mouth habitat within a desert setting
The surrounding dry landscape does not mean that the shoreline is ecologically uniform. Open water, river channels, marshes and vegetated tributary margins provide different environments. The Bill Williams River mouth is especially useful for seeing the contrast between a river corridor and nearby desert terrain.
The U.S. Fish and Wildlife Service describes cottonwood-willow habitat along the Bill Williams River and manages a refuge encompassing part of that river environment. Farther north, Havasu National Wildlife Refuge protects another portion of the lower Colorado corridor. These are distinct protected areas, not alternative names for the entire reservoir.
The water-supply map and the habitat map therefore emphasize different features. An intake may matter most to a delivery system; a tributary mouth or quiet backwater may be more important when interpreting vegetation and wildlife habitat. Neither map alone captures all the uses of the same landscape.
6. Use the correct shore and current access information
Planning a visit begins with identifying the specific destination, not simply typing the lake’s name. Lake Havasu City provides an Arizona-side reference point, but shoreline facilities and managed lands extend beyond it. Crossing to another shore or traveling to the dam is a different trip from reaching the city waterfront.
The Bureau of Land Management provides a Lake Havasu visitor map and information about shoreline sites. It also emphasizes aquatic-invasive-species precautions, including cleaning and draining equipment before moving between waters. Use the current instructions of the relevant land manager for the facility or activity you intend to use.
Our geographic maps do not establish launch opening hours, boating clearances, fishing permissions or access through water-supply facilities. Reservoir conditions and local restrictions can change. A state label on a map is useful orientation, but it is not a substitute for the rules applying at a particular site.
What Did We Learn Today?
Lake Havasu is a Colorado River reservoir shared by Arizona and California, not simply another name for Lake Havasu City. Parker Dam created the pool, while separate pumping systems carry water toward Southern California and central and southern Arizona. Survey date, reference elevation and storage definition explain its numerical facts; tributary habitats and distinct shore destinations explain why the lake is more varied than a single blue patch on a map.
Sources & Data Notes
The table uses the 2022 survey values published in Reclamation’s January 30, 2026 study, at the stated Parker Project Vertical Datum elevation. Surface area is rounded; Table 5 and the executive summary give slightly different area figures; this table follows Table 5 and rounds to about 19,800 acres. None of these figures is a current reservoir observation. Total, live and dead storage are distinct quantities.
- Bureau of Reclamation: Parker Dam overview
- Bureau of Reclamation: Parker Dam technical profile
- Bureau of Reclamation: January 2026 area-capacity survey study
- National Park Service: Parker Dam history
- Central Arizona Project: system
- Bureau of Land Management: Lake Havasu
- USFWS: Bill Williams River refuge
- USFWS: Havasu refuge
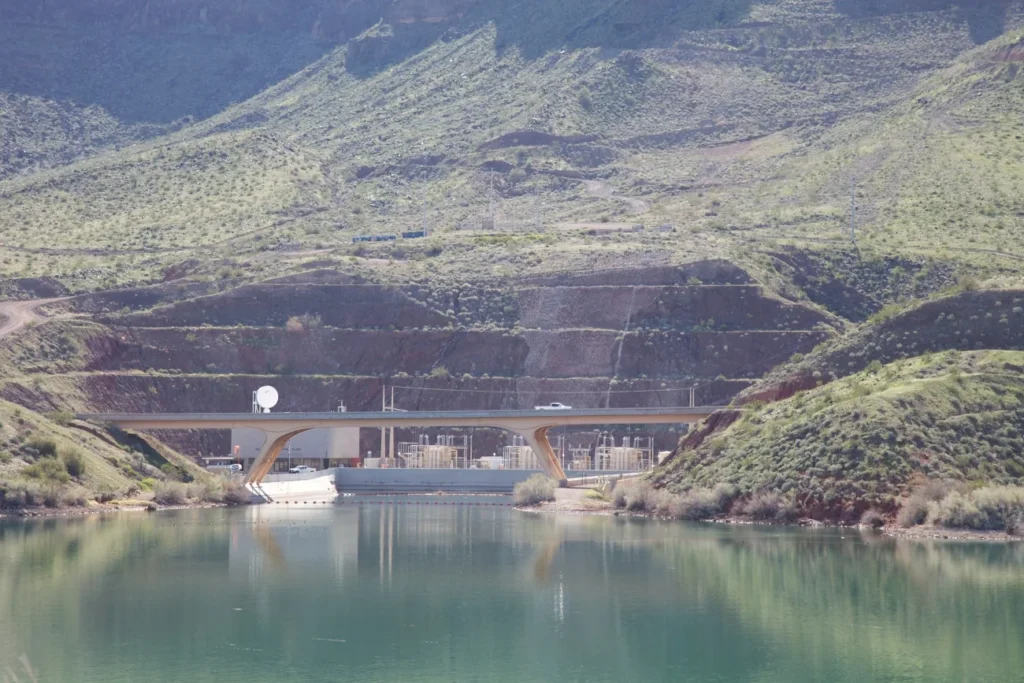
Featured photo: Pumping plant and bridge at Lake Havasu, Ryan Hagerty/USFWS, March 3, 2010, public domain. Converted to WebP.
Maps and diagram by GeographyPin. The locator uses actual USGS National Hydrography Dataset waterbody and river geometry, with generalized U.S. Census state boundaries. The city marker is a Census incorporated-place reference point, not a city boundary. Parker Dam is located using Reclamation’s published coordinates. The shoreline is not a measurement of present reservoir level. The separate water-transfer diagram explains the two systems using Reclamation and Central Arizona Project sources; its arrows are conceptual, not surveyed aqueduct alignments.