Lake Erie looks broad and continuous on a map, but its shallow western waters and deeper eastern basin behave differently. Understanding those contrasts makes its islands, river connections and water-quality headlines much easier to place in context.
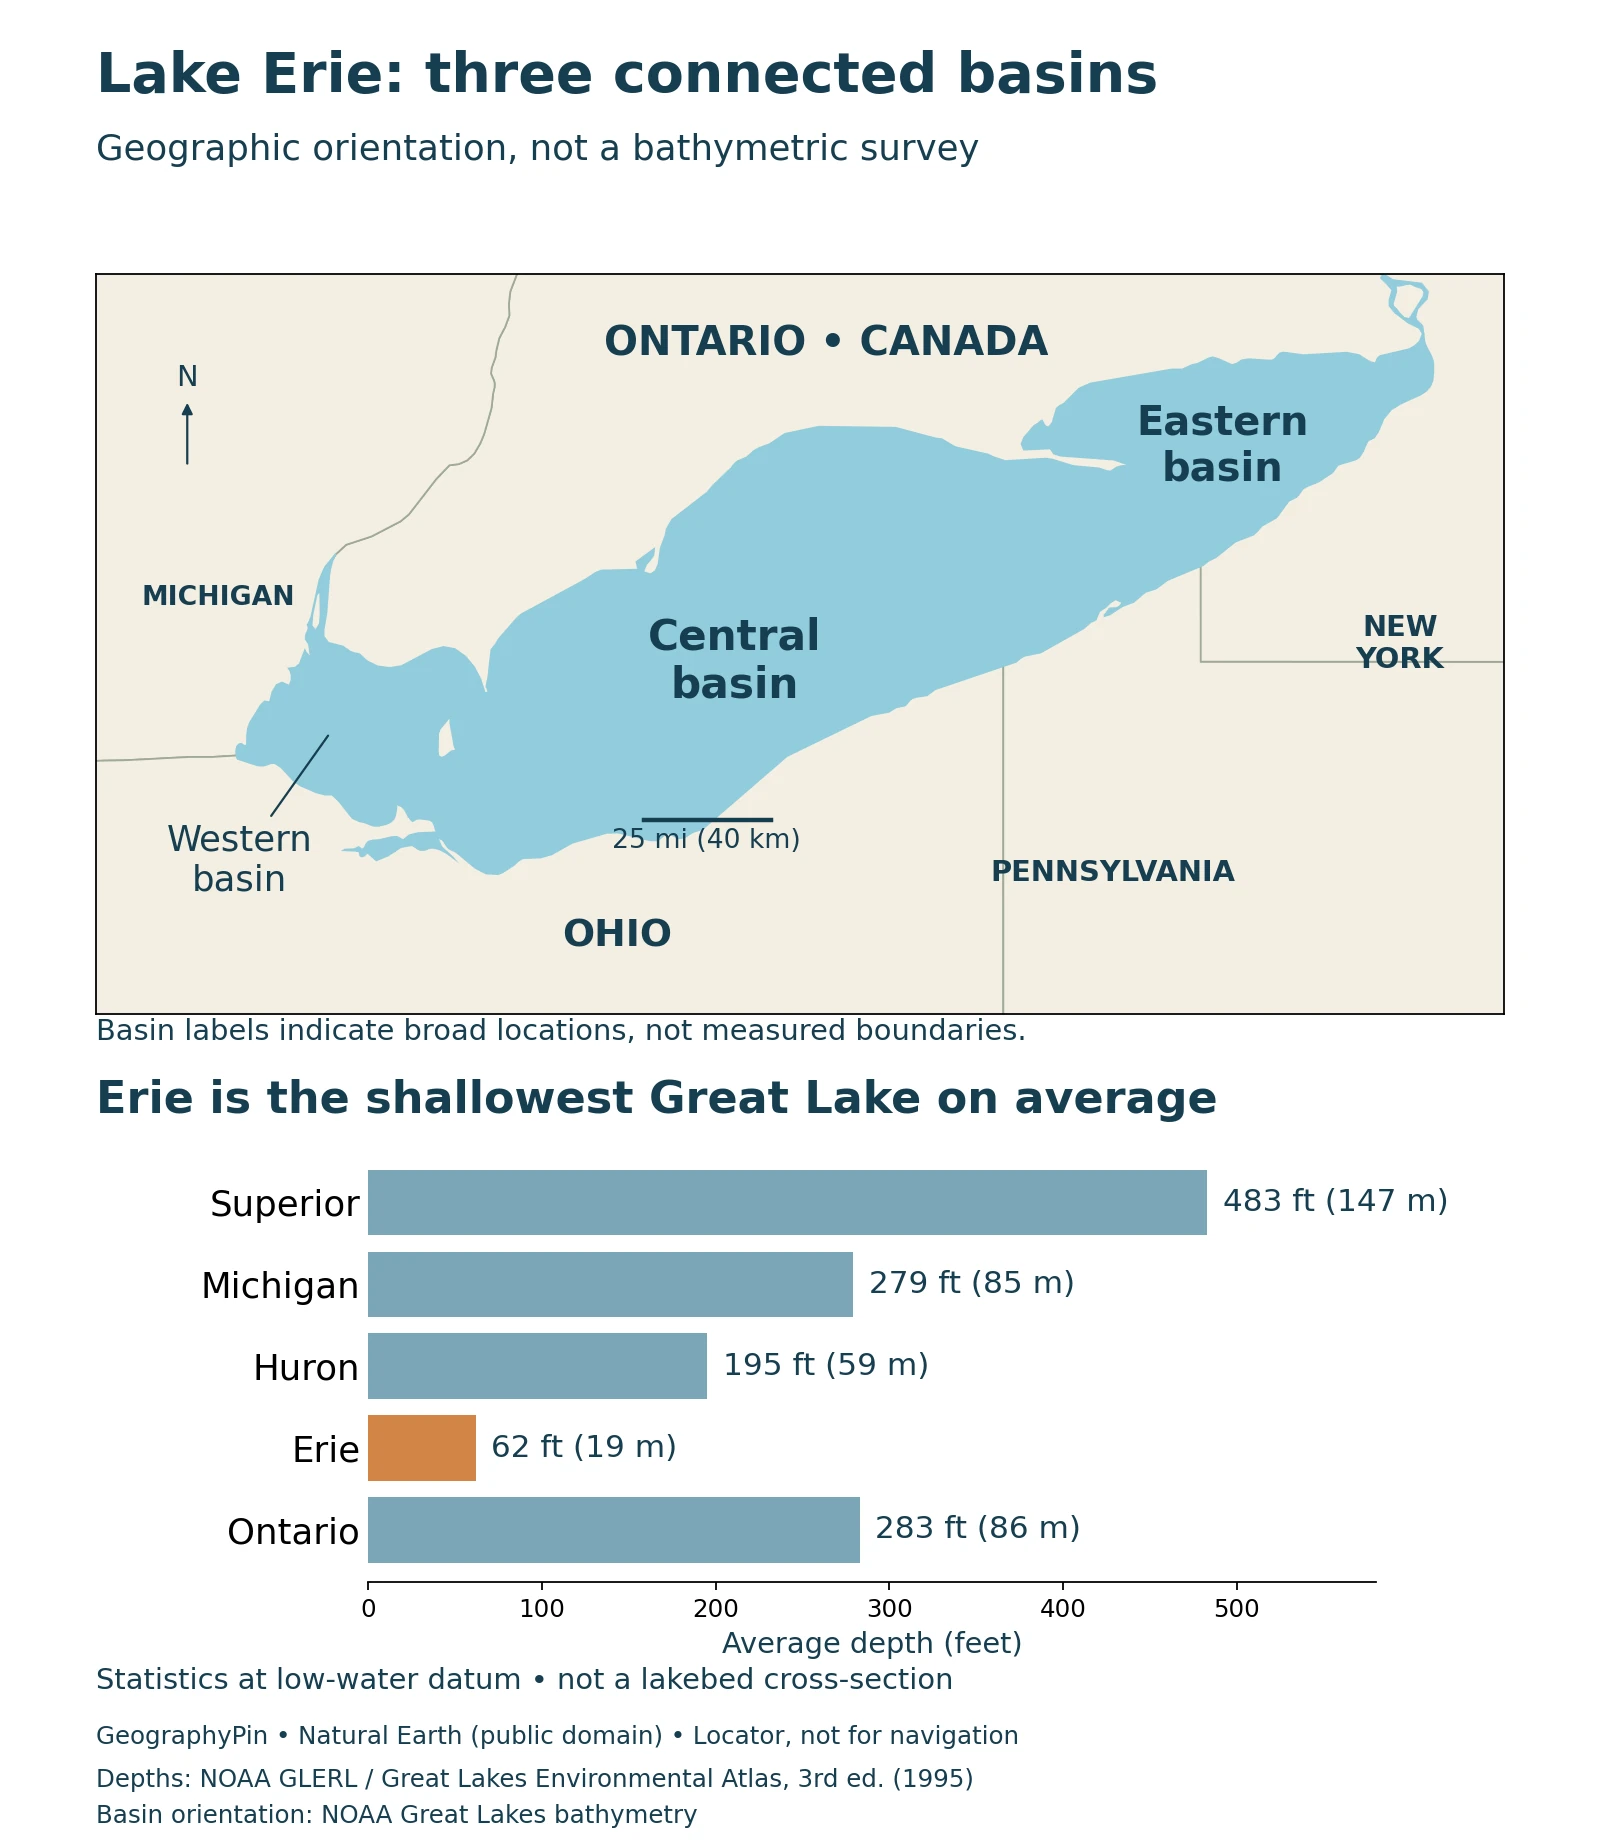
Lake Erie borders Ontario and four U.S. states: Michigan, Ohio, Pennsylvania and New York. It is the shallowest Great Lake, with an average depth of about 62 feet (19 meters). Water enters mainly through the Detroit River and leaves principally through the Niagara River toward Lake Ontario.
How to use this article: Find the shoreline, compare area and depth, explore the three basins, or distinguish blooms from oxygen depletion.
1. Where Is Lake Erie?
Lake Erie lies between the United States and Canada in the southern part of the Great Lakes system. Ontario borders its northern shore. Michigan, Ohio, Pennsylvania and New York border the American side, from the western end around the southern shore to the east.
One lake between two countries
The shoreline stretches across several familiar regions: the western island area, Ohio’s long lakefront, Pennsylvania’s short stretch around Erie, and the eastern end near Buffalo. Ontario faces these shores across the water. The lake’s long west-to-east shape helps explain why conditions at one end need not match those at the other.
On a wider Great Lakes map, Erie sits downstream of Lake Huron and upstream of Lake Ontario. It is not connected directly to Huron by one uninterrupted lake surface: the St. Clair River, Lake St. Clair and Detroit River form the intervening water route.
2. How Deep and Large Is Lake Erie?
Erie is the shallowest of the five Great Lakes and holds the least water by volume. That does not make it a small lake: its surface covers thousands of square miles. Area and depth answer different questions, and a broad, shallow basin can have less water than a narrower, deeper one.
Size and depth in one reference series
The figures below come from NOAA CoastWatch’s physical-characteristics table, based on the 1995 third edition of the Great Lakes Environmental Atlas. They are reference dimensions, not a new survey or today’s water-level readings.
| Measurement | Reference value | Meaning |
|---|---|---|
| Surface area | 9,910 square miles (25,700 km²) | Water surface, not surrounding drainage land |
| Average depth | 62 feet (19 meters) | Mean across the lake |
| Maximum depth | 210 feet (64 meters) | Deepest reference value, not average depth |
| Volume | 116 cubic miles (484 km³) | Water held in the basin |
NOAA ties the depth and volume values to Low Water Datum, a reference level. The paired units are reproduced as published. Actual water levels vary, and a depth at a particular location requires a suitable chart and current information.
The comparison graphic uses average depth for every lake. Comparing Erie’s average with another lake’s maximum would exaggerate the difference. Even a correctly labeled average does not tell a swimmer or boat operator how deep a particular shoreline location is.
3. Why Erie Has Three Different Basins
Lake Erie’s bottom is not a uniformly shallow platform. Its western, central and eastern basins have different shapes and depths. Geological history explains part of that pattern: glaciers excavated older bedrock valleys, while deposits left beneath and around the ice helped shape the resulting landscape.
Shallow west, deeper east
EPA’s physical-process summary gives the western basin an average depth of about 24 feet (7.4 meters), the central basin about 60 feet (18.3 meters), and the eastern basin about 80 feet (24 meters). These basin means are distinct from the whole-lake average.
The western basin is shallow enough for waves to disturb fine bottom sediment readily. The central basin has a relatively even floor, while the eastern basin contains the lake’s deepest water. Shallow does not mean perfectly flat: NOAA’s bathymetric account identifies a deeper pocket near the western islands, so a broad description of the western floor should not be treated as an absolute depth limit.
After the glaciers retreated, sediment deposition and currents continued to modify the bottom. Dredging has also changed particular areas. A shoreline locator cannot show those details, and the broad basin names on our map are not substitutes for surveyed depth contours.
4. How Water Moves Through Lake Erie
The Detroit River brings water into Erie’s western end after it passes through Lake St. Clair. At the eastern end, the Niagara River carries water toward Lake Ontario. Niagara Falls lies on that downstream river, not between the three basins within Lake Erie.
River connections and the shipping bypass
The Welland Canal provides another connection between Erie and Ontario, allowing vessels to bypass Niagara Falls. NOAA’s physical-characteristics table lists both the Niagara River and Welland Canal as outlets. A natural drainage route and an engineered navigation route therefore need to be distinguished when reading a Great Lakes map.
The Detroit River supplies most of Erie’s incoming water, but smaller tributaries still matter. A river’s share of water volume does not by itself determine its contribution of sediment or nutrients. For example, the Maumee River is particularly important to western-basin phosphorus loading even though it is not the lake’s largest water inflow.
The lake is also part of a larger upstream system. A drainage-area figure that includes the St. Clair–Detroit system answers a different question from the land draining directly into Erie. Always check the boundary used before comparing watershed sizes.
5. Water Quality Depends on Place and Process
Lake Erie’s environmental challenges are not one uniform condition. EPA distinguishes western-basin cyanobacterial blooms, seasonal loss of oxygen near the central basin’s bottom, and nuisance growth of attached algae in the eastern basin. They are related to nutrient conditions, but they occur through different processes.
A bloom is not the same as low bottom-water oxygen
In summer, warmer surface water can form a layer above colder, denser water. This seasonal layering influences the supply of oxygen to deeper water. It is generally more persistent in the central and eastern basins than in the shallow west.
For western harmful algal blooms, EPA identifies springtime soluble phosphorus delivered by the Maumee River as an important predictor of summer bloom severity. A severity estimate describes the scale of a bloom, not a measured toxin concentration at every beach. Likewise, oxygen depletion at depth does not mean the entire lake has no oxygen.
These distinctions make a lakewide label such as “safe,” “unsafe” or “dead” unhelpful for planning a particular visit. A dated monitoring result needs its location and measured variable: nutrients, algal biomass, toxins and dissolved oxygen are not interchangeable observations.
6. Reading the Shore Before a Visit
The same lake includes open beaches, sheltered island waters, busy harbors and developed waterfronts. The general geography helps you understand the setting; it cannot establish access rights, water conditions or the status of a particular facility.
Use local warnings, not an old photograph
Check the relevant beach authority’s current notices and the National Weather Service’s Great Lakes beach forecasts before entering the water. Freshwater can still have breaking waves and dangerous currents, especially near structures and river mouths. Follow posted restrictions and lifeguard guidance where available.
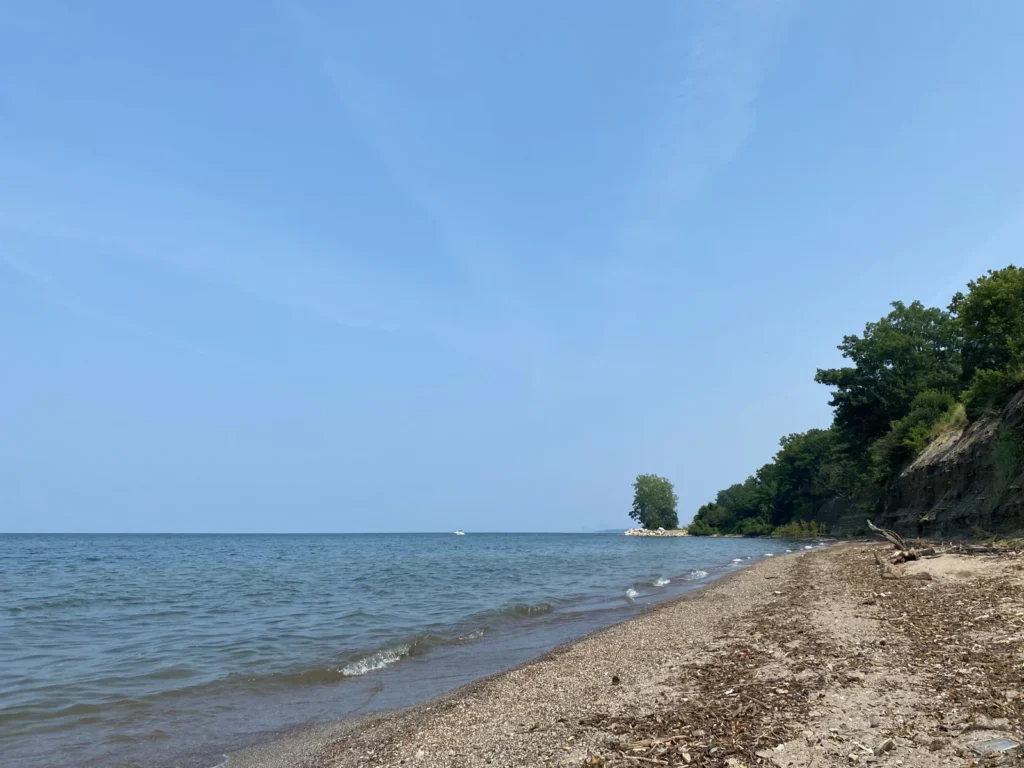
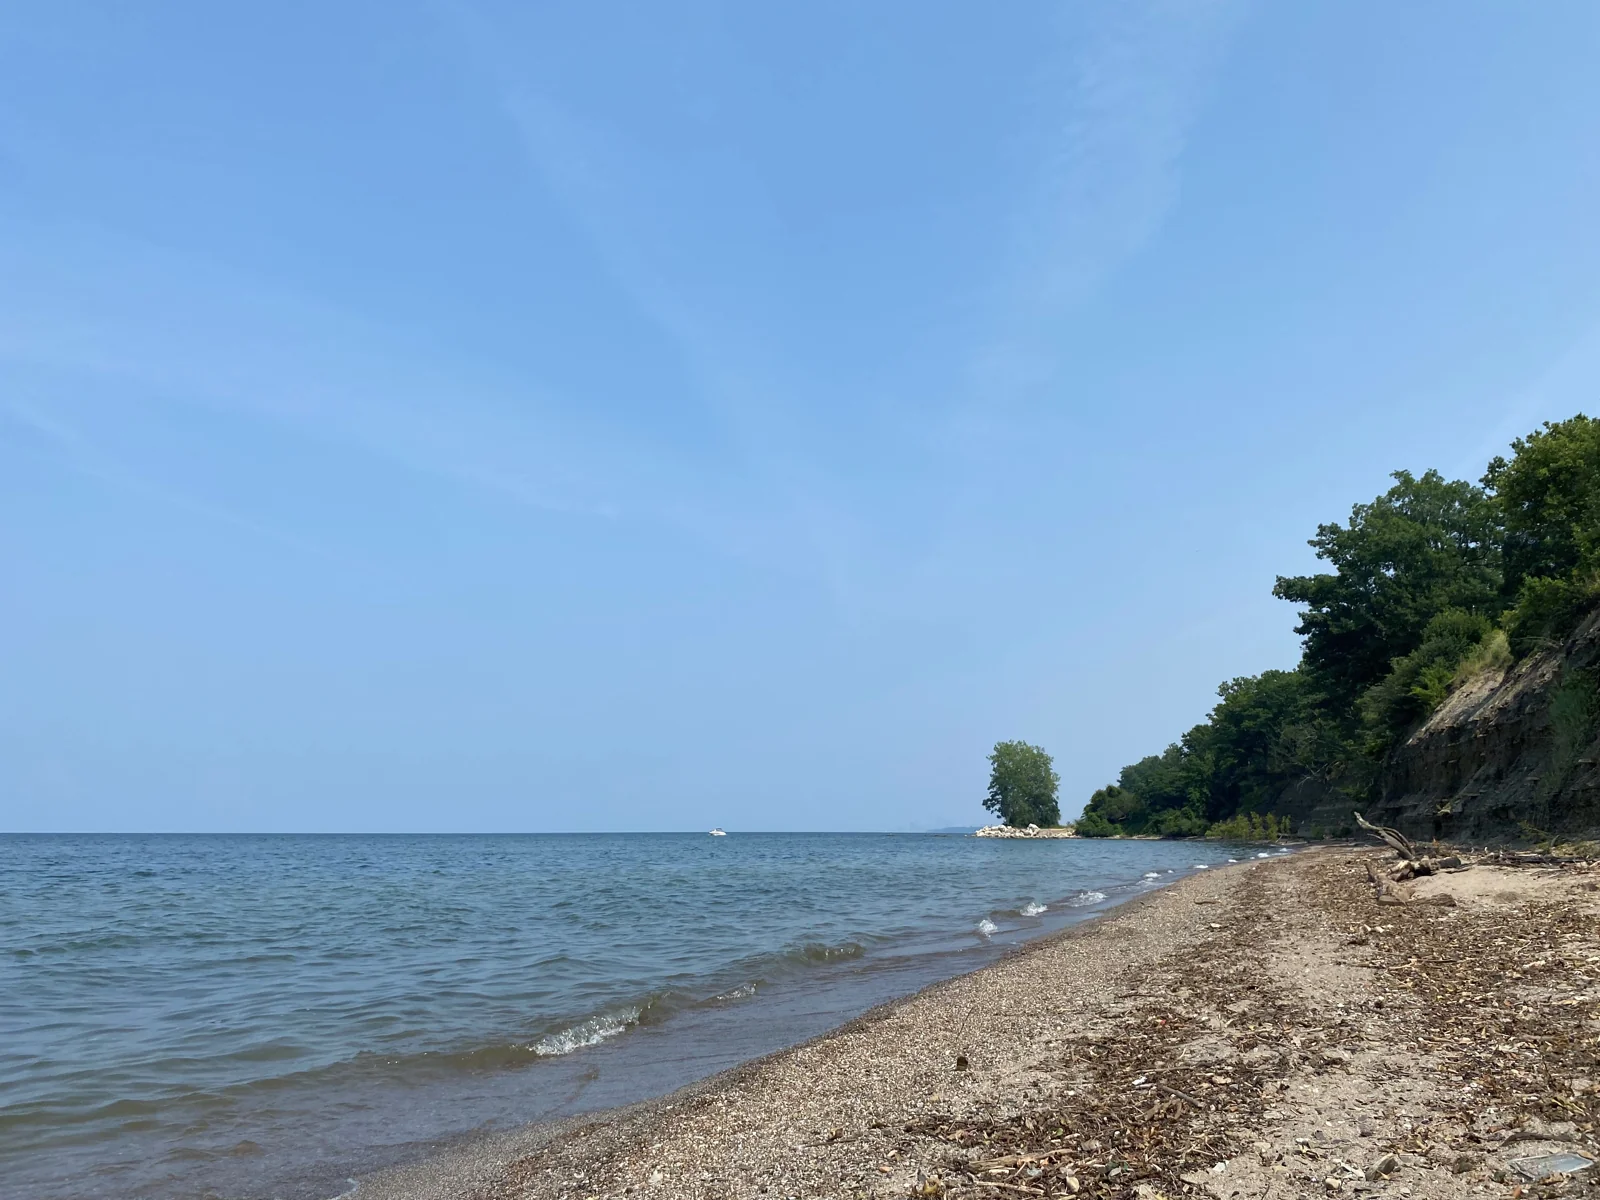
The photograph below records one Ohio shoreline on one day. Neither its appearance nor an older bloom map certifies conditions for another visit. The locator above is intended for geographical orientation, not navigation.
What Did We Learn Today?
Lake Erie is a large international lake with a shallow overall basin, but its western, central and eastern sections differ. Its Detroit–Niagara connections place it within the wider Great Lakes system. Depth, seasonal layering and nutrient inputs help explain why water conditions must be understood by place and process rather than through a single lakewide label.
Sources & Data Notes
The main table and comparison bars use NOAA’s 1995 atlas-based series, with paired units reproduced as published. Depth and volume refer to Low Water Datum, not current conditions. Basin means are separately attributed to EPA. The map uses generalized Natural Earth outlines; basin labels indicate broad regions without surveyed dividing lines. Its national boundary within the lake is not depicted. The depth bars share a zero baseline and are not bathymetric profiles.
- NOAA CoastWatch: atlas-based dimensions, reference datum and outlets
- EPA: three basin depths and seasonal layering
- NOAA: Lake Erie and Lake St. Clair bathymetry and geological development
- Canadian Hydrographic Service: Great Lakes river connections
- EPA: phosphorus loading, blooms, hypoxia and attached algae
- National Weather Service: Great Lakes beach hazards
- National Weather Service: beach forecasts