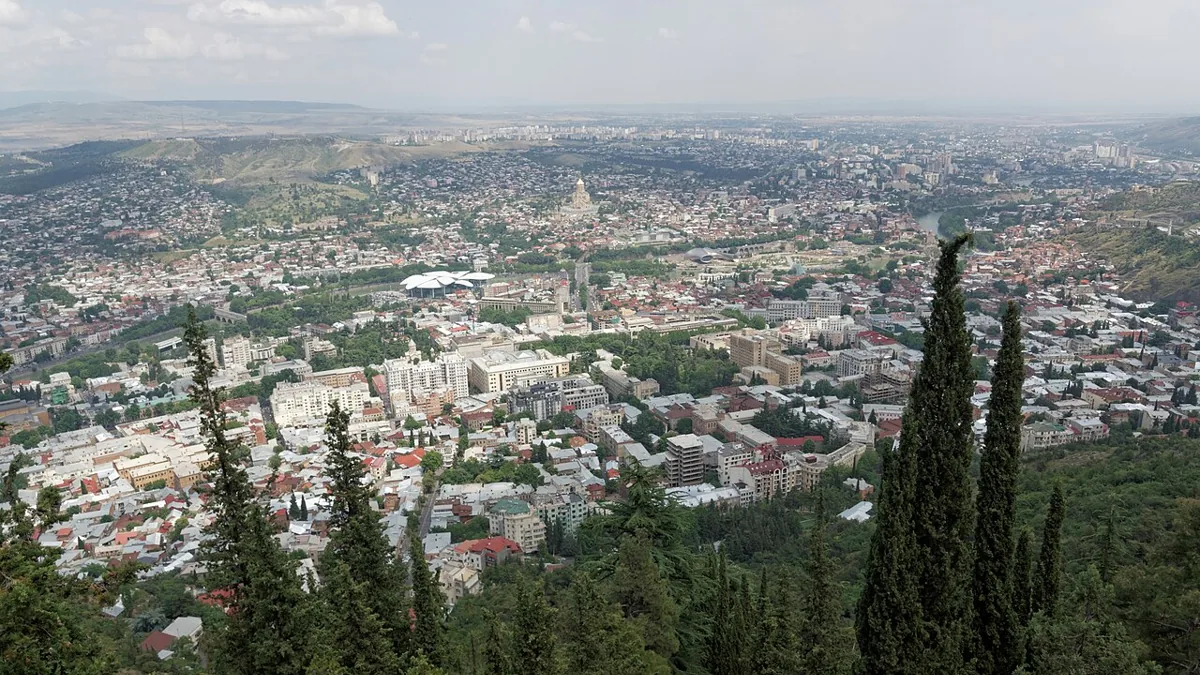
A warm afternoon in Tbilisi does not tell you whether the Black Sea coast will be dry or a mountain trail will be snow-free. This guide compares three weather stations in Georgia, the country: Tbilisi, Kobuleti and Borjomi. It is a planning baseline, not a forecast.
Georgia’s weather varies sharply between destinations. Tbilisi has hot summer afternoons, Kobuleti on the Black Sea coast is much wetter, and Borjomi has colder winter nights. Spring and autumn can suit city sightseeing, while summer is generally more useful for high-mountain trips. Monthly climate averages describe past patterns, not guaranteed conditions on your travel dates.
Plan your comparison: start with what the stations represent, read Tbilisi’s monthly table, or check why mountain access needs a separate check.
1. Read the Climate Numbers Correctly
Three stations, not one national average
The tables use Georgia’s station submissions to the World Meteorological Organization’s 1991–2020 climate-normal collection, archived by NOAA NCEI. Tbilisi station is at about 1,417 feet (432 meters), Kobuleti at 16 feet (5 meters), and Borjomi at 2,591 feet (790 meters). The archive spells Kobuleti “Qobuleti.” These are station elevations, not the elevation of every neighborhood or nearby attraction.
Kobuleti provides a specific Black Sea coastal comparison. It is not a Batumi station, and its values should not be relabeled as Batumi weather. Borjomi supplies a higher-elevation inland comparison, but it is not a substitute for the high Caucasus, Gudauri or a hiking pass. Even within one destination, exposure and elevation can change conditions.
“Average high” means the long-term average of daily maximum temperatures for that month. “Average low” means the corresponding average of daily minima. Neither is an extreme-temperature record. Precipitation is the average monthly total, not the number of rainy days or the likelihood of rain on a particular day.
The reference period is 1991–2020. Available years differ: all selected Tbilisi monthly values use 30 years; Kobuleti uses 29–30; Borjomi uses 26–28. The tables preserve the published normals rather than filling gaps or pretending every station has identical coverage. Actual weather can be warmer, colder, wetter or drier.
2. Monthly Weather Tables for Three Destinations
Each table gives U.S. customary units first, with metric equivalents in parentheses. Temperatures are rounded to whole degrees Fahrenheit; the source’s Celsius values are retained to one decimal. Precipitation is rounded to two decimal inches and retains the source millimeters. Small apparent differences can reflect rounding.
Tbilisi weather by month
| Month | Average high °F (°C) | Average low °F (°C) | Precipitation inches (mm) |
|---|---|---|---|
| Jan | 45 (7.1) | 31 (-0.4) | 0.65 (16.4) |
| Feb | 48 (8.7) | 33 (0.3) | 0.72 (18.2) |
| Mar | 56 (13.5) | 39 (3.8) | 1.15 (29.1) |
| Apr | 66 (18.8) | 46 (8.0) | 2.51 (63.8) |
| May | 75 (23.9) | 55 (12.9) | 3.26 (82.9) |
| Jun | 84 (28.7) | 63 (17.1) | 3.31 (84.0) |
| Jul | 89 (31.7) | 68 (20.1) | 1.64 (41.6) |
| Aug | 89 (31.9) | 68 (20.0) | 1.55 (39.4) |
| Sep | 80 (26.7) | 61 (15.9) | 1.37 (34.8) |
| Oct | 68 (20.2) | 51 (10.6) | 1.82 (46.3) |
| Nov | 55 (13.0) | 40 (4.6) | 1.35 (34.2) |
| Dec | 47 (8.2) | 34 (0.9) | 0.82 (20.8) |
Kobuleti weather by month
| Month | Average high °F (°C) | Average low °F (°C) | Precipitation inches (mm) |
|---|---|---|---|
| Jan | 51 (10.8) | 37 (2.6) | 9.37 (237.9) |
| Feb | 52 (11.2) | 37 (2.8) | 6.93 (175.9) |
| Mar | 57 (13.7) | 41 (5.1) | 6.92 (175.8) |
| Apr | 63 (17.1) | 46 (7.9) | 3.72 (94.6) |
| May | 70 (21.1) | 54 (12.5) | 3.31 (84.1) |
| Jun | 77 (25.2) | 63 (17.0) | 6.60 (167.6) |
| Jul | 82 (27.6) | 68 (19.8) | 7.58 (192.6) |
| Aug | 83 (28.3) | 69 (20.3) | 9.48 (240.9) |
| Sep | 78 (25.6) | 62 (16.4) | 12.16 (308.9) |
| Oct | 71 (21.7) | 54 (12.1) | 12.52 (318.1) |
| Nov | 62 (16.6) | 44 (6.8) | 10.04 (255.1) |
| Dec | 55 (12.7) | 39 (3.9) | 10.63 (269.9) |
Borjomi weather by month
| Month | Average high °F (°C) | Average low °F (°C) | Precipitation inches (mm) |
|---|---|---|---|
| Jan | 41 (4.9) | 25 (-4.1) | 1.46 (37.2) |
| Feb | 45 (7.0) | 26 (-3.6) | 1.38 (35.0) |
| Mar | 54 (12.2) | 32 (-0.1) | 1.94 (49.3) |
| Apr | 63 (17.3) | 39 (4.0) | 2.14 (54.4) |
| May | 71 (21.6) | 48 (8.9) | 3.61 (91.7) |
| Jun | 78 (25.8) | 55 (12.8) | 2.60 (66.1) |
| Jul | 83 (28.4) | 60 (15.8) | 1.81 (46.0) |
| Aug | 85 (29.5) | 60 (15.4) | 1.56 (39.5) |
| Sep | 76 (24.5) | 52 (11.2) | 2.01 (51.0) |
| Oct | 66 (19.0) | 44 (6.4) | 2.44 (61.9) |
| Nov | 52 (11.3) | 33 (0.8) | 2.26 (57.5) |
| Dec | 43 (6.2) | 27 (-2.9) | 1.49 (37.9) |
Download the monthly climate data, including the number of years contributing to each parameter. Keep the station name and reference period with any reused figures.
3. What the Seasonal Differences Mean for a Trip
Summer heat is not the same everywhere
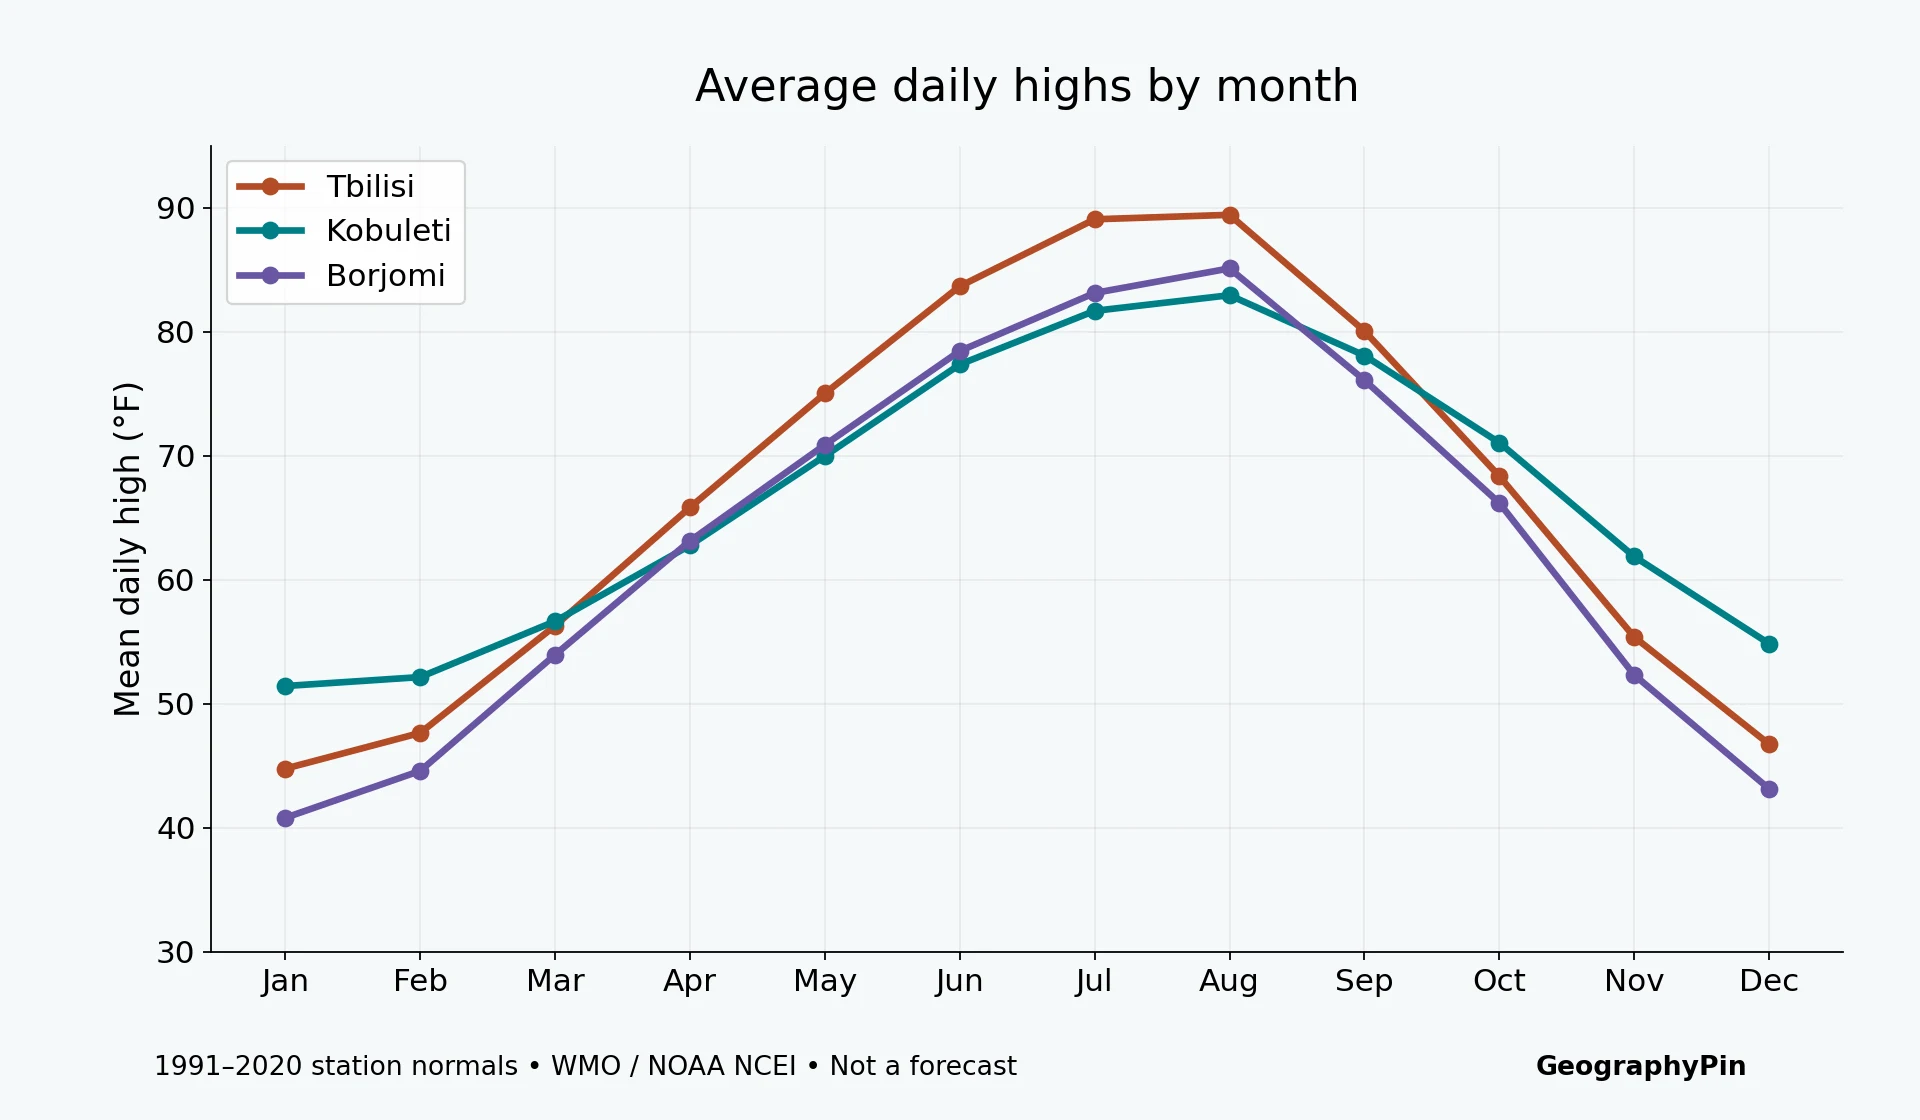
Tbilisi’s average daily high reaches about 89°F (31.7°C) in July and 89°F (31.9°C) in August. Kobuleti’s corresponding averages are about 82°F (27.6°C) and 83°F (28.3°C). This does not mean the coast is always cool: the comparison is air temperature, not a calculation of humidity, heat stress or beach comfort.
Borjomi’s August average high is about 85°F (29.5°C), despite its greater station elevation. Its average low is much cooler, about 60°F (15.4°C). Elevation alone does not determine a destination’s entire climate, and a pleasant evening does not guarantee a cool afternoon.
The Black Sea coast is a different precipitation story
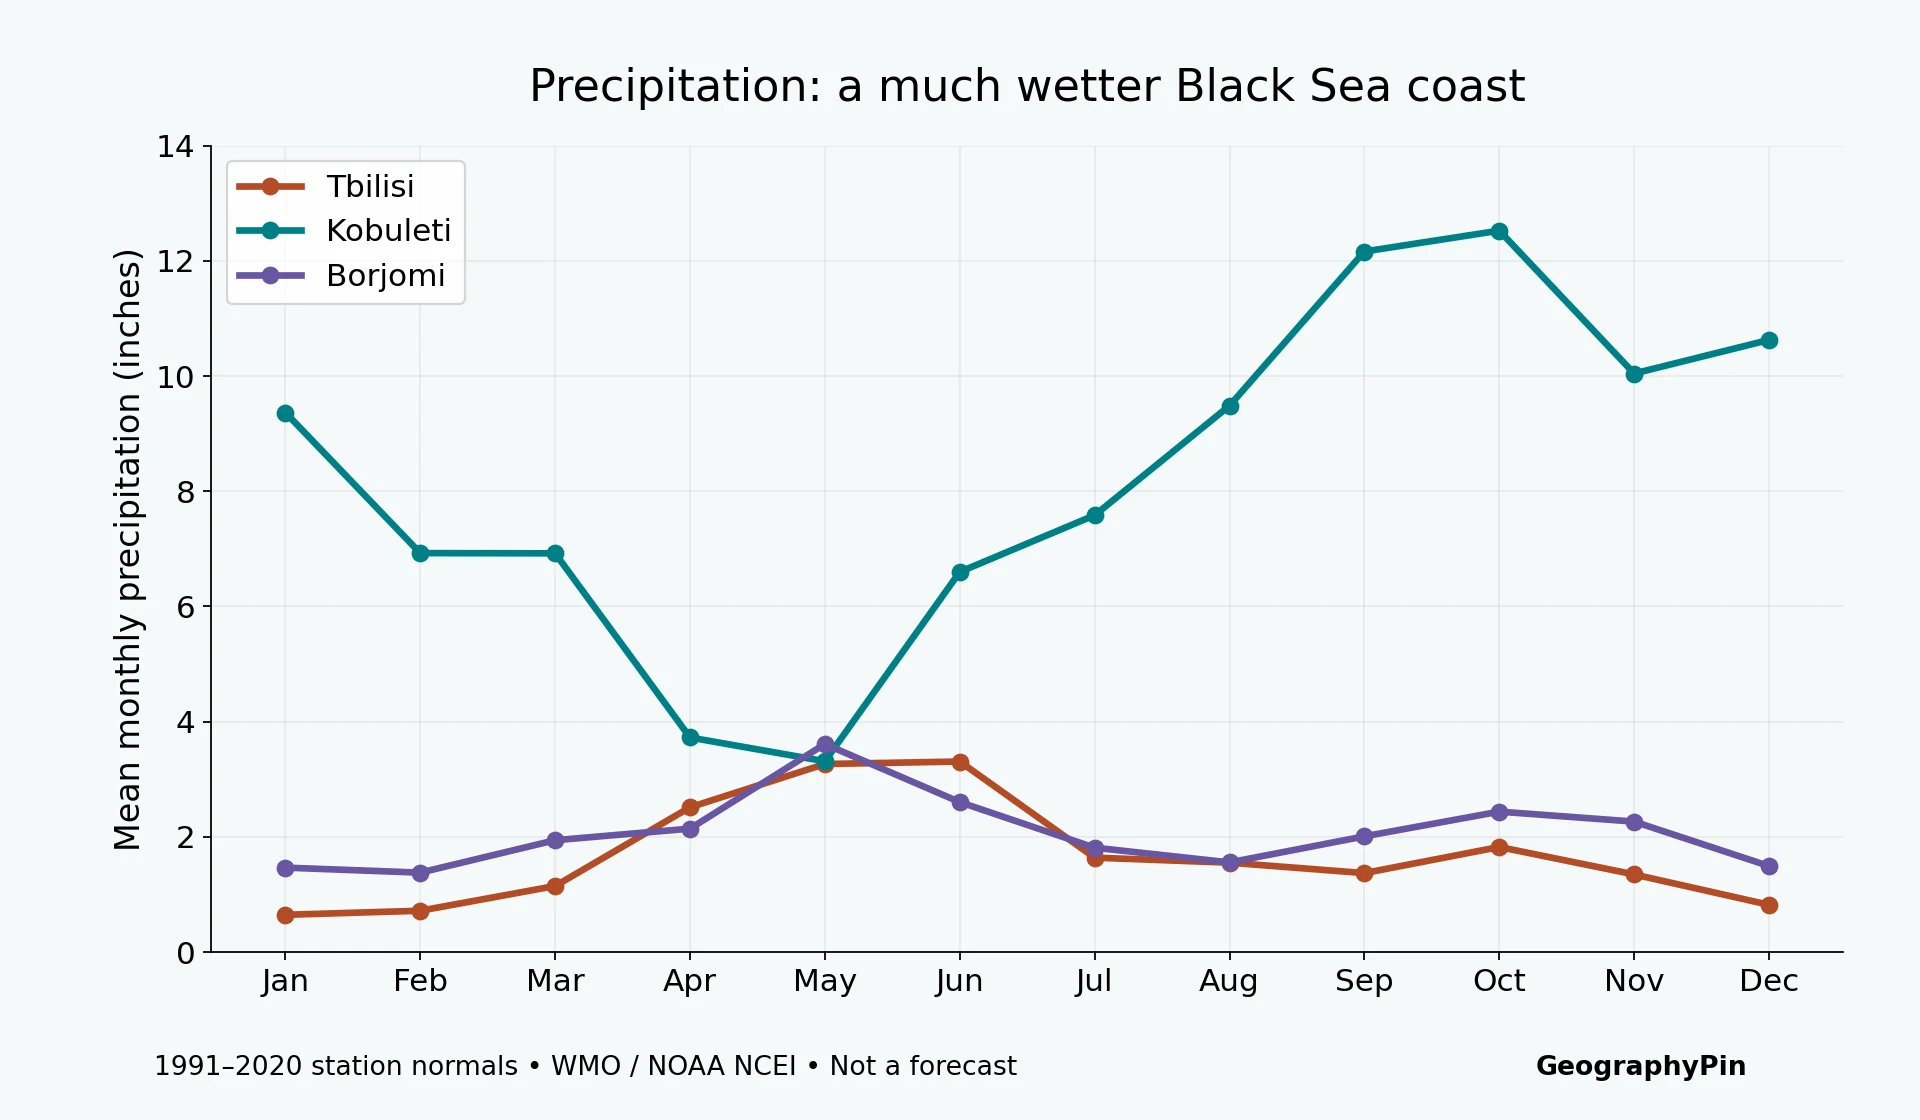
The Kobuleti station records higher monthly precipitation normals than Tbilisi in every month in this dataset. October averages 12.52 inches (318.1 mm), compared with 1.82 inches (46.3 mm) in Tbilisi. Even Kobuleti’s driest normal month, May, averages 3.31 inches (84.1 mm). A coastal itinerary needs a rain plan, not an assumption that summer means reliably dry weather.
Tbilisi’s highest monthly precipitation normal is June, at 3.31 inches (84.0 mm). Its September normal is lower, at 1.37 inches (34.8 mm). These values help compare seasonal patterns, but a monthly total cannot tell you whether rain typically falls in short showers, prolonged spells or during your particular visit.
4. Choose Your Dates Without Overreading the Averages
For city sightseeing, compare spring and autumn first
Georgia’s official tourism guidance points travelers toward spring and autumn for cultural and historical sightseeing. The station data explain why those seasons deserve consideration without creating a single “perfect month.” Tbilisi’s May average high is about 75°F (23.9°C), while September averages about 80°F (26.7°C). October is cooler, with an average high near 68°F (20.2°C), but evenings are cooler too.
Choose according to the trip you actually want. A mostly urban route can tolerate a different mix of heat, rain and daylight than a multi-day trek. Use our Georgia travel guide for route planning and the Tbilisi guide for a city-focused visit.
High-mountain access needs a separate check
Official tourism guidance generally favors summer for mountain exploration, but these three station tables cannot establish trail-opening dates, snow depth, avalanche conditions or whether a mountain road is passable. Borjomi is not a high-alpine monitoring station. A warm lowland forecast is not evidence that a high pass is safe or open.
Before committing to a mountain route, check current forecasts, local access information and route-specific advice. Keep a lower-elevation alternative and avoid tying an entire itinerary to one weather-dependent day. For destination context, start with our Kazbegi guide; do not turn a seasonal suggestion into an access guarantee.

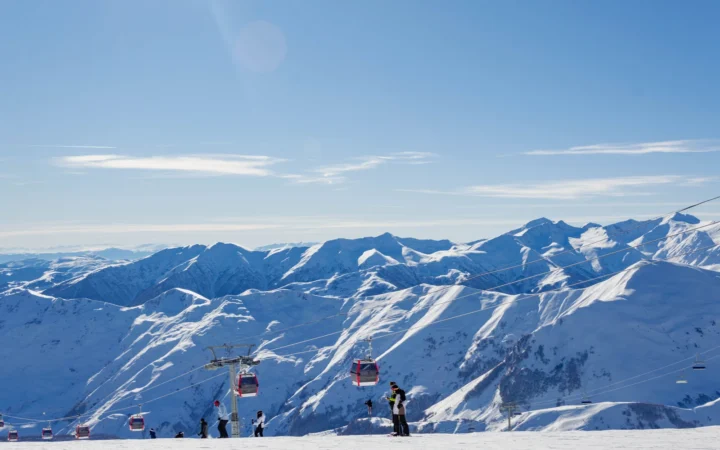
For a coast-and-city combination, allow for both heat and rain rather than searching for one national forecast. The Batumi travel guide covers that destination separately; remember that the coastal table here belongs to Kobuleti. Winter trips likewise require destination-specific planning: a city’s average nighttime temperature does not establish ski-area conditions.
Frequently Asked Questions
Is Georgia warm all year?
No. These normals show marked seasons. Borjomi’s January average low is about 25°F (−4.1°C), while Tbilisi has hot summer afternoons. Neither figure represents every part of the country.
Does a low monthly rainfall average mean my trip will be dry?
No. A climate normal averages many years. It does not predict rain on a particular day, and a monthly precipitation total does not describe how that rain is distributed.
Can I use the Kobuleti table as Batumi weather?
No. Kobuleti is a named station on the same broad Black Sea coast, not a Batumi measurement. Use a Batumi-specific forecast for an upcoming visit.
Are these current weather forecasts?
No. These are 1991–2020 climate normals. They provide a historical seasonal baseline; check a current forecast shortly before travel.
What Did We Learn Today?
Georgia has no single monthly weather pattern. Compare named destinations, distinguish average highs from extremes, and read rainfall totals separately from temperature. Tbilisi, Kobuleti and Borjomi offer useful contrasts, but none of these station records predicts your travel dates or proves that a high-mountain route is open.
Sources & Data Notes
- Tbilisi station data: WMO 1991–2020 normals, Georgia submission archived by NOAA NCEI.
- Kobuleti (Qobuleti) station data: WMO 1991–2020 normals, Georgia submission archived by NOAA NCEI.
- Borjomi station data: WMO 1991–2020 normals, Georgia submission archived by NOAA NCEI.
- NOAA NCEI: WMO climate normals: collection and reference-period context.
- Georgia Travel FAQ: official seasonal travel guidance.
Charts and tables use parameter 3 Mean (daily maximum temperature), parameter 4 Mean (daily minimum temperature), and parameter 1 Sum (precipitation). NOY records identify contributing years. Temperatures were converted with °F = °C × 1.8 + 32; precipitation with inches = mm ÷ 25.4. No missing values were imputed. These are station comparisons, not regional climate boundaries, forecasts or a trend analysis.
Featured photograph: Tbilisi panorama, © Vyacheslav Argenberg, CC BY 4.0, photographed June 25, 2014; cropped, resized and converted to WebP.