Two neighborhoods can be close on a map yet poorly connected by roads. A building can lie outside one flood outline without being free from flooding. A promising site can fail a basic environmental constraint. Applied geography turns these spatial differences into questions that can be investigated before a decision is made.
Applied geography uses geographic concepts, evidence and methods to address practical problems with a spatial dimension. It asks how location, connections, environments and communities affect a decision. Examples include investigating flood exposure, improving access to services and comparing potential sites. GIS can support this work, but it is not the whole discipline.
Choose a problem: Examine flood-exposure screening, compare access to a library, or follow site-selection requirements.
1. What makes geography applied?
Start with a decision, not just a map
The American Association of Geographers’ Applied Geography Specialty Group describes work that draws on human geography, physical geography, nature–society research and geographic information science to solve real-world problems. The common thread is the practical purpose, not one particular software package or type of map. It builds on geography’s wider study of places and connections.
A general question might ask how travel patterns develop across a region. An applied question could ask which neighborhoods would gain useful access if a library opened at a particular location. Both need sound explanations. The applied question also needs a defined decision, people affected by it, and a way to judge the consequences.
Theory and practice therefore reinforce one another. Ideas about distance, networks, environmental processes and inequality help explain observations. Practical investigations can reveal where those ideas need refinement. Applied work is not simply theoretical geography with the careful reasoning removed.
Three examples with deliberately limited claims
The maps below use fictional geometry created for teaching. Their buildings, roads, flood outline and candidate sites are not observations of a real place. Each example identifies a decision, the information a real investigation would need, and a limit on what the result could establish. None is a flood forecast, travel recommendation or development approval.
2. Flood exposure: which buildings need closer investigation?
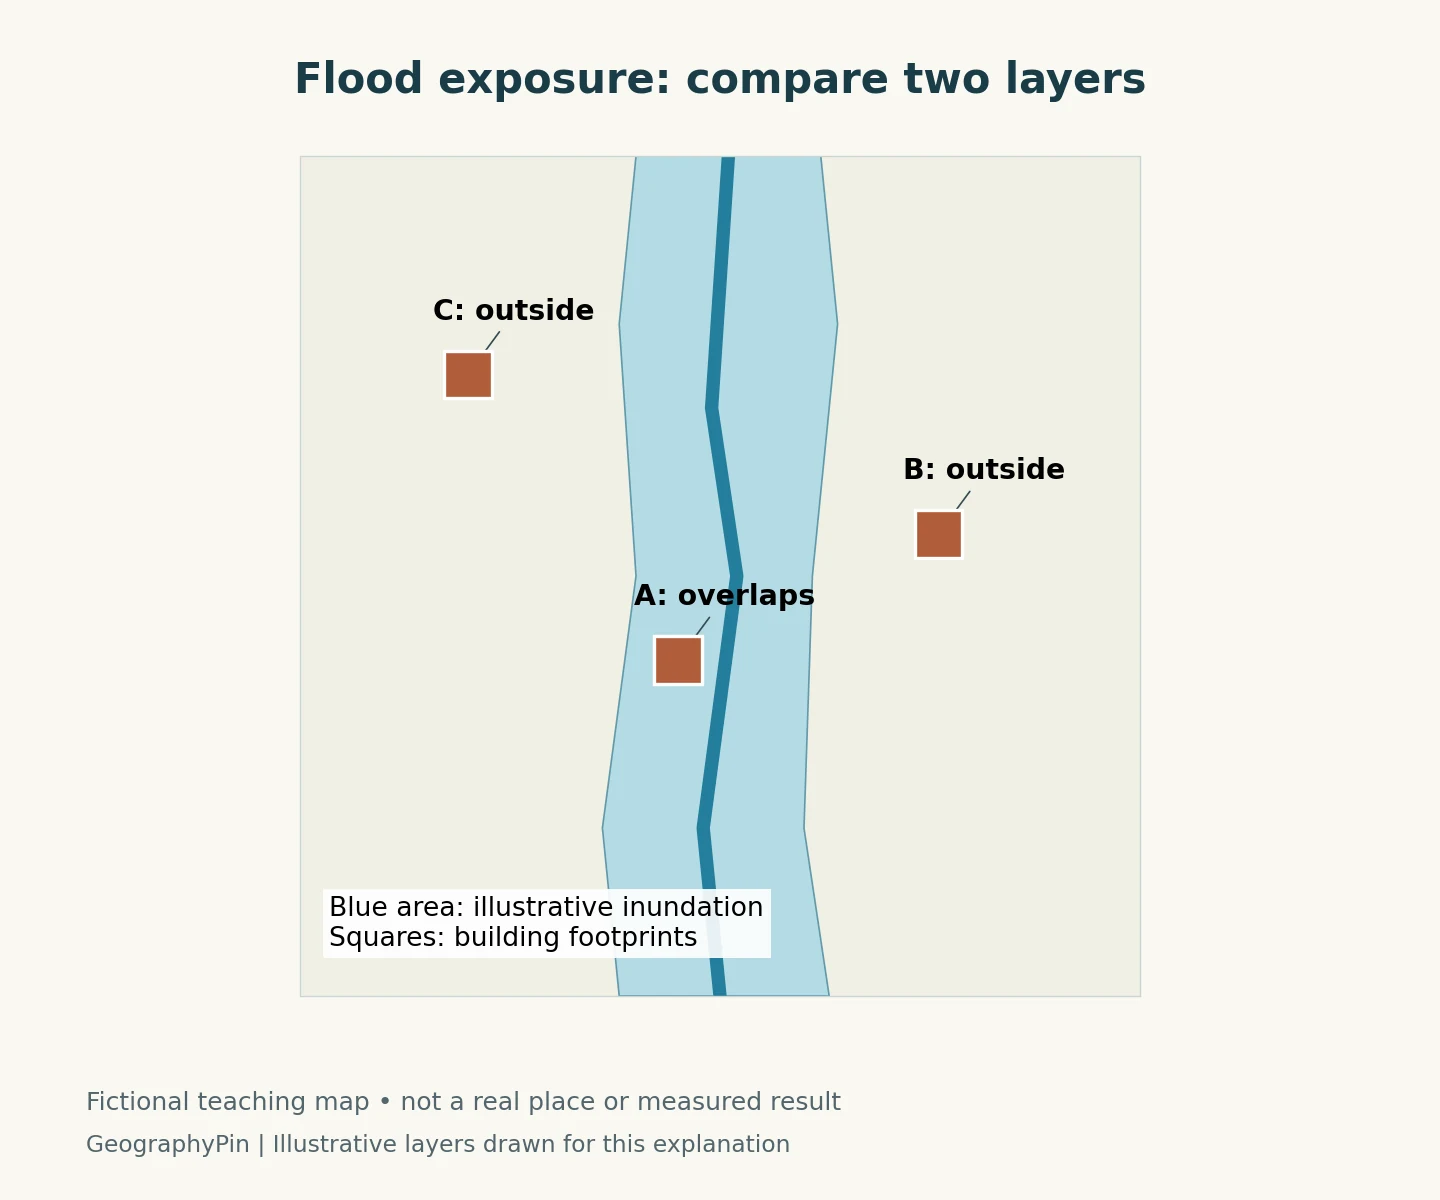
The blue area is an illustrative inundation footprint. Building A overlaps it; B and C do not. That simple comparison can identify A for further investigation under the scenario shown. It cannot establish that B and C are safe from every kind of flooding.
Match the map to the question
For a real screening exercise, the inputs might include a dated flood-inundation layer and current building footprints. They must align geographically and describe the relevant event or scenario. A river-level scenario, an observed flood extent and a regulatory insurance map are not interchangeable products.
USGS distinguishes its inundation mapping from NOAA flood forecasts and FEMA insurance mapping. Choosing the correct product is therefore part of the analysis, not a minor detail to check after the map is finished. A screening question about possible building overlap is also different from deciding whether a road is safe to cross during an emergency.
The useful output is a transparent list of features requiring closer attention, accompanied by the layer’s source, date, assumptions and coverage. Building use, floor level, protective measures and the people affected may require additional evidence. Exposure to a mapped scenario is not, by itself, an estimate of damage.
Investigate what the outline leaves out
A sharp boundary on a screen should not suggest perfect knowledge. Position errors in either layer can affect an apparent overlap, especially at an edge. The scenario may omit another flood mechanism or conditions outside its coverage. An analyst should examine those limitations rather than turning a preliminary map into a binary safe-or-unsafe verdict.
3. Service access: who can actually reach the library?
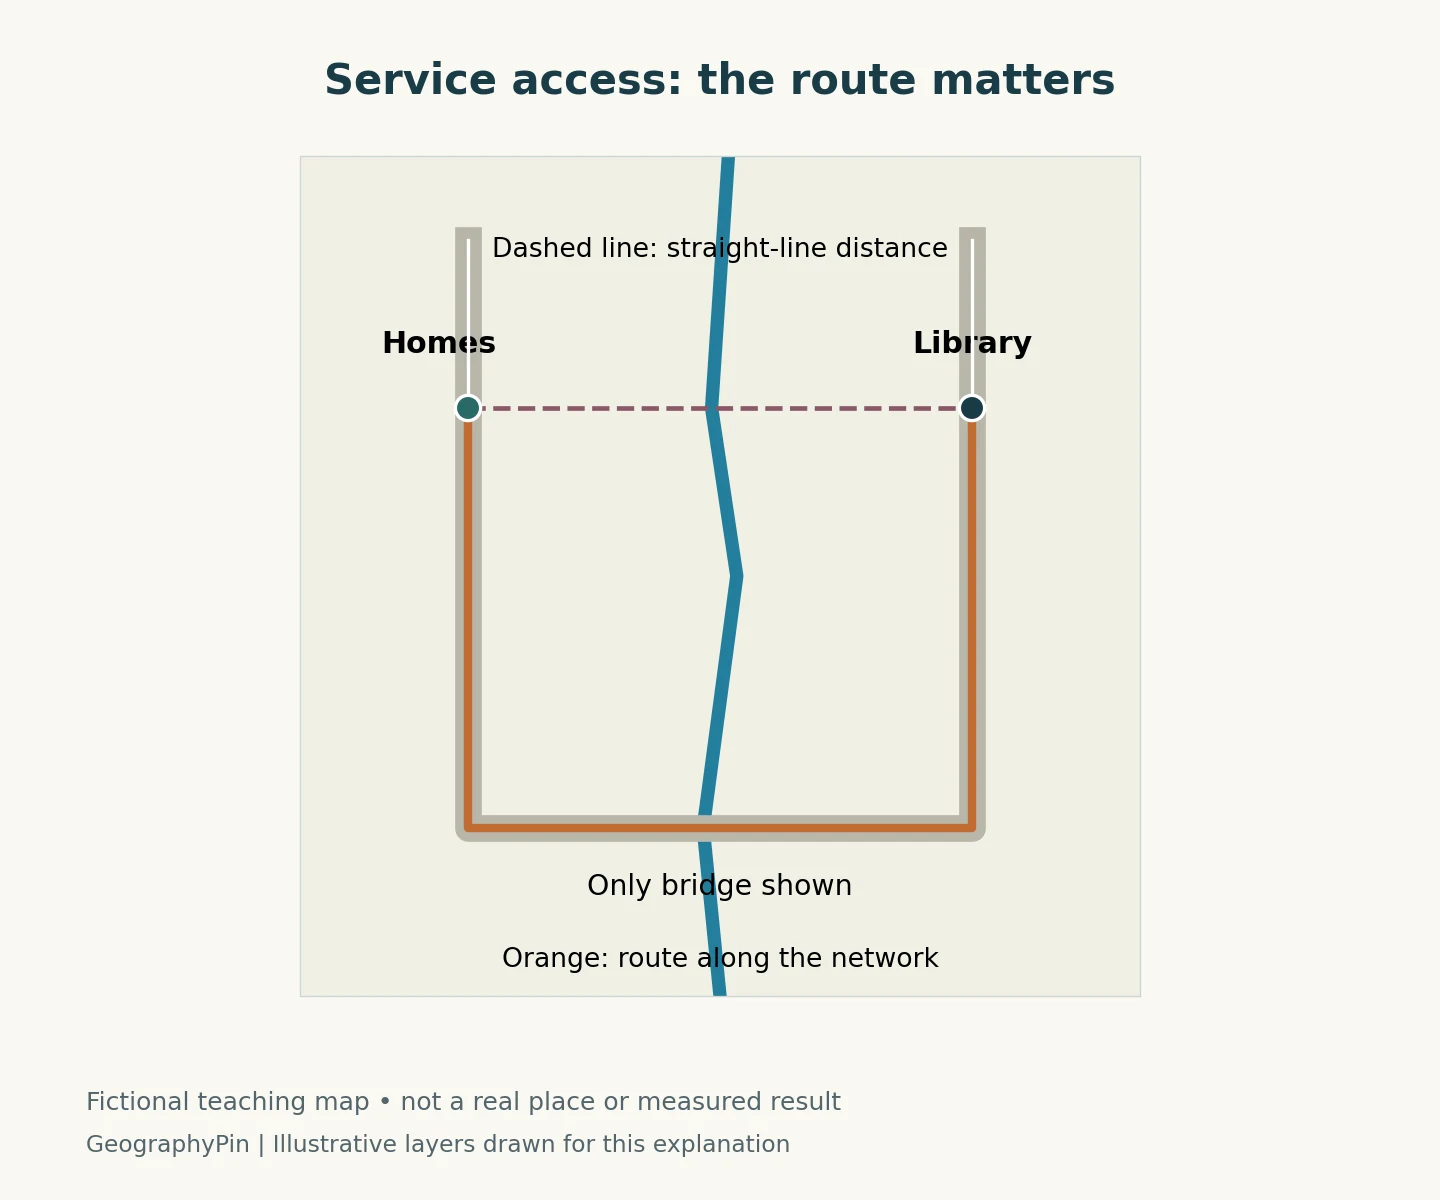
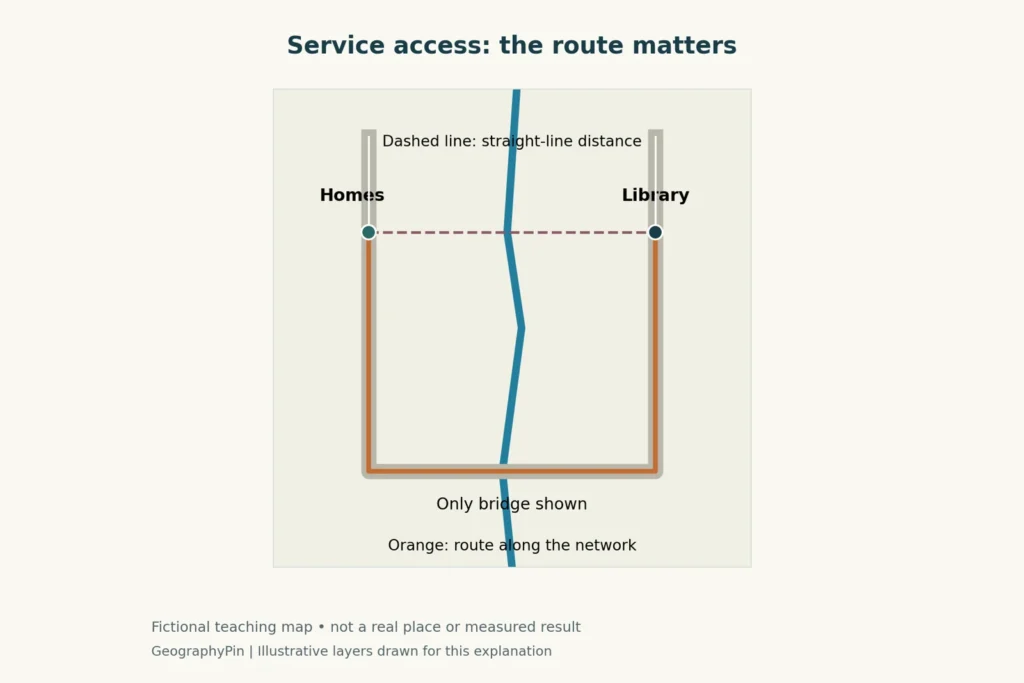
The homes and library are separated by a river. Their straight-line connection looks short, but the only bridge shown lies farther along the road network. The route must reach that crossing before returning toward the library. The example demonstrates a connection problem without claiming a measured journey time.
Measure a usable journey
A real access study needs the facility location, a suitable transport network and a defined travel mode. Walking, cycling, driving and public transport can produce different answers. Network restrictions, the direction of travel and the chosen time can also matter. Esri’s service-area documentation explains how accessibility can be analyzed using a stated network cost or travel-time cutoff.
A distance circle around the library does not answer all those questions. A neighborhood inside the circle may be separated by a river, railway or inaccessible road. Conversely, a longer geographic distance may be easier to travel along a well-connected route. These are questions about connections, not simply proximity, and they connect with the study of cities in urban geography.
Access is more than a line on the road
The decision might be whether to investigate a new branch, change opening hours or improve a connection. Each option needs evidence beyond the map. A reachable library may be closed when residents can travel, lack sufficient capacity, or be difficult to enter for some users.
A useful investigation combines spatial analysis with information from the people who would use the service. It should also distinguish populations represented in a dataset from those who are missing. The map is one part of understanding access; it does not replace knowledge of daily routines, practical barriers or community priorities.
4. Site selection: eliminate unsuitable options before comparing the rest
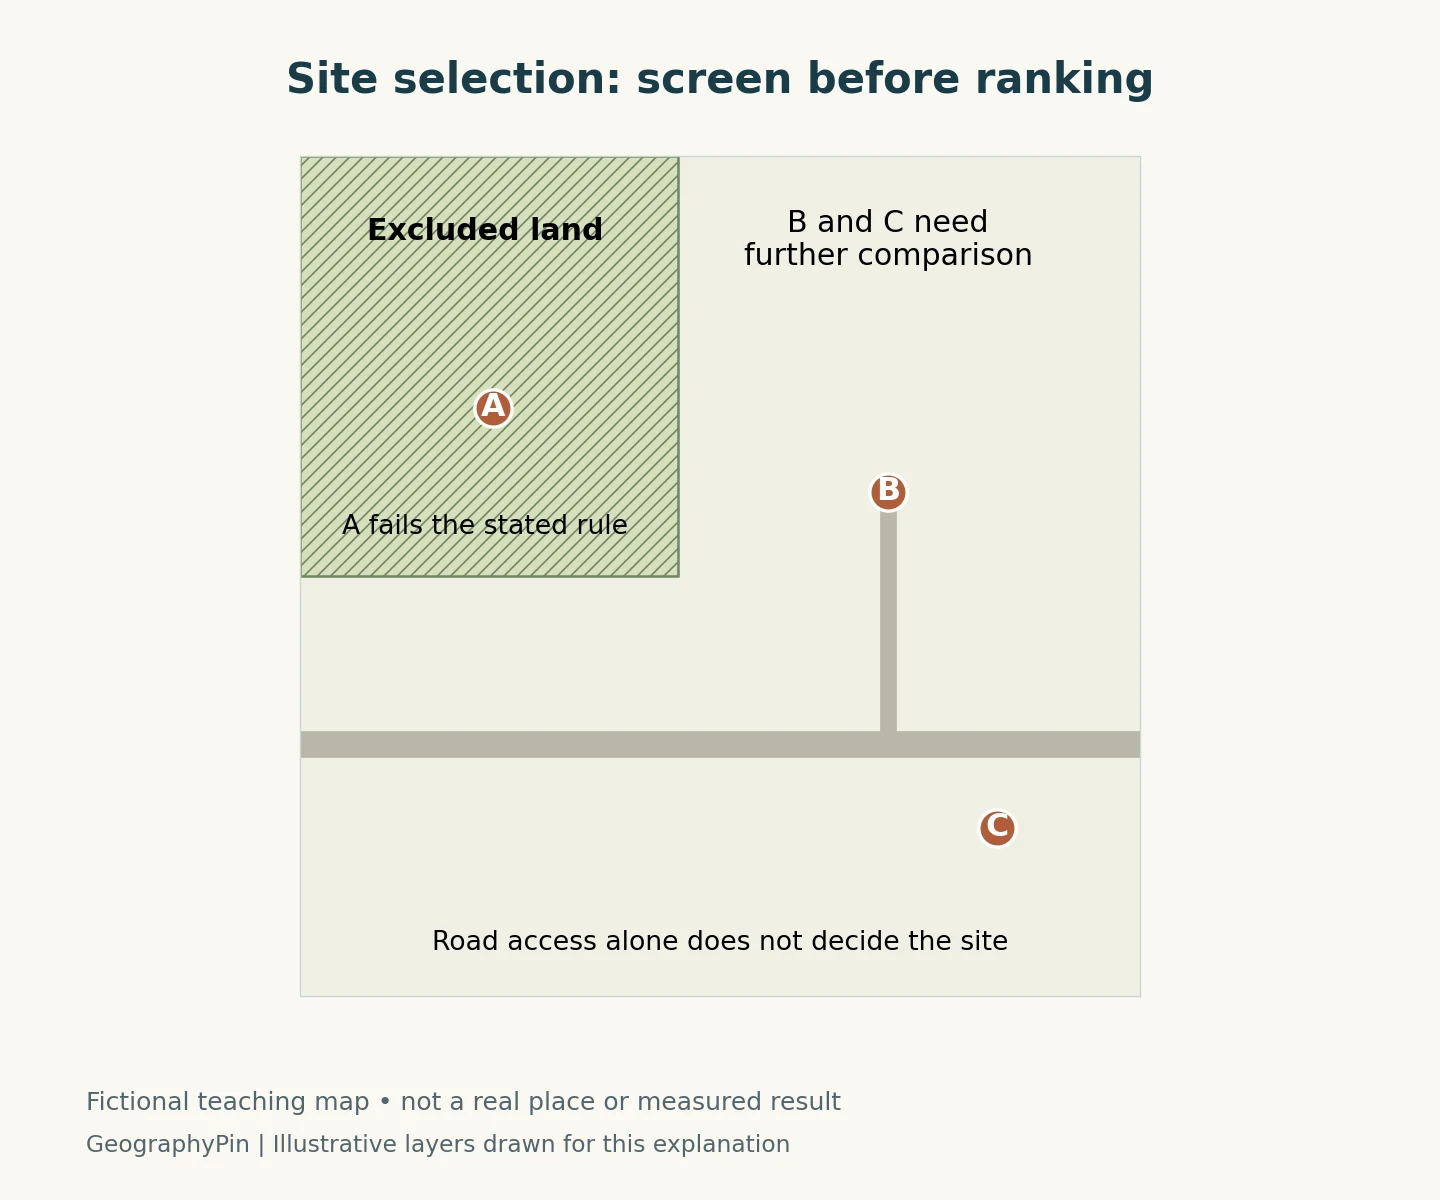
In this fictional example, the hatched area is excluded by a stated rule. Candidate A lies inside it, so A does not proceed to the next comparison. B and C remain candidates, not approved or universally “best” sites. The road alone cannot settle the choice.
Separate requirements from preferences
Some conditions function as constraints: a candidate either meets a requirement or does not. Other considerations are preferences that can be compared, such as access, cost or proximity to the intended users. The distinction must be explicit. A high score on convenience should not quietly cancel a binding exclusion.
A real dataset might combine verified parcels, access information and relevant land restrictions with evidence about costs and service needs. Data resolution must fit the decision. A broad regional layer may support an initial search but not a parcel-level conclusion. Apparent empty space on a map is not proof that land is available. Questions about the location of businesses and resources also connect this work to economic geography.
Test whether the ranking survives different assumptions
Suitability models often put criteria onto comparable scales and assign weights. Esri’s documentation notes that the choice of inputs, transformations and weights can be subjective. Different combinations of strengths and weaknesses can also produce the same total score.
A responsible comparison explains who selected the criteria and why. It tests whether modest changes in assumptions alter the preferred candidate. If B wins only under one narrow weighting scheme, that sensitivity is part of the finding. The outcome may be a shortlist for further investigation rather than a single recommended site.
5. Methods, uncertainty and responsibility
Applied geography can use field observations, interviews, statistics, remote sensing, mapping and GIS. Which methods belong in an investigation depends on the question. The AAG describes practitioners working in government, nonprofit organizations, universities and businesses, with approaches ranging from community participation to analysis of large datasets.
GIS is a tool, not a substitute for judgment
A geographic information system helps organize and analyze information by location. It can support the overlays, networks and comparisons illustrated here. It does not independently decide which problem matters, whether the inputs are appropriate, or whose priorities a criterion represents.
Useful work also protects people represented in the data. The AAG’s professional ethics statement emphasizes respect, participation and confidentiality. Fine-scale location data can expose individuals or communities, even when some inputs are publicly available. Share only the detail needed for the purpose, and consider who could be harmed by a map or interpretation.
| Question | What to record |
|---|---|
| What decision is being supported? | The choice, intended users and affected communities. |
| What information was used? | Source, date, geographic coverage, resolution and relevant permissions. |
| What assumptions shape the result? | Scenario, travel mode, exclusions, criteria and any weights. |
| How was it checked? | Appropriate observations, alternative assumptions and independent review. |
| What remains unresolved? | Missing data, uncertainty and decisions requiring further investigation. |
A clear report separates observations from assumptions and conclusions. It explains where the analysis applies and what would change the answer. That makes the result more useful than a polished map whose methods cannot be examined.
Frequently Asked Questions
Is applied geography the same as GIS?
No. GIS is one set of tools for working with spatial information. Applied geography is the broader use of geographic understanding to address practical problems, including selecting questions, gathering evidence and evaluating consequences.
Is Applied Geography also a journal?
Yes. Applied Geography is also the title of an Elsevier research journal. Here, the term describes the problem-solving field rather than the publication.
What Did We Learn Today?
Applied geography connects evidence about places, environments and people to practical decisions. Flood screening, service-access analysis and site selection require different information and cannot be reduced to the same map operation. A defensible result states its purpose, identifies its data and assumptions, tests its limitations and explains what still needs investigation before action.
Sources & Data Notes
The three maps are original GeographyPin schematic teaching illustrations. Their datasets consist of deliberately fictional river, road, building, exclusion-area and candidate-site geometry. They contain no real-world coordinates, measured travel times, flood probabilities, actual legal land designations or verified site rankings. They illustrate methods, not decisions for a real community. The source documents below support the underlying concepts, not the invented example geometry.
- AAG Applied Geography Specialty Group: purpose and definition.
- AAG: applied-geography approaches and areas of work.
- USGS: different flood-map products and their purposes.
- Esri: network service areas, travel modes and direction.
- Esri: suitability-model assumptions and criteria. Software documentation is cited for the method, not as a requirement to use a particular product.
- AAG: professional ethics, participation and confidentiality.
- Elsevier: Applied Geography journal, for the distinction between the field and the publication.
All conclusions in the worked examples are conditional on their stated fictional inputs. Building overlap does not estimate damage; network proximity does not establish usable access; exclusion screening does not provide permission to develop land. Real investigations need appropriate observations, local context and validation.