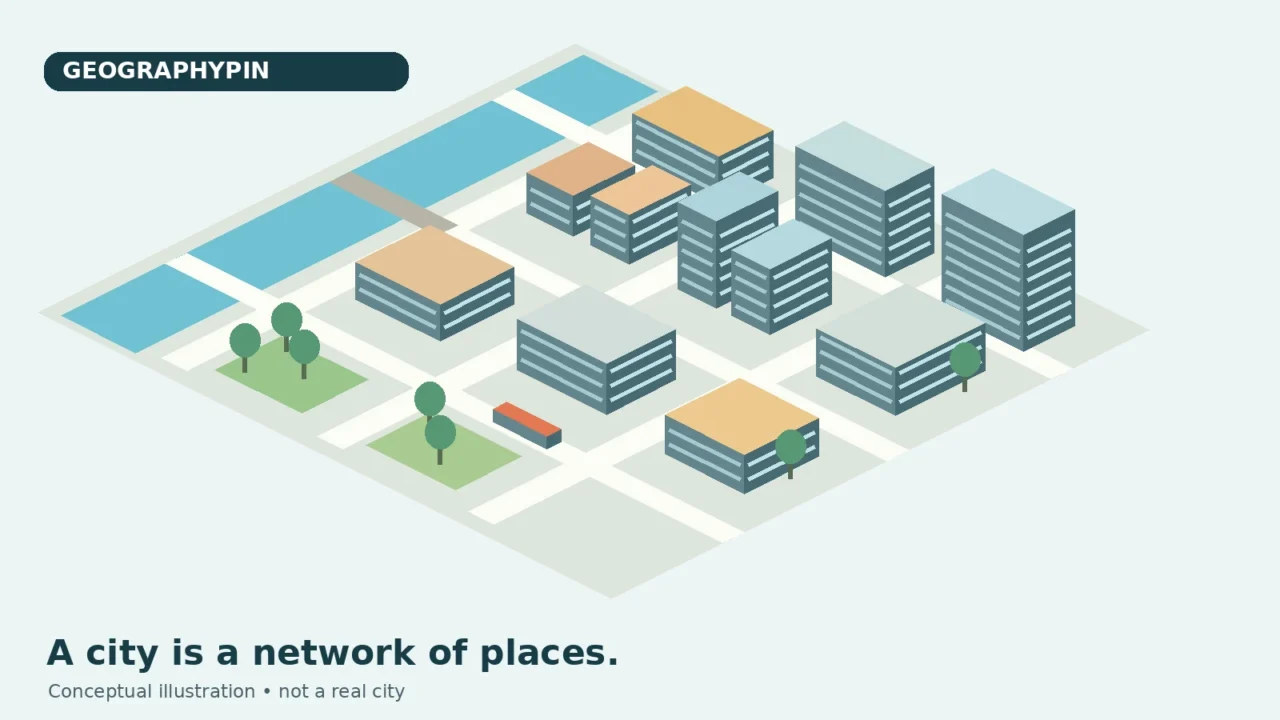
Urban geography is the branch of human geography that studies towns and cities as places, patterns and networks. It asks how housing, workplaces, transport and public spaces are arranged, why neighborhoods differ, and how cities connect with surrounding regions. Its distinctive question is not simply what happens in a city, but how location and spatial relationships help explain it.
- Comparing city populations? Start with which city boundary you mean.
- Wondering why nearby places feel far apart? See distance versus access.
- Reading a colorful transport map? Check what London’s PTAL measure does and does not show.
1. What Does Urban Geography Study?
A city can be studied from a single street to an entire metropolitan region. At street level, an urban geographer might compare where shops cluster and which crossings people use. At neighborhood level, the question could concern housing, services or access to green space. At regional level, it might be the relationship between homes in one municipality and jobs in another.
These scales connect. A new station is a local feature, but the people using it may travel across several administrative boundaries. A workplace can serve a nearby neighborhood while depending on workers, suppliers and customers elsewhere.
Within human geography, urban geography brings several kinds of questions together:
- Land use and urban form: what occupies the land, and how streets, blocks and buildings are arranged.
- Transport and access: how people reach jobs, schools, shops and other destinations.
- Housing and inequality: how residential opportunities and living conditions differ across space.
- Urban change: how redevelopment, population movement and changing activities reshape places.
- City-region relationships: how settlements connect through daily travel and other flows.
The field does not treat physical geography as irrelevant. A river, steep slope or floodplain can matter greatly. The urban question is how people build, travel, govern and make decisions in relation to those conditions. Neither the landscape nor the street plan alone explains the city.
2. Where Does a City Begin and End?
Three boundaries can answer three different questions
Before comparing cities, decide what area the comparison describes. A municipal boundary identifies a jurisdiction. A built-up footprint identifies developed land. A functional urban area describes a city together with its commuting zone. These are related concepts, not interchangeable outlines.
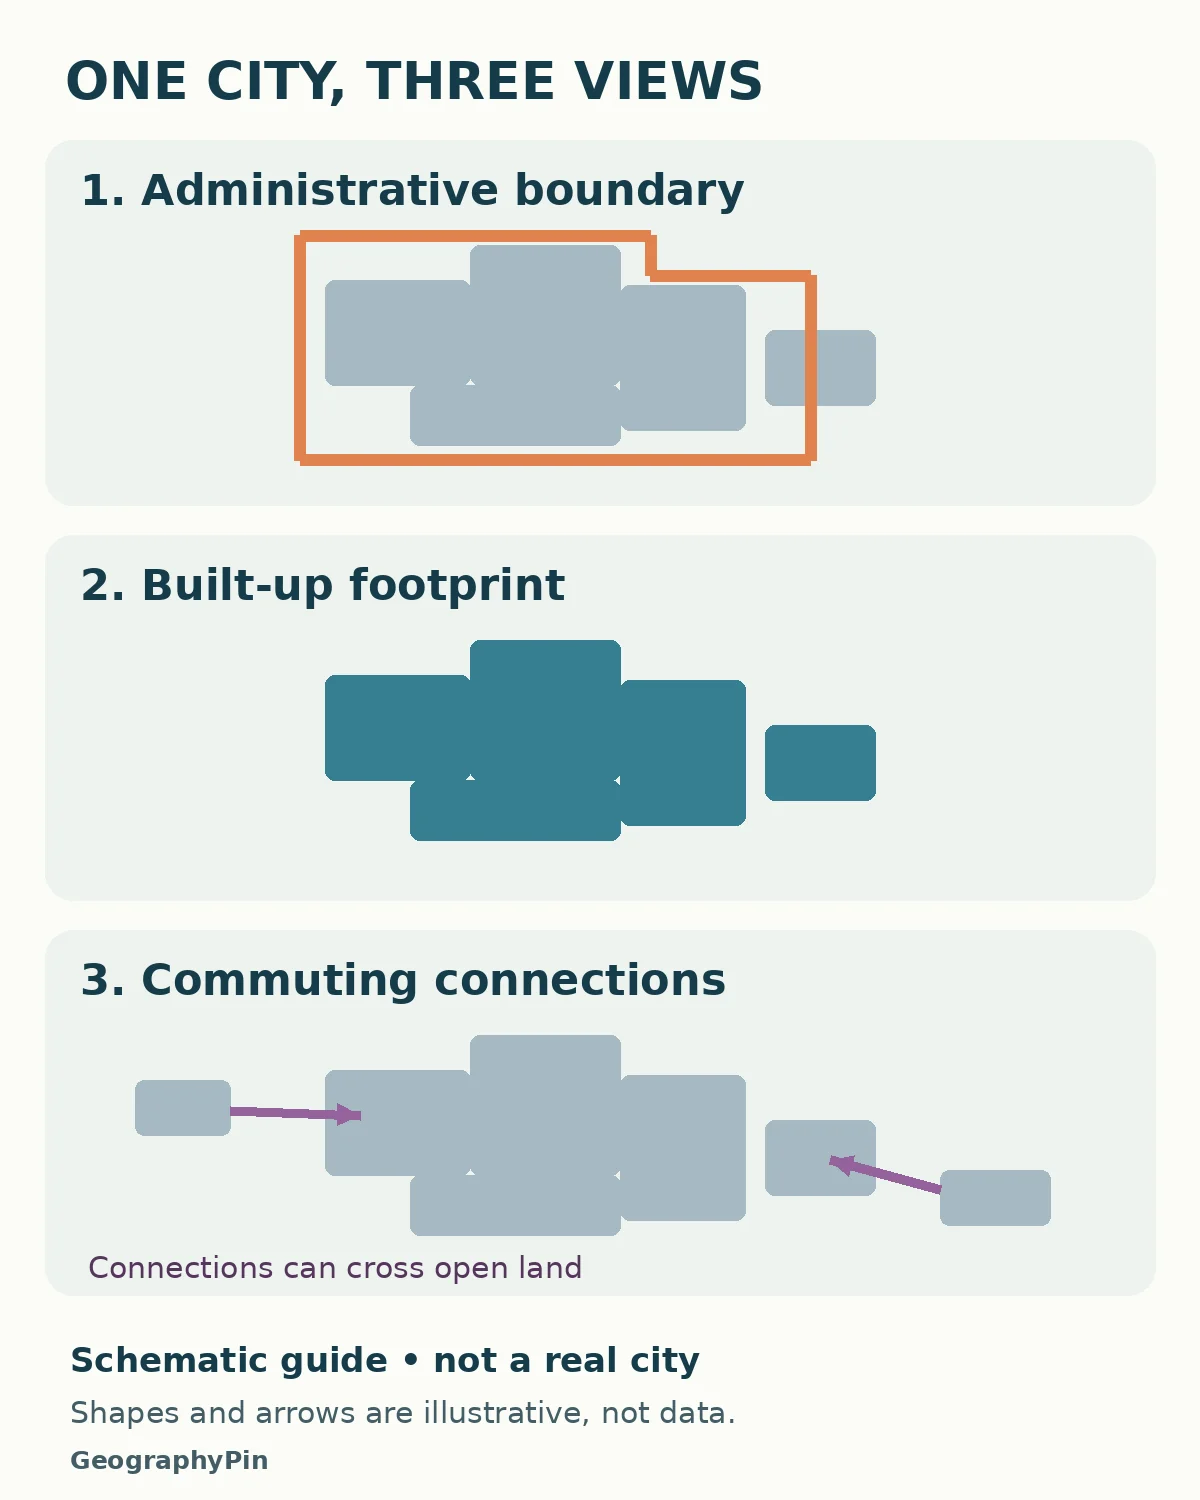
For example, Eurostat’s city-statistics method defines a functional urban area as a city plus its commuting zone. Its commuting criterion uses surrounding areas where at least 15% of employed residents work in the city. This is a specific statistical convention, not a rule that every country uses to grant city status. Eurostat explains the definitions here.
Britain’s Office for National Statistics also separates built-up geography from Travel To Work Areas. The latter describe areas where a large share of workers both live and work. That distinction illustrates why a settlement’s visible development and its labor-market connections need different evidence. The British and Eurostat categories should not be assumed to have identical boundaries or rules.
Imagine a continuous neighborhood crossing a municipal line. Counting only one municipality leaves out part of that developed settlement. Conversely, a municipality may include countryside beyond the main built-up area. A nearby town can remain physically separate while being closely connected by commuting.
Practical rule: compare like with like. A population for a municipality should not be ranked directly against another city’s metropolitan population without explaining the different units. Changing the boundary can change the answer even when nobody has moved.
3. How Land Use and Transport Shape Everyday Life
Distance is not the same as access
A straight line on a map measures separation, not the journey someone can actually make. A river with few crossings, a railway fence or a road without a safe crossing can turn a short-looking trip into a detour. A connected street network can offer several routes; a disconnected one may funnel journeys through a small number of links.
Transport service adds another layer. Being near a stop is different from having a useful service at the time you need it. Reaching that stop, waiting, changing vehicles and completing the final walk all matter to a real journey. Cost and individual mobility needs can also affect whether a technically available connection is usable.
A land-use map shows activities, not every experience
A residential block, office district, park and warehouse area serve different functions. Mapping them can reveal which activities are close together and which are separated. But a broad land-use label may hide a shop beneath apartments or homes above a workshop.
The same map also cannot tell you whether a home is affordable to a particular household, whether a public space feels welcoming, or whether a route is comfortable after dark. Those questions require other evidence. A map is most useful when its categories are clear and its limits are understood.
In a hypothetical neighborhood investigation, start by identifying homes, destinations and connections. Then ask which journeys are possible, for whom, and at what time. This is more informative than assuming the neighborhood nearest the center is automatically the best connected.
4. A Real Example: Reading Transport Access in London
What PTAL can tell you
Transport for London’s Public Transport Access Level, or PTAL, is a real example of turning spatial information into a useful indicator. TfL’s connectivity guide describes it as a measure combining proximity to public transport with service frequency. The categories run from 0 to 6b, with higher categories indicating better access to the network.
That is not a complete measure of every journey. The guide distinguishes PTAL from travel-time mapping and catchment analysis. A network-access score does not by itself tell you which destinations are reachable, how crowded a vehicle is, or whether a journey is step-free. TfL therefore advises interpreting the result in context.
The guide is a 2015 methodological reference, not a current neighborhood ranking. Its examples include forecasts as well as base-year conditions. This article does not reproduce those forecasts as observations or assign present-day scores to London neighborhoods. See TfL’s connectivity assessment guide for the original method and limitations.
The geographic lesson: first identify the question a map answers. Access to a transport network, time to a hospital and the number of jobs reachable are different questions. A well-designed study chooses a measure that matches its purpose instead of treating one attractive map as a universal score.
5. How Urban Geographers Test an Explanation
Urban research can combine mapped data, field observations, historical records and people’s accounts. The Royal Geographical Society’s urban fieldwork guidance describes land-use transects, classification keys, sampling and perception studies. It also warns that classifying buildings involves judgment. A repeatable method matters as much as a polished final map.
A spatial pattern is a starting point, not proof of a cause
The following examples are hypothetical teaching situations, not reported findings from a particular city. They show how an observation can become a testable question.
| Observed pattern | Possible explanation | Evidence still needed |
|---|---|---|
| Higher rents near a station | Transport access may be valued | Comparable homes, rents over time, supply and policy changes |
| Workplaces near a junction | Several routes may help firms and workers | Actual travel flows and the requirements of those activities |
| Vacant industrial buildings | The area’s use may be changing | Historical records, permits and current site conditions |
In the rent example, a station might be one influence among many. The homes could also differ in size, age, condition or nearby amenities. A single map of rents cannot separate those explanations. Even a before-and-after comparison needs care if other changes occurred at the same time.
Build a small investigation that another person could repeat
- Choose one question. For example, how do ground-floor activities differ along two nearby streets?
- Define the area and categories. Decide how to record mixed uses and empty units before collecting observations.
- Use comparable conditions. If counting people, record the day, time and unusual events rather than comparing unlike situations silently.
- Check what your method misses. A street-level survey may not reveal upper-floor uses or activities behind a closed frontage.
- Separate description from explanation. State what was observed, then identify which possible explanations remain untested.
Respect privacy and permission when collecting information. An ordinary observation exercise does not require photographing identifiable residents or publishing private details. Keep the focus on places and the question being investigated.
6. Urban Geography, Urbanization and Planning
Urban geography is a field of study. Urbanization describes a process involving the increasing urban share of a population, as explained in the UN Population Division’s glossary; it is not a synonym for every change within a city. A city’s population can grow while the national urban share stays similar if rural population grows too.
Urban planning concerns decisions about development, land use and infrastructure. Urban geographical evidence can inform those decisions, but describing a pattern does not automatically determine the best policy. A proposal can involve competing goals, costs and different effects on different groups.
For example, mapping where services are difficult to reach helps identify a problem. Choosing between a new service location, better transport and another intervention requires additional information and judgment. The map supports the decision; it does not make it by itself.
Urban geography also overlaps with economic, population, social and political geography. Its focus is the urban setting and the connections that give it shape. For the broader disciplinary picture, see the main branches of human geography.
Frequently Asked Questions
Can urban geography study a small town?
Yes. Questions about settlement form, land use, services and connections do not require a megacity. A small town can be especially useful for studying how a service center relates to nearby settlements. Be clear about which definition of urban you are using.
Do I need GIS software to study urban geography?
No. A carefully designed observation sheet, a permitted base map and a clear classification system can support a small investigation. GIS becomes helpful when combining layers, comparing areas or handling larger datasets, but software does not replace a good question or reliable evidence.
Is a satellite image enough to explain a neighborhood?
No. It can show aspects of the built environment, but it cannot directly reveal household circumstances, people’s experiences or why a change happened. Combine it with appropriate records and observations, and distinguish what is visible from what you infer.
What Did We Learn Today?
Understanding a city starts with choosing the right area and asking a precise spatial question. Administrative boundaries, built-up footprints and commuting regions describe different things; network access is not the same as a useful journey; and an observed pattern does not establish its cause. Urban geography connects those distinctions with evidence, helping us explain places without pretending that one map can tell the whole story.
Sources & Data Notes
The city-boundary definitions below belong to specific statistical systems. TfL’s 2015 guide is used to explain a method, not to report current transport scores or outcomes. The observation table is a hypothetical teaching framework, not a survey dataset. Any conceptual city illustrations accompanying this article represent an invented place, not measured boundaries or travel flows.