A country’s geographic center depends on what “center” means and which territory is included. One common method finds the area-weighted balance point of its mapped shape. Other methods use extreme coordinates, population or distances. Boundary choices and Earth’s curvature matter, so different well-defined calculations can legitimately produce different points.
How to use this article: Start with the balance-point idea, compare area and population centers, or examine how to evaluate a center claim.
1. There is more than one kind of center
Ask what is being balanced
A pin labeled “the center of the country” looks definitive. Before accepting it, ask a simple question: the center of what? Land area, population and a rectangle drawn around the country are different things. Each can produce a useful point, but they answer different questions.
The U.S. Geological Survey notes that there is no single generally accepted definition of a geographic center. One familiar definition treats the mapped area like a flat sheet of uniform material and finds its balance point. That does not make every other definition an error, nor does it stop an authority from adopting a particular method for a stated purpose.
| Type of center | What controls it? | What it does not automatically represent |
|---|---|---|
| Area centroid on a flat map | The distribution of area across the whole shape | The most populated or most accessible place |
| Bounding-box midpoint | The halfway point between the box’s opposite edges | The balance point of an irregular region |
| Mean population center | Locations weighted by population under a stated method | The geometric middle of the land |
| Census-style median population center | North–south and east–west lines that each divide population in half | Four equally populated quadrants or a shortest-travel point |
The right choice depends on the question. An atlas explaining country shape may use an area-based center. A demographic study may need a population center. A map application might use a convenient internal point to place a label. These outputs should be named rather than presented as interchangeable.
2. Area centroid versus bounding-box midpoint
The balance-point idea
For a flat polygon with uniform weight per unit area, the centroid is its geometric balance point. Every portion of the area contributes. A broad part of the shape matters more than a narrow extension of the same length.
For a simple rectangle, the centroid and the midpoint of its bounding box coincide. That familiar case can mislead us when the outline becomes irregular. An L-shaped region has a large empty space inside its surrounding rectangle, and the rectangle’s center ignores that missing area.
A worked example with an imaginary region
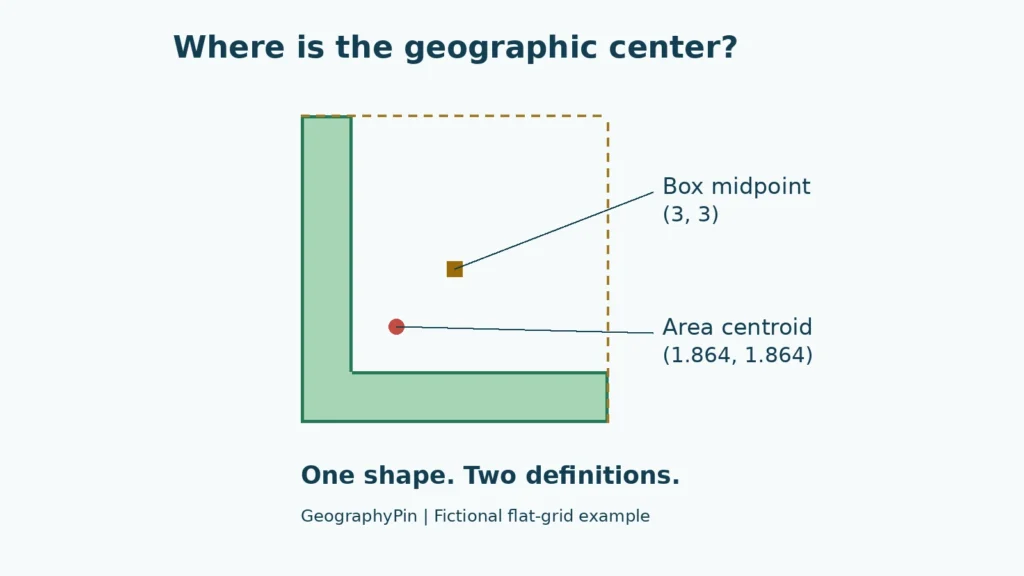
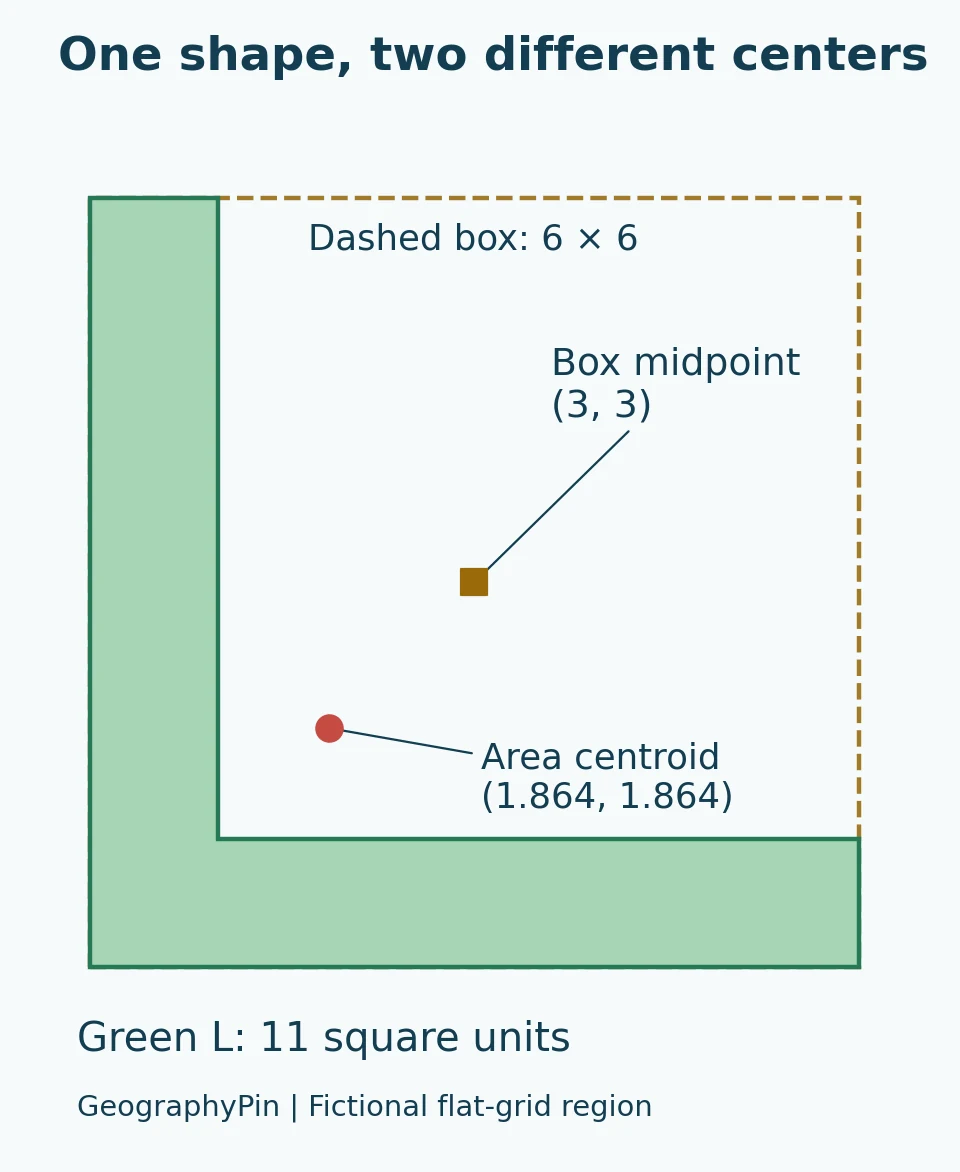
The green L in the diagram consists of a 6-by-6 square with the upper-right 5-by-5 square removed. These are arbitrary flat-grid units, not miles, degrees or a real country’s boundaries.
The remaining area is 11 square units: 36 minus 25. Subtracting the missing square’s contribution gives a centroid at approximately (1.864, 1.864). The bounding box still extends from 0 to 6 in both directions, so its midpoint is (3, 3).
Those two calculated points are different even though they describe the same outline. The arithmetic is reproducible: each centroid coordinate is (36 × 3 − 25 × 3.5) ÷ 11. The example is deliberately simple so the distinction does not depend on a disputed border or a complicated coastline.
Can the centroid be outside the region?
Yes. Both marked points fall outside this L-shaped polygon. A balance point is a mathematical property; it does not have to sit on the material being balanced. Concave shapes and regions made of separated pieces can produce centroids outside their boundaries.
GIS software distinguishes a true centroid from a point constrained to remain inside a feature. Esri’s Find Centroids documentation explicitly provides both choices. A point moved inside for labeling or another task should not silently be described as the unchanged geometric centroid.
3. Real countries add boundary and projection choices
Decide which territory counts
“Center of the United States” and “center of the contiguous United States” are different questions. Including Alaska and Hawaii changes the area being considered. Islands, inland waters and separated territories can similarly affect calculations elsewhere.
A careful result identifies the boundary dataset and what it includes. Does it represent land only? Are inland lakes excluded? Are offshore islands included? Is the calculation for the mainland or the entire stated territory? These are inputs, not details that can be settled after the center has been calculated.
Boundary resolution also matters. A coarse outline and a detailed shoreline do not describe exactly the same geometry. More decimal places in the final coordinates cannot restore information missing from the source boundary. Reporting precision should match the method and data, rather than imply a surveyed monument where only an approximation exists.
A flat map is not the curved Earth
The worked example uses a flat grid. A country occupies part of Earth’s curved surface, and projecting that surface onto a flat map changes geometric relationships. The chosen projection therefore belongs in the explanation of a calculated center.
Simply averaging a list of boundary coordinates is not a reliable substitute for an area calculation. It weights the listed vertices, not necessarily equal areas: adding extra vertices along one coast could change that average without meaningfully changing the region. Likewise, taking the midpoint of the northernmost, southernmost, easternmost and westernmost coordinates describes an extent-based procedure, not automatically an area centroid.
There are methods designed for spherical distances
Geographer Peter Rogerson proposed an approach minimizing the sum of squared great-circle distances from points throughout a region to its center. The published research abstract describes using an azimuthal equidistant projection, a two-dimensional center calculation and a transformation back to geographic coordinates.
The important lesson is not that every map must use that method. It is that a defensible calculation specifies its objective and its treatment of curvature. “I used GIS” is not enough: the software still needs a definition, geometry and calculation settings.
4. Population centers answer a different question
Put people, not land, into the calculation
Imagine a rectangular region with most of its population concentrated near one side. The land’s centroid stays fixed while its population-weighted mean shifts toward the larger concentration. There is no contradiction: the outline has not changed, but the weights have.
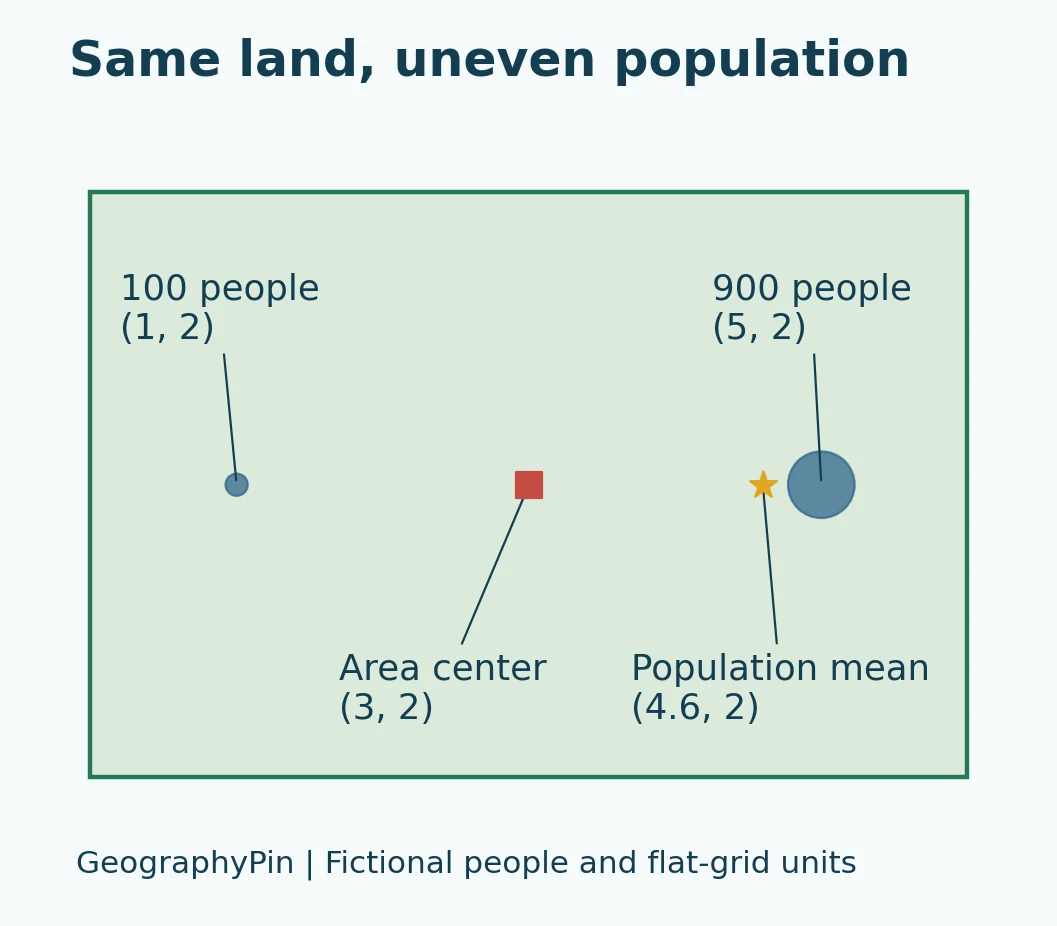
In this second, entirely fictional flat-grid example, one group contains 100 people at (1, 2) and another contains 900 at (5, 2). Their weighted mean is (4.6, 2), calculated as (100 × 1 + 900 × 5) ÷ 1,000 for the horizontal coordinate. The rectangle’s area centroid remains (3, 2).
This illustrates weighting, not the U.S. Census Bureau’s national algorithm. Real population-center work must also specify the population data, reference year, spatial units and geographic method. People represented by small-area data are not necessarily located at the exact center of those areas.
Mean and median are not the same
The Census Bureau describes its mean center of population with a balance-point analogy. Its published computation uses population-weighted coordinates and a latitude adjustment for longitude; it is not simply an uncorrected average of every resident’s longitude.
Its median center is defined differently: a north–south line and an east–west line through that point each divide the population into halves. That does not require equal population in all four quadrants. It is also not the same definition as a point minimizing the total distance people would travel. See the Census Bureau’s computation documentation.
A real example from the 2020 U.S. Census
For the 2020 Census, the mean population center was in Wright County, Missouri, northeast of Hartville. The median population center was in Gibson County, Indiana. The Census Bureau’s documentation also lists an approximate geographic center of area for the 50-state United States in Butte County, South Dakota, and a different one for the conterminous United States near Lebanon, Kansas.
These are not four competing answers to one identical calculation. They differ in what is measured or which territory is included. The population examples refer specifically to the 2020 Census, not a live estimate of where people reside today. The Bureau provides an official comparison map showing these distinctions.
5. How to judge a “center of the country” claim
Look for a method, not just a marker
A useful center claim should let another person understand how it was obtained. Before comparing two locations, check whether they use the same region, date, weights and mathematical definition.
Use this short checklist:
- Region: Mainland only, selected states, or the whole stated territory?
- Boundary: Which dataset, date and treatment of islands or water?
- Meaning: Area centroid, extent midpoint, population mean, median or another objective?
- Geometry: Which map projection or spherical method?
- Precision: Approximate location or a point supported by a documented computation?
A monument can be a meaningful local landmark without proving that all possible center calculations lead to its position. Conversely, a different mathematical answer does not automatically make the monument fraudulent; it may reflect a different definition or historical calculation.
Do not confuse centrality with accessibility
The geometric middle is not necessarily the best place for a hospital, warehouse, meeting or national capital. Roads, travel times, terrain, demand and administrative decisions introduce different questions. A centroid can be a useful starting summary, but it does not optimize every practical goal.
The same caution applies when comparing countries. A center point tells little by itself about how population, mountains or transport networks are distributed. To interpret a map well, read the method behind the point, not just the label beside it.
Frequently Asked Questions
Does a country’s capital have to be its geographic center?
A capital is a political and administrative location, not the output of a centroid calculation. It may be centrally situated or far from the geometric center. Determining its actual relationship to a center requires a defined calculation; the title “capital” does not establish that relationship. For a concrete example of political and planning choices, see why Canberra became Australia’s capital.
Can a geographic center move without the border changing?
A newly calculated point can differ because the definition, projection, boundary detail or inclusion of water changes. A population center can also move as the distribution of people changes while the country’s outline remains the same. State what changed before interpreting the movement.
Which center is the correct one?
The correct result is the one that answers a clearly stated question using a suitable, reproducible method. An area centroid is appropriate for an area-balance question; a population center is appropriate for a population-distribution question. Neither should be relabeled as the universal center for every purpose.
What Did We Learn Today?
A geographic center is not just a dot waiting to be discovered. Its position depends on the region, the definition of center and the way Earth’s surface is represented. Area centroids, bounding-box midpoints and population centers can differ without any arithmetic error. The most informative map states its method, distinguishes approximate results from precise measurements and never treats a convenient marker as the answer to every question about centrality.
Sources & Data Notes
The diagrams are original fictional planar examples, not calculated centers of actual countries. Their arithmetic can be reproduced from the dimensions and population weights shown in the text. Real national centers require explicit boundary, weighting and projection choices. The U.S. population locations refer to the 2020 Census; Rogerson’s proposed method is summarized from its published abstract.
- USGS: Geographic centers and definition choices
- Esri: Geometric centroids versus points constrained inside polygons
- Rogerson (2015): A New Method for Finding Geographic Centers, abstract consulted
- U.S. Census Bureau: Centers of Population Computation for the United States, 1950–2020
- U.S. Census Bureau: Geographic, mean and median centers comparison, 2020