A summer satellite image shows a city’s roofs and roads glowing in warm colors. A weather station nearby reports a much lower temperature. Both can be correct because they measure different things, a distinction central to understanding urban heat islands.
An urban heat island is an urban area that is warmer than its surrounding reference area. Built surfaces, reduced vegetation, building geometry and human-generated heat can all contribute. Surface temperature and air temperature describe different parts of the effect, so a hot rooftop image should not be read as a direct measurement of the air people breathe.
How to use this article: You can follow the heating mechanisms, separate surface from air temperature, check a temperature comparison, or compare cooling approaches.
Urban Surfaces Change How Energy Is Used
Absorption, storage and evaporation matter
Sunlight reaching a city can be reflected, absorbed, stored in materials or used to evaporate water. Replacing moist vegetation with dry paving changes the balance. Dark surfaces often absorb more sunlight, while less available water reduces evaporative cooling.
Buildings and roads can store heat and release it later. Vehicles, industrial activity and building heating or cooling systems also release waste heat. The U.S. Environmental Protection Agency identifies these influences alongside the geometry of streets and buildings.
Geometry matters because it changes shade, exposure to the sky and airflow. The result is not simply “all concrete is always hotter.” Materials, moisture, urban form, weather and the surrounding landscape interact.
Trees contribute shade, while evaporation from wet surfaces and transpiration through plants use energy to turn liquid water into vapor. EPA’s vegetation explanation describes these cooling mechanisms. They are more precise than saying plants merely “make cold air.”
Surface Temperature Is Not Air Temperature
Ask what the instrument actually measures
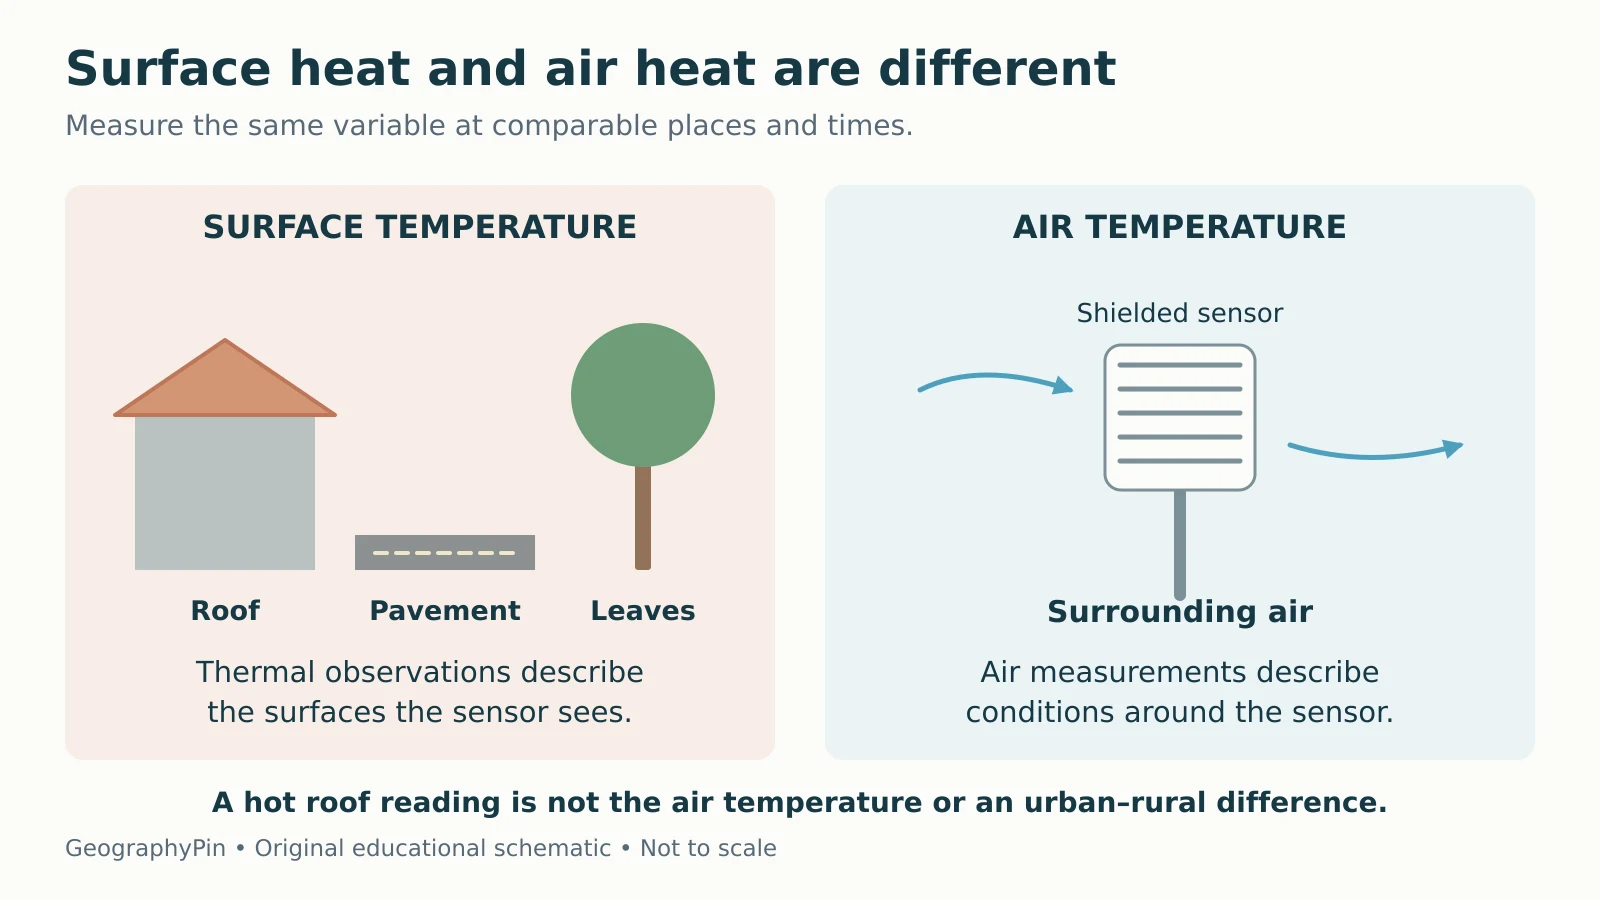
A surface temperature describes a roof, pavement, leaf canopy or other surface. A thermal satellite observation estimates the temperature of the surfaces visible to its sensor through the atmosphere. It does not directly measure the same air temperature reported by a standard weather station.
NASA’s land-surface-temperature guide makes this distinction explicit. A tree canopy can hide the ground below it, and a roof can be much warmer than the surrounding air on a sunny afternoon.

A surface heat island compares urban and reference surface temperatures. An atmospheric heat island compares air temperatures. Both are useful, but they should not be substituted for each other without an appropriate method and evidence.
The Pattern Changes Across the Day and the City
Sunlit surface contrasts can be strong during the day. Air-temperature contrasts often become more pronounced at night as urban materials release stored heat and some surrounding areas cool more quickly. This is a common pattern, not a fixed timetable for every city.
Health Canada’s urban-heat guide describes differences among neighborhoods and the importance of reduced nighttime cooling during extreme heat. Parks, industrial areas, shaded streets and densely built blocks can behave differently within the same urban boundary.
Wind, cloud cover, season and geographic setting affect the contrast. An urban-rural label alone cannot tell you how large it is at a particular hour. Even the choice of reference area matters: a dry field, irrigated farmland and a forest are different surroundings.
Urban heat islands are local land-use and energy-balance effects, while climate change alters the wider background climate. The two can interact; one is not a complete explanation of the other. The weather-versus-climate guide helps separate a particular hot day from longer-term conditions.
Compare Like With Like Before Subtracting Temperatures
A fictional example shows the difference
Imagine these simultaneous readings, taken only as a teaching example:
| Reading | Temperature | What it describes |
|---|---|---|
| Urban roof surface | 122°F (50°C) | The roof material |
| Shielded urban air sensor | 90°F (32.2°C) | Air at the urban sensor |
| Comparable reference air sensor | 86°F (30°C) | Air at the reference sensor |
The two air readings differ by 4°F (about 2.2°C). That is an air-temperature contrast for these chosen sites and this time. Subtracting the reference air temperature from the roof temperature instead mixes two different variables and does not establish the atmospheric heat-island intensity.
EPA’s measurement framework recommends consistent sensor placement, shielding, timing and representative coverage. One urban sensor and one rural sensor may not represent the whole city and its surroundings.
For a real heat map, check the measurement type, date, time of day, spatial resolution and reference conditions. Also check whether the map shows an observation, a model estimate or an average. Thermal satellite observations can be limited by clouds and by what surfaces are visible.
Match Cooling Strategies to Their Mechanisms
Different interventions change different parts of the balance
Cooling a city is not one uniform project. A useful plan connects the physical mechanism to the places and people it is meant to benefit.
| Approach | Main mechanism | What to check locally |
|---|---|---|
| Trees and vegetation | Shade and evapotranspiration | Suitable species, water, growing space and maintenance |
| Cool roofs | Reflect more sunlight and release absorbed heat effectively | Roof suitability, climate, insulation and seasonal energy effects |
| Shade for streets and public spaces | Reduce direct solar exposure | Where and when people need shade |
| Lower waste heat | Reduce heat released by energy use and transport | Building efficiency and local transport conditions |
EPA explains cool roofs through solar reflectance and thermal emittance. Their benefits depend on building and climate conditions; reflecting sunlight can also reduce useful winter heat gain in colder climates.
Vegetation needs appropriate growing conditions, and the benefits of a shaded space depend on access and location. Evaluate an intervention’s actual outcome rather than assuming that a changed map color proves every nearby person experiences the same improvement.
Heat Maps Are One Part of Assessing Exposure
A hot surface map helps identify patterns, but people’s exposure also depends on where they spend time, access to shade and cooling, indoor conditions and the timing of heat. A citywide mean can conceal hotter neighborhoods.
Health Canada emphasizes that urban heat can magnify the effects of extreme heat events. Reducing long-term heat accumulation and providing effective heat alerts or accessible cooling are related but different tasks. A geographic explanation does not replace current local heat guidance.
When assessing a project, ask: Did surface temperature fall, did air temperature fall, did people gain useful shade, or did indoor conditions improve? These are all meaningful possible benefits, but they are not identical measurements.
For a short test of the underlying mechanism, the climatology quiz includes the effect of replacing moist vegetation with dark paving. The full picture adds measurement choices, urban form, timing and the distribution of cooling benefits.
What Did We Learn Today?
Urban heat islands arise from interacting changes in surfaces, vegetation, geometry and human-generated heat. Surface and air temperatures measure different things, and their contrasts vary with time, weather and location. Compare matched observations, check the reference area and connect each cooling strategy to the outcome it is intended to improve.
Sources & Data Notes
The diagram is original and schematic. The three temperatures are fictional teaching inputs; Fahrenheit-to-Celsius conversions are rounded. The example illustrates a matched air-temperature difference, not a complete citywide assessment. No fixed temperature penalty or guaranteed cooling benefit is assigned to every city or intervention.