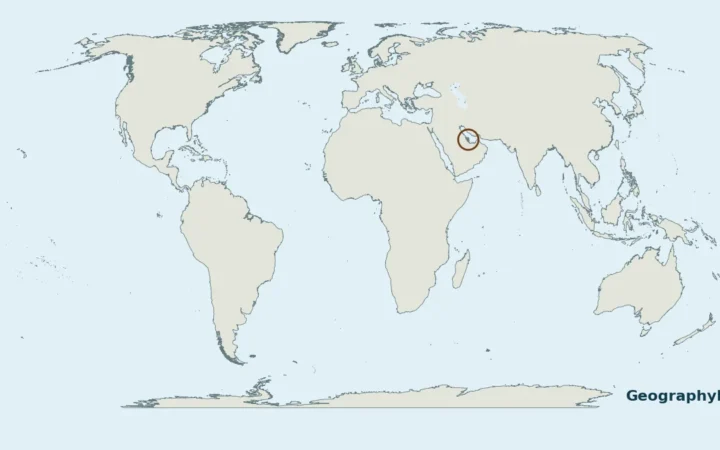
Liechtenstein, Singapore, Luxembourg, Ireland and Norway lead this ranking of the world’s richest countries by GDP per capita at purchasing power parity. The comparison uses 2026 estimates and projections from the IMF’s October 2026 World Economic Outlook. It measures economic output per person, adjusted for differences in price levels, rather than residents’ salaries or accumulated wealth.
First place: Liechtenstein, at about Int$198,987 per person.
Measure: GDP per capita in current purchasing-power-parity international dollars.
Year and source: 2026 IMF estimates/projections, October 2026 release.
Scope: Sovereign countries with a value in that dataset. Macao and Hong Kong are special administrative regions of China and are excluded from the country ranking.
Read the figures carefully: An international dollar is a comparison unit, not a payment each resident receives.
Top 5 Richest Countries by GDP per Capita, PPP
The table ranks the highest sovereign-country entries in the IMF’s October 2026 World Economic Outlook, using its 2026 GDP per capita, PPP series (PPPPC). All five figures use the same year, release and measure. They are rounded to the nearest international dollar.
On a small screen, swipe or scroll horizontally to see the full table.
| Rank | Country | GDP per capita (current international $) |
|---|---|---|
| 1 | Liechtenstein | 198,987 |
| 2 | Singapore | 176,927 |
| 3 | Luxembourg | 156,638 |
| 4 | Ireland | 149,642 |
| 5 | Norway | 116,169 |
Source: October 2026 WEO workbook, Countries sheet, PPPPC, 2026 column. These are not final full-year results. Countries without a matching value are not filled in from another year or source.
1. Liechtenstein
Liechtenstein’s small economy combines manufacturing with financial and other services. Its Office of Statistics identifies industry and financial services as important contributors to value added.
The same source gives a crucial warning: 58% of the workforce in 2024 consisted of inward cross-border commuters. Their work contributes to domestic production, but they do not all belong to the resident population used in a per-capita comparison. Liechtenstein’s first-place figure therefore needs particular care when discussing how much residents earn.
2. Singapore
Singapore’s economy extends well beyond banking. Singapore’s Department of Statistics lists wholesale trade, manufacturing, finance and insurance, and transportation among its major activities. In its 2025 breakdown, wholesale trade accounted for 19.7% of nominal GDP, manufacturing for 18.5%, and finance and insurance for 14.0%.
These sectors help explain the city-state’s economic profile. The national average still cannot describe the earnings, housing costs or circumstances of every household.
3. Luxembourg
Luxembourg is a financial center with cross-border banking, investment-fund administration and related business services. Its government’s economic overview also describes efforts to diversify into logistics, digital activities and other industries.
As in Liechtenstein, commuters matter. Eurostat explains that people who travel into Luxembourg to work contribute to its GDP without being counted as residents in the denominator. That helps explain why GDP per capita is unusually high, without implying that the figure is a typical resident’s income.
4. Ireland
Ireland’s GDP is strongly affected by multinational activity. Eurostat points to intellectual property and associated contract manufacturing, with a substantial share of the resulting income flowing to owners abroad.
Ireland’s Central Statistics Office therefore publishes modified gross national income, or GNI*, alongside GDP. Its preliminary 2025 national accounts put GNI* at 55.4% of GDP. GNI* removes specified globalization effects, including adjustments connected with intellectual property, aircraft leasing and redomiciled companies. This does not replace the IMF table’s measure, but it shows why a high GDP ranking is an incomplete guide to Ireland’s domestic economy.
5. Norway
Norway’s economy includes petroleum production and a large mainland economy. Statistics Norway reports mainland GDP separately from the whole-economy total, helping readers distinguish changes in domestic activity from petroleum-related developments.
Norway also illustrates the difference between output and wealth. The Government Pension Fund Global invests oil-and-gas-related revenues for current and future generations. Its accumulated investments are assets. Their total value is a different statistic from the annual GDP-per-person figure used here.
Why Macao and Qatar are not in this top five
Macao SAR has a 2026 IMF PPP figure of about Int$141,442 per person, which would put it fifth if the table included all separately reported economies. However, it is a special administrative region of China, so it is discussed separately rather than counted as a sovereign country.
Qatar remains a high-output economy, but its figure of about Int$103,804 falls outside the top five under this same 2026 measure. Earlier lists can differ because they use another year, another release, or a different set of economies. A ranking should state those choices rather than combine them.
Measuring Prosperity: GDP, PPP, GNI and Wealth
What the economic indicators measure
- GDP: The value of final goods and services produced within an economy during a period. Total GDP describes economic size.
- GDP per capita: GDP divided by population. It allows a comparison of output per person rather than the size of the whole economy.
- GDP per capita at PPP: The same output-per-person concept, converted using purchasing power parities to account for price-level differences between countries.
- GNI: Income accruing to an economy’s residents, including net primary income from abroad. It answers a different question from domestic production.
The IMF’s GDP explainer, its PPP methodology notes, and the World Bank’s explanation of GNI describe these distinctions. PPP is a conversion method, not a separate measure of someone’s savings. Figures in current international dollars should also not be treated as inflation-adjusted growth rates over time.
Why national output can differ from residents’ incomes
International businesses, ownership of intellectual property, income paid abroad and cross-border employment can create large gaps between domestic output and residents’ income. Ireland and Luxembourg show different versions of this problem. Describing every gap as a tax effect would miss the role of commuters and the accounting treatment of international production.
GDP is a flow; wealth is a stock
GDP describes production during a year. Wealth concerns accumulated assets. The World Bank’s wealth accounts consider produced capital, natural capital, human capital and net foreign assets. Household net wealth is another distinct concept, concerned with households’ assets minus liabilities. Neither is measured by the ranking above.
Factors That Support High Economic Output
Financial services, investment and business activity
Financial centers connect savings and investment across borders, while manufacturers and service businesses can sell to markets much larger than their home population. Luxembourg, Singapore and Liechtenstein illustrate different combinations of these activities. A small resident population can make output per person especially high when the economy draws extensively on international workers and customers.
Natural resources and tourism
Natural resources provide another route to high output, as Norway’s petroleum economy shows. Qatar also relies heavily on hydrocarbons. Tourism and gaming play an important role in Macao, whose official GDP release for 2025 describes the contribution of visitor demand and exports of gaming and other tourism services.
Resilience and adaptability
These strengths also create exposure to changes in foreign demand, energy production, travel and financial markets. Saving part of resource revenue and developing a wider range of industries are ways to reduce that exposure. Norway’s investment fund and Luxembourg’s diversification efforts offer concrete examples, although neither makes an economy immune to shocks.
How Global Events Affect Prosperity
Pandemic disruption and recovery
Macao shows how travel disruption can affect an economy built around visitors. In a release dated February 13, 2026, its Statistics and Census Service reported that real GDP grew by 4.7% in 2025 but remained at 89.6% of its 2019 level. A recovery in one year and a return to the earlier level are separate milestones.
Energy shocks and the cost of living
Resource wealth does not remove exposure to disrupted production or trade routes. The World Bank’s October 2026 Qatar outlook describes damage to liquefied natural gas infrastructure and shipping disruption through the Strait of Hormuz. It also notes that higher food prices place particular pressure on lower-income and migrant households.
Why rankings change
Output, population estimates, prices and statistical revisions can all change GDP per capita. The IMF revises its WEO data as new information becomes available. Keeping one dated release throughout a table makes the comparison reproducible; mixing a new forecast for one country with an old observation for another does not.
Looking Beyond the Numbers
Averages and inequality
An average can be high while many households have much lower incomes. GDP per capita does not show the distribution of wages or wealth, and adjusting it for PPP does not solve that limitation. Median disposable income and household wealth statistics answer more direct questions about typical residents.
What living standards also depend on
Housing costs, access to healthcare and education, public services and working conditions affect everyday life. A GDP ranking gives useful economic context, but it cannot establish which country is best for every resident or prospective migrant. The World Bank likewise cautions that GNI per capita does not directly measure welfare or reveal income inequality.
Prosperity over the longer term
A country can raise production while running down assets that support its future economy. The World Bank’s wealth framework therefore examines changes in the underlying asset base alongside GDP. Skills, infrastructure and natural resources help explain whether prosperity can last, not just how high this year’s output is.
Frequently Asked Questions
What is the richest country in the world?
On this article’s measure, Liechtenstein ranks first among sovereign countries with a 2026 value in the IMF’s October 2026 GDP-per-capita PPP dataset. A ranking by total GDP, household wealth or another year can give a different answer.
What are the top five richest countries?
Using 2026 IMF GDP per capita at PPP projections and excluding non-sovereign economies, they are Liechtenstein, Singapore, Luxembourg, Ireland and Norway.
Why is Macao not included?
Macao is a special administrative region of China. Its separately reported economy would place fifth if this table included territories as well as sovereign countries.
Does GDP per capita show the average salary?
No. It divides economic output by population. It includes output associated with businesses and government as well as workers, and it does not show how income is distributed.
Are PPP international dollars the same as US dollars?
They are a common purchasing-power comparison unit. PPP conversion adjusts for price-level differences; it is different from converting local currency at a market exchange rate.
Are the 2026 figures final?
No. They are estimates and projections from the October 2026 WEO release. Later releases can revise both the figures and their order.
What Did We Learn Today?
A useful richest-country ranking starts with a clear measure, year and list of eligible countries. GDP per capita at PPP compares output per person after adjusting for price differences. It gives valuable context, but household incomes, inequality and accumulated assets are needed to understand prosperity more fully. Cross-border workers, multinational businesses and natural resources help explain why the countries near the top look so different.
Sources & Data Notes
Checked November 9, 2026. The ranking uses the October 2026 IMF World Economic Outlook, published October 13, 2026: PPPPC, 2026, current international dollars per person. Values were checked against both the official workbook and IMF DataMapper, sorted before rounding, then rounded to the nearest international dollar. They are estimates/projections, not final annual results.
Coverage: The table shows sovereign countries with a matching observation in that release. Special administrative regions and aggregate groups are excluded. Missing countries are not assigned figures from another year or database. The national statistics below explain economic structure and measurement limits; their differently dated figures do not determine the ranking.
- IMF, October 2026 WEO workbook and GDP per capita PPP DataMapper: the ranking values. DataMapper is a live series and may show a later release when revisited.
- IMF WEO methodology: PPP conversion, estimates and revisions.
- Liechtenstein in Figures 2026, Office of Statistics, pages 16–19 and 22–24: economic structure and cross-border employment.
- Singapore Department of Statistics, Singapore Economy: 2025 industry breakdown.
- Luxembourg government, economic portrait: financial services and diversification.
- Eurostat, GDP per capita methodological notes: Luxembourg’s commuters and Ireland’s multinational activity.
- Ireland CSO, Annual National Accounts 2025, July 2, 2026: preliminary GNI* results and adjustments.
- Statistics Norway, national accounts and Norges Bank Investment Management, About the Fund: Norway’s economic measures and savings fund.
- Macao government, constitutional documents and 2025 GDP results: administrative status and the dated recovery example.
- World Bank, Qatar Macro Poverty Outlook, October 2026: hydrocarbon dependence, production disruption and household price pressures.
- World Bank, GNI per capita and The Changing Wealth of Nations 2024: income, distributional limits and accumulated assets.